

Abstract
The use of social and contact networks to answer basic and applied questions about infectious disease transmission in wildlife and livestock is receiving increased attention. Through social network analysis, we understand that wild animal and livestock populations, including farmed fish and poultry, often have a heterogeneous contact structure owing to social structure or trade networks. Network modelling is a flexible tool used to capture the heterogeneous contacts of a population in order to test hypotheses about the mechanisms of disease transmission, simulate and predict disease spread, and test disease control strategies. This review highlights how to use animal contact data, including social networks, for network modelling, and emphasizes that researchers should have a pathogen of interest in mind before collecting or using contact data. This paper describes the rising popularity of network approaches for understanding transmission dynamics in wild animal and livestock populations; discusses the common mismatch between contact networks as measured in animal behaviour and relevant parasites to match those networks; and highlights knowledge gaps in how to collect and analyse contact data. Opportunities for the future include increased attention to experiments, pathogen genetic markers and novel computational tools.
Keywords: contact analysis, contact network epidemiology, dynamic network model, infectious disease, network modelling, transmission dynamics
1. Introduction
Although there was optimism that the war on infectious diseases was over in the 1970s [1], humans are still faced with challenges of pandemics, as well as emerging and re-emerging diseases, many of which originate in animals [2]. Animal pathogens not only cause problems for humans (zoonoses), but infectious diseases also negatively affect the health of animals, including livestock and wild animals. Both livestock and wildlife can be infected by pathogens that infect multiple hosts; multihost pathogens have the potential to cause devastating effects on the livelihoods of livestock farmers, national economies and the environment via wildlife die-offs. Concern over multihost pathogens is increasing with compounding effects of land development, globalization and climate change. Infectious diseases in livestock can be exacerbated by intensive agriculture, as more individuals are concentrated in smaller spaces [3]. Additional infectious disease threats exist for wildlife, especially for small populations of conservation concern, which may be stressed owing to loss of habitat and are vulnerable to pathogens that ‘spill over’ from other more numerous hosts [4]. Larger human populations and more demand for space have led to increased contact between humans, wildlife and domestic animals, which creates more opportunities for pathogen transmission. The war on infectious diseases is clearly not over.
To understand how disease spreads through a population, we need to understand β, the transmission rate of infection. However, it is challenging to estimate β. Thus, it is commonly assumed that
| 1.1 |
where β is the transmission rate of infection, γ is the probability of pathogen transmission given a contact and K is the contact rate. From the perspective of the population, this formula can be thought of as a disease transmission matrix between pairs of individuals (β; ‘who transmits to whom’), represented by a contact matrix or mixing network between individuals (K) scaled by γ. This concept is visualized in figure 1, where black circles represent individuals or groups of individuals (nodes), and connections between nodes (edges) represent pathogen transmission events in the transmission network or contacts in the contact network. Note that the transmission network is typically a subset of the contact network, as not all contacts lead to disease transmission. Disease ecologists recognize that γ is challenging to estimate and therefore focus effort on quantifying the contact network [6]. Contact networks are thus conduits for transmission pathways of infectious diseases in populations [7,8].
Figure 1.
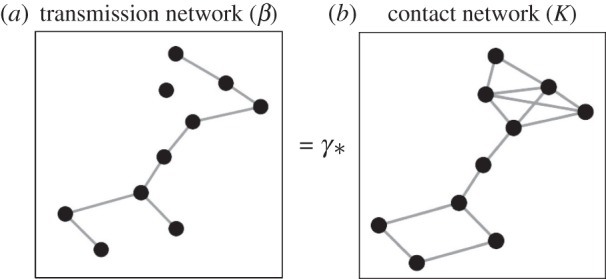
Conceptual model illustrating that a transmission network (β) is often represented as a contact network (K) scaled by a probability (γ). Black circles could represent individual animals, or groups of animals such as farms. Connections between circles represent pathogen transmission events in the transmission network (a) or contacts in the contact network (b). Figure adapted from the Serengeti lion networks [5].
The contact structure of a population fundamentally depends on behaviour, which can drive social interactions, animal movements, migration, dispersal, social systems and territoriality [9,10]. Contacts are an unavoidable consequence of sociality owing to the spatio-temporal concentration of potential hosts. For group-living species, social transmission of pathogens is a cost of living in groups [11–13]. While social transmission of pathogens can occur between conspecifics or members of different species, the nature and patterns of contacts vary as a function of species-specific sociality [14].
A wide range of scientists from animal behaviourists to anthropologists are interested in quantifying the link between sociality and health [14]. However, the linkage is not as straightforward as it might seem. It has been posited that increased sociality (e.g. more connections among the nodes in a network) influences health outcomes (e.g. risk of infectious pathogen exposure for an individual). Whether more sociality increases or decreases individual risk of disease is an unresolved issue [15]. Mathematical or dynamic models can be used to shed light on this debate, as they are useful tools for studying disease dynamics in populations. Dynamic disease models allow us to ask questions that are ethically or logistically unfeasible in the real world, estimate key epidemiological parameters, link data across scales, explain observed patterns and conduct ‘what if’ experiments by testing possible disease control measures [16].
Disease dynamics are often studied using modifications of a Susceptible–Infectious–Removed (SIR) model, where the temporal dynamics of susceptible, infected and removed members of the host population are tracked over time. Conventional SIR models assume that all individuals in a population, or subpopulation, are well mixed and therefore have homogeneous contact structure within that group or compartment. However, these assumptions overlook important heterogeneities at the population and individual levels and do not allow for the inclusion of superspreaders, which are individuals responsible for a majority of transmission events [17,18].
Network modelling, or contact network epidemiology, gained popularity for studying sexually transmitted disease transmission in human populations [19] and later through the discovery of superspreaders during the Severe Acute Respiratory Syndrome (SARS) outbreak in 2003 [20,21]. Network modelling approaches can easily incorporate a heterogeneous contact structure and are most useful when each individual is in contact with a small fraction of the population [22]. Network models are especially useful for designing targeted interventions, either for particular types of members of a population or for specific individuals. Network models could be considered the most general modelling tool, where specific types of networks include compartmental SIR models (where all individuals are connected to each other) or lattice-based models (where individuals are connected only to their neighbours) [6]. Alternatively, network models could be considered an extension of an SIR model that incorporates more realistic contact structures, although network models are not as data hungry or computationally intensive as agent-based or individual-based spatial models [22]. The choice of model type is considered ‘a skill in itself’ and is dependent on the question asked, the quality of empirical data and the needed output [22]. Choosing the correct type of model is important; for example, compartmental SIR models can overestimate the speed of an outbreak if heterogeneous contacts are present but not captured in the model [23,24]. Although network modelling has been proved to be a useful tool to study transmission of infectious diseases in human populations [7,25–27], it has generally been an underused approach for investigating disease dynamics in wildlife [6] and livestock populations [28,29].
This review article will focus on the use of contact networks to answer questions about infectious disease transmission in wildlife and livestock. I will describe how to combine animal contact data with network modelling, often with a cautionary tale. This review will: (i) highlight why wildlife and livestock often have a heterogeneous contact structure; (ii) illustrate the rising popularity of network approaches for understanding pathogen transmission in animal populations; (iii) discuss the common mismatch between contact networks measured in animal behaviour and pathogens that match the contact networks; (iv) highlight knowledge gaps; and (v) propose opportunities and ways forward for the field.
2. Heterogeneous contact patterns in wildlife and livestock
Infectious diseases spread through transmission routes that vary in contact intensity along a spectrum from indirect to direct transmission, where contact might be thought to increase in importance for transmission as one moves from environmental contamination to vector-borne, and then to aerosol, to close-contact, and finally to sexually transmitted pathogens [30]. Accordingly, the definition of what constitutes a contact relevant for disease transmission varies according to the pathogen of interest. For example, anthrax is spread via ingestion of spores from endemic environments, rabies is transmitted through the bite of a rabid animal, and sexually transmitted infections are spread via sexual interactions. The extent of pathogen spread on a contact network is not only dependent on how a contact is defined, but is also dependent on both population and individual-level phenomena. Often there is variation, or heterogeneity, in the probability of contacts between individuals, leading to different macroscale network architecture between populations. Finally, it is worth noting that many pathogens have multiple transmission pathways; some sexually transmitted pathogens, for example, also spread vertically from mother to offspring.
At the population level, pathogens are expected to transmit faster and more extensively in populations that have less social or spatial structure (also known as modularity [15,31]), more variation in group size [32] and more movements or more connections between groups [33]. Wild animals often have a heterogeneous contact structure owing to their territorial nature, spatial distribution of individuals across heterogeneous landscapes or complex social systems [5]. Wild animal social systems can also vary between populations in different ecosystems owing to varying resource availability. For example, jackals live in small family groups unless they have access to ample food sources, in which case they live in larger communities [34,35].
For livestock, including poultry and managed fish populations, contact structure is also heterogeneous, but instead of being tied to social systems, contacts are typically dependent on group size, spatial structure and animal movements, which are frequently controlled by human management actions [28,36,37]. For example, swine in typical commercial systems in the US are grouped into rooms in buildings on farms, and there are scheduled movements of swine between rooms [38] and farms. Livestock movement networks (e.g. cattle, swine, poultry, farmed fish) are often directional and can be weighted by the number of animals moved, or the frequency of movements. Of course within a spatially restrained group, as defined by a farm, pen, pond or building, livestock could also have preferential associations owing to social structure [39,40]. Therefore, animal behaviour might be more important in driving within-group contacts than between-group contacts in livestock.
On an individual level, there is variation in the probability that an individual is exposed, gets infected and subsequently transmits a pathogen. Superspreaders are an extreme version of this variation. The concept of a superspreader has been expanded to include supershedders [41,42], and could be expanded further to include ‘supersusceptibles’ that easily get infected or ‘supermovers’ that might connect distant parts of a network. The cause of variation in these ‘super’ categories could be owing to a range of factors associated with the individual host, including host genotype, prior exposure to the pathogen (leading to an ability to rapidly produce antibodies), demographic class, behaviour and/or coinfection status. Demographics include age, sex and body size, which could also correlate with behaviour. Individual behaviour can vary along a continuum of behavioural types (personalities), such as shy versus bold (e.g. lions [43]), levels of aggression or activity, or dominance in group-living wildlife and livestock [44]. Individual behavioural types also affect interspecific contacts, as seen in badger–cattle interactions where higher-ranked cattle were more likely to have contact with badgers [45]. Major histocompatibility complex genotype, whether or not individuals are infected with other pathogens (i.e. co-infection), or their stress level can also determine how susceptible the individual is to infection, and how infectious the individual might become [46]. Heterogeneity in pathogen transmission at both the population and individual levels can create challenges for understanding the complex mechanisms influencing the spread of infectious diseases in populations, yet network modelling can be a useful tool to incorporate this complexity.
3. Increasing interest in social network analysis and network modelling
The terminology surrounding ‘networks’ and its associated uses can be confusing because the word ‘network’ is used in both social network analysis (SNA) and network modelling. However, the two concepts are quite distinct. SNA is used to describe the contact structure of a population, whereas network modelling is a flexible tool by which to introduce and simulate a contagious process on a descriptive social, association or contact network [21,47]. SNA, also known as network analysis or contact analysis, has recently gained popularity in the field of animal behaviour to quantify animal social networks and to compare social networks within and between species [9,10,48]. SNA has also been used to investigate potential pathogen spread in wildlife. For example, SNA has been used to determine which individuals are at high risk of infection [49,50], identify traits of highly connected individuals [51], inform disease management policy [52] and correlate highly connected individuals with high rates of parasite infection [53].
SNA can also describe the heterogeneous network of livestock or poultry movements, often with the intention to determine the risk of disease spread in populations, identify high-risk herds or target surveillance [54–61]. In many cases, SNA has identified that a small percentage of farms contribute to the majority of livestock and poultry movements, and hence risk of disease transfer; these particular farms are the ones to target for increased surveillance or interventions [62–64]. Alternatively, SNA has shown that livestock movements are not a risk-factor for infectious diseases [65]. For fish, SNA has been used to identify aquaculture sites in a farmed-fish network that should be targeted for parasite control [66] and to explain virus infection pressure caused by water transport [67]. SNA typically represents interactions on static networks. However, the social network could be subdivided to represent contacts or movements occurring during different time periods: for example, by constructing different social networks in the breeding and non-breeding seasons [68], or between years with variable rainfall [69] or changes in the poultry and livestock trade network across seasons [70,71] and across years [58]. Descriptive network measures can also be used to compare competing models, such as for describing livestock movements dependent and/or independent of distance between farms [72].
Network modelling can build on the same data as SNA. The structure of the contact network influences how pathogens transmit on the model network [33,73]. For example, even with the same number of individuals and same number of effective contacts, when the configuration of the network is changed, it can affect both the rate at which individuals become infected and the final size of a disease outbreak [6]. Thus, it is important to get the most accurate contact structure possible, yet this must be weighed against the costs: collecting contacts can be time- and data-intensive. High-resolution data on contacts can be obtained from behavioural studies and new technology [6], including livestock tracking and reporting systems (e.g. active and passive radio-frequency identification (RFID) tags). Network modelling is now more feasible for animal systems owing to an ability to collect high-resolution contact data and to integrate the contact data into new theoretical approaches.
Network models can be used to understand factors behind disease outbreaks, design effective surveillance and evaluate the consequences of disease outbreaks [74]. Contact network models have been used to predict the spread of exotic diseases between river catchment areas owing to anthropogenic movements of fish [75] and to recommend that the fish industry be designed around epidemiologically isolated management areas [37]. Network modelling has been used in wildlife systems to: identify the most connected individuals to target for vaccination [76]; illustrate that current vaccination levels may be inadequate to prevent large outbreaks [77]; identify the most important behaviour for disease transmission [78]; and incorporate seasonal-mixing preferences in models [79]. For livestock, network modelling and simulations have highlighted that disease transmission through livestock movements could explain the initial spread of the 2001 foot-and-mouth epidemic in the UK [80] and that network properties can direct targeted surveillance [28].
A combination of increasing exposure to network concepts and the wider application of novel technology has led to an increase in the use of SNA and network modelling for wildlife and livestock. According to a search run in the abstract and citation database of peer-reviewed literature, Scopus, with the search terms ‘contact network’ or ‘contact analysis’ or ‘social network’ or ‘social-network’ or ‘association network’, publishing trends have shown a general increase for wildlife and livestock systems (figure 2). The first publications met this criterion in 2003. As can be seen by the variety of ‘network’ and ‘contact’ terms used for the citation search underlying the trends in figure 2, network terminology is not standardized. Similar approaches can be called various terms in different disciplines, making it challenging to do comprehensive literature searches; therefore figure 2 likely underrepresents interest in network approaches.
Figure 2.

The number of publications in Scopus per year containing the search terms ‘contact network’ or ‘social network’ or ‘social-network’ or ‘association network’ or ‘contact analysis’ and ‘disease’ or ‘pathogen’ or ‘parasite’ in the title, abstract or keywords. The ‘wildlife’ category refers to publications with the search terms ‘wildlife’ or ‘wild animal’ or ‘social insect’, whereas ‘livestock’ refers to publications with the additional criteria of ‘poultry’ or ‘cattle’ or ‘cows’ or ‘swine’ or ‘pigs’ or ‘turkeys’ or ‘fishes’ or ‘livestock’ and not ‘Turkey (republic)’ and not ‘humans’. Search was run on 12 June 2014. This is an underrepresentation of publications, as many wild animals, such as mice, raccoons, apes and chimpanzees, did not show up in the ‘wildlife’ search.
4. Challenges of network modelling
(a). Mismatch between contact network and pathogen
Two types of missing data are common for network modelling: a lack of knowledge about contact patterns or a lack of information on infection patterns. Here, each of these is discussed in turn. The type and main cause of missing data might differ when considering wildlife or livestock.
(i). Lack of knowledge about contact patterns
Efforts to construct realistic network models can be hampered by a lack of detailed contact data. Although disease outbreaks in wildlife populations are notoriously difficult to observe and measure, in some rare situations outbreak data can be collected. This can occur when virulent pathogens cause high mortality in an easy-to-detect species (e.g. large marine mammals washing up on beaches or massive numbers of dead fish in lakes), or in well-monitored populations where individually identified animals disappear or carcasses are found [81,82]. Prevalence and incidence data are sometimes available for pathogens that cause clinical signs, such as tuberculosis in meerkats [83], mycoplasmal conjunctivitis in house finches [84] or rabies in carnivores [85]. In the uncommon situations where wildlife disease outbreaks have been observed, detailed contact data are often lacking, even to the point of not knowing the host abundance or social system. Without knowing the empirical social contacts, the wide choice of potential network structures makes the design of network models challenging. Thus, without contact patterns we are not able to tease apart competing hypotheses about the mechanisms of disease transmission for most systems, and as a consequence, are not able to implement targeted intervention and control measures.
One would think it would be easier to study and understand pathogen spread in livestock systems than in wildlife. Livestock farmers should know the numbers, movements, locations, birth rates, mixing patterns, etc., of each of their animals. However, there are different challenges in applying network modelling to livestock systems from those faced by wildlife managers. For livestock and managed fish populations, disease outbreaks can be observed, but detailed data on contacts are often missing. Some differences might have to do with the end result, as producers may not be interested in understanding basic ‘disease dynamics’ within a farm because depopulation and vaccination are often solutions that can locally eliminate a pathogen. On a regional level, challenges can revolve around data sharing and privacy issues. For example, in the USA, the basic fundamentals about the structure of regional farm and livestock movement networks are not known, including missing data about farm size, location and animal movements [86]; this is also true for fish industries [87].
(ii). Lack of information on infection patterns
The collection of contact data is getting easier. New remote biomonitoring technologies, which include radiotelemetry, RFID, global positioning system tracking, tri-axial accelerometry and video tracking, are improving our ability to collect extensive contact data on study populations [6,88,89]. However, in the absence of an observable outbreak as discussed above, it remains a problem to match this contact data with relevant and appropriate parasites. For example, for wildlife species that are abundant, relatively easy to catch and handle, and where detailed data on contacts can be obtained using technology [90,91], often the circulating pathogens do not cause morbidity or mortality to the host. Because these pathogens do not necessarily cause disease or death, there might be a perceived need to simulate highly lethal pathogens on the contact network. If this is done, the choice of a pathogen to simulate should be made with caution, as discussed below.
For observational studies of wildlife populations with already-existing detailed contact data (e.g. [92,93]), there is a great opportunity to use network modelling owing to the detailed understanding of animal behaviour and the high resolution of observational data. However, behavioural researchers often lack data on pathogens with transmission modes and life histories that are relevant to the available contact data. There are at least two main reasons for this problem. First, detailed behavioural data are often collected on a single species, often in small populations of conservation concern (but see [94,95]). This is a problem because pathogens often infect multiple hosts, and researchers often lack information on contact patterns between various host species [96].
Second, researchers often lack data on host infection status in wildlife populations. This situation is especially common when infected individuals cannot be identified without capturing the hosts, which can be logistically challenging, unethical or even impossible. Thus, studies that use behavioural data to construct a contact network often do not have infection data; although this can be overcome with simulation of pathogen spread through network modelling. However, we must be careful to simulate pathogen spread on appropriately matched contact networks. For example, we should simulate infectious diseases with short infectious periods (e.g. weeks) on networks where the contacts used to create the network were aggregated over weeks (versus years). Long-term aggregation of the contacts would likely create a network that is substantially more connected than the network that the pathogen actually experiences [97]. Caution should be used whenever social networks are used to infer disease transmission, as the method of data collection also affects the construction of the social network [90]. If infectious diseases are going to be simulated on social networks, edge construction needs to incorporate parasite life cycles and reflect the type of exposure needed for pathogen transmission [98].
Although the health status of livestock is more easily collected compared to wildlife, infection status of individuals or of herds is not typically shared on a regional level owing to privacy issues, even if it is known. Unless animal movements and animal testing are mandated and regulated, regional studies of disease spread in agricultural settings are challenging. In general, it might be easier to overcome the lack of either contact or pathogen data in agricultural systems than in wildlife systems.
In summary, there is the potential to have a mismatch between a contact network and a pathogen for both wildlife and livestock; missing data are often the root cause of the mismatch. Often, we have either observed an outbreak, but do not know the contact structure, or know the contact structure but lack an appropriate pathogen. In order to combine animal contact data with network modelling, and to avoid a contact network–pathogen mismatch, a simple thought process could be implemented (box 1).
Box 1. Implementation: how to combine animal contact data with network modelling.
Whether the contact data come from new technology or from observations, the following steps will be useful in combining relevant contact data with a pathogen:
(i) Define pathogen of interest.
(ii) Identify the life cycle of the pathogen, including host range (e.g. are there multiple hosts or vectors or environmental stages?)
(iii) Identify type of contact needed for pathogen transmission. Evaluate whether this type of transmission can be captured by measurements of social contact.
(iv) Identify the infectious period for the pathogen.
(v) Determine the definition of a node based on the minimum level at which it is important and feasible to collect data on heterogeneous contacts (e.g. will the nodes be individuals, social units, rooms in farms, farm premises or habitat patches?)
(vi) Collect the number of contacts between nodes on a time scale relevant to (likely equivalent to or less than) the infectious period of the pathogen. These will be the edges.
(vii) If outbreak data exist, estimate the transmission rate of the pathogen. The network model can then be used for hypothesis testing or ‘what if’ scenarios.
(viii) If no outbreak data exist, use epidemiological parameters obtained from the literature to simulate outbreaks from a range of parameters and test hypotheses.
(ix) Test control strategies on the network.
(b). Questions to consider in the design of network models
Numerous challenges exist when attempting to use data on host contacts to construct infectious disease models, or when trying to infer contact structure from outbreak data. Below are a few questions to consider in the design of network modelling studies, some of which are unresolved.
(i). How to define a ‘contact’?
Defining a contact is challenging (box 1, step (iii), [99]). We often do not know how a pathogen is transmitted between hosts and therefore cannot define a contact sufficient for disease transmission [51,100]. For directly transmitted pathogens, ideally a contact would be defined as a susceptible and infectious host being within a specified distance for a specified length of time; however, the distance and time period are normally unknown for the host species and pathogen strain of interest. The definition of a contact is even more challenging for indirectly transmitted pathogens owing to environmental persistence (e.g. macroparasites spread by faecal–oral transmission, anthrax spread by ingestion of spores, fungi infecting bees or bats) or the importance of vectors (e.g. ticks and mosquitoes). Because of these challenges and with the exception of a few studies on indirectly transmitted pathogens, network modelling has mostly been used to model directly transmitted diseases [101].
(ii). How does infection with a pathogen change the contact structure of a population?
Individual behaviour, and hence the contact network, can change once an individual is infected [102]; it is rare that the change in behaviour is quantified. Healthy animals could avoid or potentially be attracted to sick animals, and sick animals likely change their interactions with others. As an example of avoidance, Schaller et al. [103] discuss (human) avoidance behaviour, where avoidance of potentially infectious social interactions might lead to a reduced risk of infection at the individual and population levels. Alternatively, healthy animals could be ‘attracted to’ sick animals; lions generally separate themselves from their pride mates when they are sick, but, in the case of canine distemper virus infection, lions that had convulsions in the presence of their companions were sometimes attacked (Craig Packer 2014, personal communication). As another example of behaviour change, animals infected with rabies can either experience ‘furious’ rabies and likely have more contacts, while others exhibit ‘dumb’ rabies and have fewer contacts [77]. Similarly, toxoplasmosis can cause behavioural changes in the intermediate host (e.g. rat) to enhance predation by the definitive host (e.g. cat) to complete the parasite's life cycle [104,105]. In an experimental setting, the grooming behaviour of ants changes upon fungal exposure; exposed ants increase individual self-grooming rates and reduce allogrooming of conspecifics [106], with consequent changes on the structure of the ant contact networks.
Ideally one would have empirical data describing how a network changes once infection occurs and spreads (e.g. [107]), although simulating a change in behaviour can be a useful tool to work around the lack of data on behavioural changes caused by infection. Data collection for step (vi) of box 1 could occur in a population preferably before, during, and after an outbreak, so any changes in behaviour could be documented on a population level. If empirical data are available on behavioural changes, dynamic networks are tools to incorporate temporal changes in contact network structure.
(iii). What is the minimum level of detail needed to capture the contact structure?
While it is unclear at what scale interactions should be studied [108], the level of resolution will likely depend on the host, pathogen and system of interest, with consideration of what is computationally feasible [22,99]. For example, to model transmission of foot-and-mouth disease (short infectious period) or bovine tuberculosis (long infectious period) in cattle herds, do we need to include contact heterogeneity between individuals within a farm, or just movements between farms, sub-regions or regions? While the framework for modelling heterogeneity both within and between groups is available [32], it is unclear at which level capturing within-group heterogeneity is necessary. The scale likely depends on an interaction between host contacts and infectious period [97], and the relative importance of direct versus indirect transmission [109]. In a study on US cattle movements, heterogeneities in cattle shipments only emerged at the county level, not at the state level; thus, analysis of county-level networks was sufficient to understand movements in this system [110].
(iv). How to scale up the observed network to a biologically relevant size?
New technologies, such as proximity contact loggers, have the potential to capture the contacts of an entire population, but they are expensive. Behavioural observations are also expensive in terms of person-hours; even then, not all animals are observed simultaneously. Therefore, studies of animal contacts typically focus on a subset of a larger population. Because we are interested in disease dynamics in a biologically meaningful geographical area (such as a protected area or a region of high livestock production), we need additional tools to enable us to ‘scale up’ to populations of relevant sizes. Methods for scaling up empirical networks are being developed, but on a case-by-case basis [68,77,106,111].
(v). How to capture contacts on multiple host species?
Pathogens that infect multiple hosts can be challenging to model for both well mixed or network models, as normally we do not have within- and between-species contact data for multiple hosts. Making behavioural observations for individually identified multiple host species is challenging. Novel technology, such as automated proximity loggers or even camera traps, seems to be a promising route to better document contacts [45,112]. However, automated proximity loggers and camera traps are not feasible when we lack information on which hosts are involved and where interspecific contacts might take place, therefore informing where to place the loggers and traps. Likely owing to the inability to understand the contact structure of multiple populations simultaneously, studies of the dynamics of zoonoses [113] or multihost pathogens at the livestock–wildlife interface are rare [114].
5. Opportunities for understanding disease transmission using contact networks
(a). Experiments and manipulations
A promising area for further research includes increased attention to experiments and manipulations. Both hosts and pathogens can be experimentally manipulated through removals or additions, and consequent changes on the contact network can be documented [107]. Abundant and small wild animals are useful study systems for manipulations of free-ranging animals in natural systems. Experimental manipulations can be done on these common species to see how varying the host–pathogen environment influences different network measures and pathogen spread [107,115,116]. In addition, studies of common pathogens in common species are highly useful for two reasons. For applied research questions, pathogens found in abundant wildlife species are often important for their role in ‘spilling over’ into humans, agricultural animals or wildlife of conservation concern [117]. Second, for basic research questions, network studies on common wild animal species are extremely useful and important for testing mechanistic principles of transmission on networks.
Livestock systems are a great system to test the theory of infectious disease spread [118,119], because producers actively manage host demographics and contact rates, and can be willing to test new methods for disease control, including targeted control measures. In addition, pathogen surveillance and detection in managed populations are more feasible since livestock are often more easily handled than wildlife.
(b). Pathogen genetic markers
In order to overcome some of the challenges in measuring contacts between members of the host population, parasite genetic markers, microbial genetics, whole-genome sequencing, pathogen phylogenetics and phylodynamics are increasingly used to infer pathogen transmission networks [120,121]. Instead of focusing on the host, these methods focus on the pathogen to infer transmission networks. Ideally, genetic studies should be conducted in parallel with traditional detailed contact studies in order to define which interactions are important for transmission [99].
It is important to find the correct pathogen to use as a genetic marker. Pathogens that are spread via direct contact with conspecifics and that experience rapid mutation rates relative to the host genome are useful for evaluating transmission of directly transmitted pathogens in populations [121]. RNA viruses are particularly well suited as markers of host contact, because their fast mutation rate and short generation time result in unique genetic signatures that can be compared and related across individuals [122–128]. However, isolating virus typically requires invasive sampling to collect blood, tissue or saliva.
Non-invasive sampling (e.g. collection of faeces, hair) is a preferred method over invasive sampling; non-invasive sampling is especially appealing for collecting pathogens from wild animals. Bacteria can be collected from faeces and can be used as indicator organisms to infer transmission or contact networks. Two bacteria found in faeces, Escherichia coli and Salmonella enterica, have been used to deduce if contact networks (based on association networks) correspond to the transmission networks of E. coli and Salmonella (as inferred by similarity in genetic subtypes). Bacterial transmission networks have been correlated with social association patterns in wild lizards and giraffe populations [129,130], but not in elephants [131], potentially owing to extensive space use of elephants. Pathogen transmission networks can also be used to shed light on contact patterns between multiple host species. For example, E. coli infects a wide range of hosts and has been used to infer superspreading species and deduce multihost association patterns and habitat overlap between humans, livestock and wild animals [132,133].
Another non-invasive proxy of transmission that could be used to look at social contacts is the similarity in the gut microbial community. 16S rRNA marker-based studies provide a new opportunity to obtain and analyse high-depth representations of microbial communities at a low cost. Profiling of an entire microbial population has been used extensively over the past few years in the study of human conditions, revealing links between the microbiome, nutrition and diseases [134,135]. It has also been used in livestock to study the effects of management changes on the gastrointestinal microbiome [136–138]. The power of this approach over the use of indicator organisms such as E. coli is the high level of discriminatory power, since it relies on entire microbial populations instead of the genetic background of a single organism. Social relationships likely influence the composition of the gut microbiome [93,139–141], and similarity in the gut microbiome could be used to infer social contacts to simulate the spread of pathogens on network models, although shared habitat and behaviours must be controlled for. It should be noted that host-associated microbial communities are often linked with health benefits [142], rather than health costs. So instead of only using microbial communities as proxies to understand disease dynamics, contact networks could be used to model epidemics of beneficial organisms (i.e. the spread of ‘health’) on social networks. This avenue of future research could shed light on the intersection between sociality and health, both in terms of health costs and benefits.
(c). Computational tools and methods
Contact network studies began with what were fairly simple descriptive tools (e.g. SNA) and have now advanced to more sophisticated modelling techniques. New computational tools and methods for understanding disease transmission continue to evolve. These include Bayesian inference for partial contact tracing [143], pathogen whole-genome sequencing [144], and new statistical frameworks to bridge epidemiological models and coalescent-based inference methods [145]. There is a push for further development of robust analytical methods for network epidemic models [146], and for methods to make efficient phylogenetic inferences on the large amounts of sequence data currently being produced [147].
Because of the improvement in technology to collect detailed temporal data on contacts, empirical data to parametrize contact networks now exist. However, large datasets can create bioinformatic challenges. While new technologies, such as proximity loggers or RFID tags, improve our ability to collect very detailed data on contact structures in host populations, analysing these data presents a computational challenge, especially in a dynamic network framework where the network structure is changing. Currently, the methods for modelling dynamic networks are being developed [8,148,149] and will need to continue to develop to keep up with the growing size and temporal resolution of the contact data.
6. Conclusion
The incorporation of contact networks into the study of infectious diseases has advanced our understanding of pathogen transmission and dynamics, with applications for wild animals and livestock. New network modelling techniques build on the foundations of SNA and traditional SIR modelling, often blending the two methods. Network modelling approaches are well suited to capture heterogeneous contact patterns within and between animal groups, to simulate disease spread and to test hypotheses across a wide range of wild and domestic animal social systems. Network models can use detailed data on behavioural contacts, collected from either observational behavioural studies or from new technology. It is imperative, however, that the type of contact matches the transmission route of the pathogen of interest.
In addition to furthering our understanding of basic research on pathogen dynamics, contact networks can produce useful applied outcomes for animal populations. Network methods are ideally suited to help design targeted surveillance and control programmes; targeted measures can be more efficient and effective than random surveillance and control. Targeted control measures for individuals, or groups of individuals, can include proactive or reactive vaccination, culling or depopulating and/or quarantine of selected individuals. Targeted surveillance and control can also focus on distinct time periods, as elucidated by changes in contact patterns between different periods of time. Because of these varied benefits—and despite inconsistencies in ‘network’ terminology—the use of SNA and network modelling is increasing.
However, some critical gaps remain in our knowledge of contact networks. The field is wrestling with how best to define a contact, capture contacts between multiple host species and scale up observed networks to biologically relevant sizes. In addition, we do not know how infection with a pathogen changes individual behaviour (and consequently the contact structure at the population level) or the minimum level of detail needed to accurately capture important features of contact structure.
Some of these challenges can be solved using new approaches. Great potential exists for increased use of experiments in either common wild animal populations or livestock systems. There is excitement about using new pathogen genetic markers from viruses, bacteria and the gut microbial community to infer transmission networks. The transmission networks could be used to infer contact networks, which could be used to simulate pathogen spread with similar modes of transmission. Finally, new computational tools are being developed to keep up with the influx of large contact datasets, and new modelling methods are being designed to incorporate the importance of including temporal changes on the contact network into dynamic network models. Many of these novel methods are being developed on an individualized case-by-case basis; hence no off-the-shelf and user-friendly software currently exists for these needs.
While the progression towards using new genetic markers and developing computational techniques for contact networks can provide powerful methods for understanding disease dynamics in animal populations, the increasing complexity of methods could present an obstacle in terms of accessibility. Behavioural ecologists, producers or veterinarians would likely find some of the cutting-edge contact network modelling methods too mathematical and theoretical. However, access to many of these new methods is possible through collaborations with physicists, bioinformaticians or molecular analysts who are developing and using the new methods. Collaboration between disease modellers and scientists who know the data and the field system well can shed light on animal epidemiology [150,151] and can make headway on discerning both theoretical and applied questions. Applied questions could become more relevant if network models were constructed with an appropriate policy analysis as the output (e.g. evaluate vaccination versus do nothing, and the cost/benefit of each approach), as is being done in the field of public health. In addition, collaboration will likely expand the utility of contact network models in shedding light on the linkages between sociality (e.g. contact networks) and health outcomes (e.g. risk of infectious pathogen exposure or acquisition of beneficial bacteria). Contact network models could be used to compare the effects of increased sociality on health at a population level, and the role of social individuals on an individual level, including the role of social factors in infectious disease spread.
Acknowledgements
Thanks to P. Kappeler, C. Nunn, E. Enns, A. Kinsley, K. VanderWaal, L. White, two anonymous reviewers and University of Minnesota's Veterinary Medical Library staff for invaluable input and assistance.
Funding statement
National Science Foundation (DEB-1413925), the University of Minnesota's Institute on the Environment, Agricultural Experiment Station General Agricultural Research Funds, and College of Veterinary Medicine (Animal Health Formula Funds and Population Systems Signature Program) provided funding. This material is based upon work supported by the Cooperative State Research Service, US Department of Agriculture, under Project nos. MINV 62-044 and 62–051. Any opinions, findings, conclusions or recommendations expressed in this publication are those of the author and do not necessarily reflect the view of the US Department of Agriculture.
Conflict of interests
I have no competing interests.
References
- 1.Fauci AS. 2001. Infectious diseases: considerations for the 21st century. Clin. Infect. Dis. 32, 675–685. ( 10.1086/319235) [DOI] [PubMed] [Google Scholar]
- 2.Jones KE, Patel NG, Levy MA, Storeygard A, Balk D, Gittleman JL, Daszak P. 2008. Global trends in emerging infectious diseases. Nature 451, 990–993. ( 10.1038/nature06536) [DOI] [PMC free article] [PubMed] [Google Scholar]
- 3.Gilchrist MJ, Greko C, Wallinga DB, Beran GW, Riley DG, Thorne PS. 2007. The potential role of concentrated animal feeding operations in infectious disease epidemics and antibiotic resistance. Environ. Health Perspect. 115, 313–316. ( 10.1289/ehp.8837) [DOI] [PMC free article] [PubMed] [Google Scholar]
- 4.Smith K, Acevedo-Whitehouse K, Pedersen A. 2009. The role of infectious diseases in biological conservation. Anim. Conserv. 12, 1–12. ( 10.1111/j.1469-1795.2008.00228.x) [DOI] [Google Scholar]
- 5.Craft ME, Volz E, Packer C, Meyers LA. 2011. Disease transmission in territorial populations: the small-world network of Serengeti lions. J. R. Soc. Interface 8, 776–786. ( 10.1098/rsif.2010.0511) [DOI] [PMC free article] [PubMed] [Google Scholar]
- 6.Craft ME, Caillaud D. 2011. Network models: an underutilized tool in wildlife epidemiology? Interdisc. Perspect. Infect. Dis. 2011, 1–12. ( 10.1155/2011/676949) [DOI] [PMC free article] [PubMed] [Google Scholar]
- 7.Meyers LA, Newman MEJ, Pourbohloul B. 2006. Predicting epidemics on directed contact networks. J. Theoret. Biol. 240, 400–418. ( 10.1016/j.jtbi.2005.10.004) [DOI] [PubMed] [Google Scholar]
- 8.Bansal S, Read J, Pourbohloul B, Meyers LA. 2010. The dynamic nature of contact networks in infectious disease epidemiology. J. Biol. Dyn. 4, 478–489. ( 10.1080/17513758.2010.503376) [DOI] [PubMed] [Google Scholar]
- 9.Wey T, Blumstein DT, Shen W, Jordan F. 2008. Social network analysis of animal behaviour: a promising tool for the study of sociality. Anim. Behav. 75, 333–344. ( 10.1016/j.anbehav.2007.06.020) [DOI] [Google Scholar]
- 10.Krause J, Croft D, James R. 2007. Social network theory in the behavioural sciences: potential applications. Behav. Ecol. Sociobiol. 62, 15–27. ( 10.1007/s00265-007-0445-8) [DOI] [PMC free article] [PubMed] [Google Scholar]
- 11.Anderson RM, May RM. 1979. Population biology of infectious diseases: part 1. Nature 280, 361–367. ( 10.1038/280361a0) [DOI] [PubMed] [Google Scholar]
- 12.Loehle C. 1995. Social barriers to pathogen transmission in wild animal populations. Ecology 76, 326–335. ( 10.2307/1941192) [DOI] [Google Scholar]
- 13.Freeland W. 1976. Pathogens and the evolution of primate sociality. Biotropica 8, 12–24. ( 10.2307/2387816) [DOI] [Google Scholar]
- 14.Kappeler PM, Cremer S, Nunn CL. 2015. Sociality and health: impacts of sociality on disease susceptibility and transmission in animal and human societies. Phil. Trans. R. Soc. B 370, 20140116 ( 10.1098/rstb.2014.0116) [DOI] [PMC free article] [PubMed] [Google Scholar]
- 15.Nunn CL, Jordán F, McCabe CM, Verdolin JL, Fewell JH. 2015. Infectious disease and group size: more than just a numbers game. Phil. Trans. R. Soc. B 370, 20140111 ( 10.1098/rstb.2014.0111) [DOI] [PMC free article] [PubMed] [Google Scholar]
- 16.Lloyd-Smith JO, George D, Pepin KM, Pitzer VE, Pulliam JRC, Dobson AP, Hudson PJ, Grenfell BT. 2009. Epidemic dynamics at the human–animal interface. Science 326, 1362–1367. ( 10.1126/science.1177345) [DOI] [PMC free article] [PubMed] [Google Scholar]
- 17.Lloyd-Smith JO, Schreiber SJ, Kopp PE, Getz WM. 2005. Superspreading and the effect of individual variation on disease emergence. Nature 438, 355–359. ( 10.1038/nature04153) [DOI] [PMC free article] [PubMed] [Google Scholar]
- 18.Meyers LA, Pourbohloul B, Newman MEJ, Skowronski DM, Brunham RC. 2005. Network theory and SARS: predicting outbreak diversity. J. Theor. Biol. 232, 71–81. ( 10.1016/j.jtbi.2004.07.026) [DOI] [PMC free article] [PubMed] [Google Scholar]
- 19.Klovdahl AS. 1985. Social networks and the spread of infectious diseases: the AIDS example. Soc. Sci. Med. 21, 1203–1216. ( 10.1016/0277-9536(85)90269-2) [DOI] [PubMed] [Google Scholar]
- 20.Centers for Disease Control and Prevention. 2003. Severe acute respiratory syndrome—Singapore, 2003. MMWR. Morb. Mortal. Wkly Rep. 52, 405. [PubMed] [Google Scholar]
- 21.Meyers LA. 2007. Contact network epidemiology: bond percolation applied to infectious disease prediction and control. Bull. Am. Math. Soc. 44, 63–86. ( 10.1090/S0273-0979-06-01148-7) [DOI] [Google Scholar]
- 22.Keeling MJ, Rohani P. 2008. Modeling infectious diseases in humans and animals, p. 366 Princeton, NJ: Princeton University Press. [Google Scholar]
- 23.Schley D, Whittle S, Taylor M, Kiss IZ. 2012. Models to capture the potential for disease transmission in domestic sheep flocks. Prev. Vet. Med. 106, 174–184. ( 10.1016/j.prevetmed.2012.01.023) [DOI] [PubMed] [Google Scholar]
- 24.Christley RM, Pinchbeck G, Bowers R, Clancy D, French N, Bennett R, Turner J. 2005. Infection in social networks: using network analysis to identify high-risk individuals. Am. J. Epidemiol. 162, 1024–1031. ( 10.1093/aje/kwi308) [DOI] [PubMed] [Google Scholar]
- 25.Bansal S, Grenfell BT, Meyers LA. 2007. When individual behaviour matters: homogeneous and network models in epidemiology. J. R. Soc. Interface 4, 879–891. ( 10.1098/rsif.2007.1100) [DOI] [PMC free article] [PubMed] [Google Scholar]
- 26.Bansal S, Pourbohloul B, Meyers LA. 2006. A comparative analysis of influenza vaccination programs. PLoS Med. 3, e387 ( 10.1371/journal.pmed.0030387) [DOI] [PMC free article] [PubMed] [Google Scholar]
- 27.Pourbohloul B, Meyers LA, Skowronski DM, Krajden M, Patrick DM, Brunham RC. 2005. Modeling control strategies of respiratory pathogens. Emerg. Infect. Dis. 11, 1249–1256. ( 10.3201/eid1108.040449) [DOI] [PMC free article] [PubMed] [Google Scholar]
- 28.Kao RR, Danon L, Green DM, Kiss IZ. 2006. Demographic structure and pathogen dynamics on the network of livestock movements in Great Britain. Proc. R. Soc. B 273, 1999–2007. ( 10.1098/rspb.2006.3505) [DOI] [PMC free article] [PubMed] [Google Scholar]
- 29.Kao RR, Green DM, Johnson J, Kiss IZ. 2007. Disease dynamics over very different time-scales: foot-and-mouth disease and scrapie on the network of livestock movements in the UK. J. R. Soc. Interface 4, 907–916. ( 10.1098/rsif.2007.1129) [DOI] [PMC free article] [PubMed] [Google Scholar]
- 30.Lembo T, et al. 2015. Infectious diseases in the Serengeti: what we know and how we know it. In Serengeti IV: sustaining biodiversity in a coupled human–natural system (eds Sinclair ARE, Metzger K, Mduma S, Fryxell J.), Ch. 19, pp. 533–581. Chicago, IL: Chicago University Press. [Google Scholar]
- 31.Griffin R, Nunn C. 2012. Community structure and the spread of infectious disease in primate social networks. Evol. Ecol. 26, 779–800. ( 10.1007/s10682-011-9526-2) [DOI] [Google Scholar]
- 32.Caillaud D, Craft ME, Meyers LA. 2013. Epidemiological effects of group size variation in social species. J. R. Soc. Interface 10, 20130206 ( 10.1098/rsif.2013.0206) [DOI] [PMC free article] [PubMed] [Google Scholar]
- 33.Keeling MJ, Eames KTD. 2005. Networks and epidemic models. J. R. Soc. Interface 2, 295–307. ( 10.1098/rsif.2005.0051) [DOI] [PMC free article] [PubMed] [Google Scholar]
- 34.Schradin C, Lindholm AK, Johannesen J, Schoepf I, Yuen C-H, Koenig B, Pillay N. 2012. Social flexibility and social evolution in mammals: a case study of the African striped mouse (Rhabdomys pumilio). Mol. Ecol. 21, 541–553. ( 10.1111/j.1365-294X.2011.05256.x) [DOI] [PubMed] [Google Scholar]
- 35.Macdonald DW. 1979. The flexible social system of the golden jackal, Canis aureus. Behav. Ecol. Sociobiol. 5, 17–38. ( 10.1007/bf00302692) [DOI] [Google Scholar]
- 36.Murray AG. 2013. Epidemiology of the spread of viral diseases under aquaculture. Curr. Opin. Virol. 3, 74–78. ( 10.1016/j.coviro.2012.11.002) [DOI] [PubMed] [Google Scholar]
- 37.Werkman M, Green DM, Munro LA, Murray AG, Turnbull JF. 2011. Seasonality and heterogeneity of live fish movements in Scottish fish farms. Dis. Aqu. Organ. 96, 69–82. ( 10.3354/dao02382) [DOI] [PubMed] [Google Scholar]
- 38.Reynolds JJH, Torremorell M, Craft ME. 2014. Mathematical modeling of influenza A virus dynamics within swine farms and the effects of vaccination. PLoS ONE 9, e106177 ( 10.1371/journal.pone.0106177) [DOI] [PMC free article] [PubMed] [Google Scholar]
- 39.Schein MW, Fohrman MH. 1955. Social dominance relationships in a herd of dairy cattle. Br. J. Anim. Behav. 3, 45–55. ( 10.1016/S0950-5601(55)80012-3) [DOI] [Google Scholar]
- 40.Beilharz R, Cox D. 1967. Social dominance in swine. Anim. Behav. 15, 117–122. ( 10.1016/S0003-3472(67)80021-6) [DOI] [PubMed] [Google Scholar]
- 41.Hovingh E, Whitlock R, Sweeney R, Fyock T, Wolfgang D, Smith J, Schukken Y, Van Kessel JA. 2006. Identification and implications of MAP supershedders. J. Anim. Sci. 84, 134. [Google Scholar]
- 42.Lass S, Hudson PJ, Thakar J, Saric J, Harvill E, Albert R, Perkins SE. 2013. Generating super-shedders: co-infection increases bacterial load and egg production of a gastrointestinal helminth. J. R. Soc. Interface 10, 20120588 ( 10.1098/rsif.2012.0588) [DOI] [PMC free article] [PubMed] [Google Scholar]
- 43.Heinsohn R, Packer C, Pusey AE. 1996. Development of cooperative territoriality in juvenile lions. Proc. R. Soc. Lond. B 263, 475–479. ( 10.1098/rspb.1996.0071) [DOI] [PubMed] [Google Scholar]
- 44.Sih A, Bell A, Johnson JC. 2004. Behavioral syndromes: an ecological and evolutionary overview. Trends Ecol. Evol. 19, 372–378. ( 10.1016/j.tree.2004.04.009) [DOI] [PubMed] [Google Scholar]
- 45.Bohm M, Hutchings MR, White PCL. 2009. Contact networks in a wildlife–livestock host community: identifying high-risk individuals in the transmission of bovine TB among badgers and cattle. PLoS ONE 4, e5016 ( 10.1371/journal.pone.0005016) [DOI] [PMC free article] [PubMed] [Google Scholar]
- 46.Graham AL, Cattadori IM, Lloyd-Smith JO, Ferrari MJ, Bjornstad ON. 2007. Transmission consequences of coinfection: cytokines writ large? Trends Parasitol. 23, 284–291. ( 10.1016/j.pt.2007.04.005) [DOI] [PubMed] [Google Scholar]
- 47.Danon L, Ford AP, House T, Jewell CP, Keeling MJ, Roberts GO, Ross JV, Vernon MC. 2011. Networks and the epidemiology of infectious disease. Interdisc. Perspect. Infect. Dis. 2011, 284909 ( 10.1155/2011/284909) [DOI] [PMC free article] [PubMed] [Google Scholar]
- 48.Croft DP, James R, Krause J. 2008. Exploring animal social networks. Princeton, NJ: Princeton University Press. [Google Scholar]
- 49.VanderWaal K, Atwill E, Hooper S, Buckle K, McCowan B. 2013. Network structure and prevalence of Cryptosporidium in Belding's ground squirrels. Behav. Ecol. Sociobiol. 67, 1951–1959. ( 10.1007/s00265-013-1602-x) [DOI] [Google Scholar]
- 50.MacIntosh AJ, Jacobs A, Garcia C, Shimizu K, Mouri K, Huffman MA, Hernandez AD. 2012. Monkeys in the middle: parasite transmission through the social network of a wild primate. PLoS ONE 7, e51144 ( 10.1371/journal.pone.0051144) [DOI] [PMC free article] [PubMed] [Google Scholar]
- 51.Rushmore J, Caillaud D, Matamba L, Stumpf RM, Borgatti SP, Altizer S. 2013. Social network analysis of wild chimpanzees provides insights for predicting infectious disease risk. J. Anim. Ecol. 82, 976–986. ( 10.1111/1365-2656.12088) [DOI] [PubMed] [Google Scholar]
- 52.Porphyre T, Stevenson M, Jackson R, McKenzie J. 2008. Influence of contact heterogeneity on TB reproduction ratio R0 in a free-living brushtail possum Trichosurus vulpecula population. Vet. Res. 39, 13 ( 10.1051/vetres:2008007) [DOI] [PubMed] [Google Scholar]
- 53.Godfrey S, Bull C, James R, Murray K. 2009. Network structure and parasite transmission in a group living lizard, the gidgee skink, Egernia stokesii. Behav. Ecol. Sociobiol. 63, 1045–1056. ( 10.1007/s00265-009-0730-9) [DOI] [Google Scholar]
- 54.Martínez-López B, Perez AM, Sánchez-Vizcaíno JM. 2009. Social network analysis. Review of general concepts and use in preventive veterinary medicine. Transboundary Emerg. Dis. 56, 109–120. ( 10.1111/j.1865-1682.2009.01073.x) [DOI] [PubMed] [Google Scholar]
- 55.Smith R, Cook A, Christley R. 2013. Descriptive and social network analysis of pig transport data recorded by quality assured pig farms in the UK. Prev. Vet. Med. 108, 167–177. ( 10.1016/j.prevetmed.2012.08.011) [DOI] [PubMed] [Google Scholar]
- 56.Fiebig L, Smieszek T, Saurina J, Hattendorf J, Zinsstag J. 2009. Contacts between poultry farms, their spatial dimension and their relevance for avian influenza preparedness. Geospatial Health 4, 79–95. ( 10.4081/gh.2009.212) [DOI] [PubMed] [Google Scholar]
- 57.Dusan F, Toribio JA, East I. 2010. Assessment of the risks of communicable disease transmission through the movement of poultry exhibited at agricultural shows in New South Wales. Aust. Vet. J. 88, 333–341. ( 10.1111/j.1751-0813.2010.00613.x) [DOI] [PubMed] [Google Scholar]
- 58.Grear DA, Kaneene JB, Averill JJ, Webb CT. 2014. Local cattle movements in response to ongoing bovine tuberculosis zonation and regulations in Michigan, USA. Prev. Vet. Med. 114, 201–212. ( 10.1016/j.prevetmed.2014.03.008) [DOI] [PubMed] [Google Scholar]
- 59.Bigras-Poulin M, Thompson R, Chriél M, Mortensen S, Greiner M. 2006. Network analysis of Danish cattle industry trade patterns as an evaluation of risk potential for disease spread. Prev. Vet. Med. 76, 11–39. ( 10.1016/j.prevetmed.2006.04.004) [DOI] [PubMed] [Google Scholar]
- 60.Calistri P, Conte A, Natale F, Possenti L, Savini L, Danzetta ML, Iannetti S, Giovannini A. 2013. Systems for prevention and control of epidemic emergencies. Veterinaria Italiana 49, 255–261. [DOI] [PubMed] [Google Scholar]
- 61.Dubé C, Ribble C, Kelton D, McNab B. 2011. Introduction to network analysis and its implications for animal disease modelling. Revue Scientifique et Technique (International Office of Epizootics) 30, 425–436. [DOI] [PubMed] [Google Scholar]
- 62.Volkova VV, Howey R, Savill NJ, Woolhouse ME. 2010. Sheep movement networks and the transmission of infectious diseases. PLoS ONE 5, e11185 ( 10.1371/journal.pone.0011185) [DOI] [PMC free article] [PubMed] [Google Scholar]
- 63.Nickbakhsh S, Matthews L, Dent JE, Innocent GT, Arnold ME, Reid SWJ, Kao RR. 2013. Implications of within-farm transmission for network dynamics: consequences for the spread of avian influenza. Epidemics 5, 67–76. ( 10.1016/j.epidem.2013.03.001) [DOI] [PMC free article] [PubMed] [Google Scholar]
- 64.Ribeiro-Lima J, Enns EA, Thompson B, Craft ME, Wells SJ. 2014. From network analysis to risk analysis–an approach to risk-based surveillance for bovine tuberculosis in Minnesota, US. Prev. Vet. Med. ( 10.1016/j.prevetmed.2014.12.007) [DOI] [PubMed] [Google Scholar]
- 65.Green DM, Victor J, Birch CP, Johnson J, Kiss IZ, McCarthy ND, Kao RR. 2007. Demographic risk factors for classical and atypical scrapie in Great Britain. J. Gen. Virol. 88, 3486–3492. ( 10.1099/vir.0.83225-0) [DOI] [PMC free article] [PubMed] [Google Scholar]
- 66.Adams T, Black K, MacIntyre C, MacIntyre I, Dean R. 2012. Connectivity modelling and network analysis of sea lice infection in Loch Fyne, west coast of Scotland. Aquacult. Environ. Interact. 3, 51–63. ( 10.3354/aei00052) [DOI] [Google Scholar]
- 67.Stene A, Viljugrein H, Yndestad H, Tavornpanich S, Skjerve E. 2014. Transmission dynamics of pancreas disease (PD) in a Norwegian fjord: aspects of water transport, contact networks and infection pressure among salmon farms. J. Fish Dis. 37, 123–134. ( 10.1111/jfd.12090) [DOI] [PubMed] [Google Scholar]
- 68.Hamede RK, Bashford J, McCallum H, Jones M. 2009. Contact networks in a wild Tasmanian devil (Sarcophilus harrisii) population: using social network analysis to reveal seasonal variability in social behaviour and its implications for transmission of devil facial tumour disease. Ecol. Lett. 12, 1147–1157. ( 10.1111/j.1461-0248.2009.01370.x) [DOI] [PubMed] [Google Scholar]
- 69.Cross PC, Lloyd-Smith JO, Bowers JA, Hay CT, Hofmeyr M, Getz WM. 2004. Integrating association data and disease dynamics in a social ungulate: bovine tuberculosis in African buffalo in the Kruger National Park. Annales Zoologici Fennici 41, 879–892. [Google Scholar]
- 70.Kiss IZ, Green DM, Kao RR. 2006. The network of sheep movements within Great Britain: network properties and their implications for infectious disease spread. J. R. Soc. Interface 3, 669–677. ( 10.1098/rsif.2006.0129) [DOI] [PMC free article] [PubMed] [Google Scholar]
- 71.Magalhaes RJS, Zhou X, Jia B, Guo F, Pfeiffer DU, Martin V. 2012. Live poultry trade in southern China provinces and HPAIV H5N1 infection in humans and poultry: the role of Chinese New Year festivities. PLoS ONE 7, e49712 ( 10.1371/journal.pone.0049712) [DOI] [PMC free article] [PubMed] [Google Scholar]
- 72.Lindström T, Sisson SA, Nöremark M, Jonsson A, Wennergren U. 2009. Estimation of distance related probability of animal movements between holdings and implications for disease spread modeling. Prev. Vet. Med. 91, 85–94. ( 10.1016/j.prevetmed.2009.05.022) [DOI] [PubMed] [Google Scholar]
- 73.Barthélemy M, Barrat A, Pastor-Satorras R, Vespignani A. 2005. Dynamical patterns of epidemic outbreaks in complex heterogeneous networks. J. Theor. Biol. 235, 275–288. ( 10.1016/j.jtbi.2005.01.011) [DOI] [PubMed] [Google Scholar]
- 74.Murray A. 2008. Existing and potential use of models in the control and prevention of disease emergencies affecting aquatic animals. Revue Scientifique et Technique (International Office of Epizootics) 27, 211–228. [PubMed] [Google Scholar]
- 75.Thrush M, Peeler E. 2006. Stochastic simulation of live salmonid movement in England and Wales to predict potential spread of exotic pathogens. Dis. Aquat. Organ. 72, 115–123. ( 10.3354/dao072115) [DOI] [PubMed] [Google Scholar]
- 76.Rushmore J, Caillaud D, Hall RJ, Stumpf RM, Meyers LA, Altizer S. 2014. Network-based vaccination improves prospects for disease control in wild chimpanzees. J. R. Soc. Interface 11, 20140349 ( 10.1098/rsif.2014.0349) [DOI] [PMC free article] [PubMed] [Google Scholar]
- 77.Reynolds J, Hirsch B, Gehrt S, Craft M. In revision Modeling rabies spread on raccoon social networks leads to new insights into the epidemiology and control of wildlife diseases. J. Anim. Ecol. [Google Scholar]
- 78.Drewe JA, Eames KTD, Madden JR, Pearce GP. 2011. Integrating contact network structure into tuberculosis epidemiology in meerkats in South Africa: implications for control. Prev. Vet. Med. 101, 113–120. ( 10.1016/j.prevetmed.2011.05.006) [DOI] [PubMed] [Google Scholar]
- 79.Hamede R, Bashford J, Jones M, McCallum H. 2012. Simulating devil facial tumour disease outbreaks across empirically derived contact networks. J. Appl. Ecol. 49, 447–456. ( 10.1111/j.1365-2664.2011.02103.x) [DOI] [Google Scholar]
- 80.Green DM, Kiss IZ, Kao RR. 2006. Modelling the initial spread of foot-and-mouth disease through animal movements. Proc. R. Soc. B 273, 2729–2735. ( 10.1098/rspb.2006.3648) [DOI] [PMC free article] [PubMed] [Google Scholar]
- 81.Craft ME, Beyer HL, Haydon DT. 2013. Estimating the probability of a major outbreak from the timing of early cases: an indeterminate problem? PLoS ONE 8, e57878 ( 10.1371/journal.pone.0057878) [DOI] [PMC free article] [PubMed] [Google Scholar]
- 82.Roelke-Parker ME, et al. 1996. A canine distemper virus epidemic in Serengeti lions (Panthera leo). Nature 379, 441–445. ( 10.1038/379441a0) [DOI] [PMC free article] [PubMed] [Google Scholar]
- 83.Drewe JA. 2009. Who infects whom? Social networks and tuberculosis transmission in wild meerkats. Proc. R. Soc. B 277, 633–642. ( 10.1098/rspb.2009.1775) [DOI] [PMC free article] [PubMed] [Google Scholar]
- 84.Dhondt AA, Tessaglia DL, Slothower RL. 1998. Epidemic mycoplasmal conjunctivitis in house finches from eastern North America. J. Wildl. Dis. 34, 265–280. ( 10.7589/0090-3558-34.2.265) [DOI] [PubMed] [Google Scholar]
- 85.Lembo T, et al. 2008. Exploring reservoir dynamics: a case study of rabies in the Serengeti ecosystem. J. Appl. Ecol. 45, 1246–1257. ( 10.1111/j.1365-2664.2008.01468.x) [DOI] [PMC free article] [PubMed] [Google Scholar]
- 86.Buhnerkempe MG, et al. 2014. The impact of movements and animal density on continental scale cattle disease outbreaks in the United States. PLoS ONE 9, e91724 ( 10.1371/journal.pone.0091724) [DOI] [PMC free article] [PubMed] [Google Scholar]
- 87.Phelps NB, Craft ME, Travis D, Pelican K, Goyal SM. 2014. Risk-based management of viral hemorrhagic septicemia virus in Minnesota. North Am. J. Fish. Manag. 34, 373–379. ( 10.1080/02755947.2014.880766) [DOI] [Google Scholar]
- 88.Adelman JS, Moyers SC, Hawley DM. 2014. Using remote biomonitoring to understand heterogeneity in immune-responses and disease-dynamics in small, free-living animals. Integr. Comp. Biol. 54, 377–386. ( 10.1093/icb/icu088) [DOI] [PubMed] [Google Scholar]
- 89.Krause J, Krause S, Arlinghaus R, Psorakis I, Roberts S, Rutz C. 2013. Reality mining of animal social systems. Trends Ecol. Evol. 28, 541–551. ( 10.1016/j.tree.2013.06.002) [DOI] [PubMed] [Google Scholar]
- 90.Perkins SE, Cagnacci F, Stradiotto A, Arnoldi D, Hudson PJ. 2009. Comparison of social networks derived from ecological data: implications for inferring infectious disease dynamics. J. Anim. Ecol. 78, 1015–1022. ( 10.1111/j.1365-2656.2009.01557.x) [DOI] [PubMed] [Google Scholar]
- 91.Hirsch BT, Prange S, Hauver SA, Gehrt SD. 2013. Raccoon social networks and the potential for disease transmission. PLoS ONE 8, e75830 ( 10.1371/journal.pone.0075830) [DOI] [PMC free article] [PubMed] [Google Scholar]
- 92.Packer C, Hilborn R, Mosser A, Kissui B, Borner M, Hopcraft G, Wilmshurst J, Mduma S, Sinclair ARE. 2005. Ecological change, group territoriality, and population dynamics in Serengeti lions. Science 307, 390–393. ( 10.1126/science.1105122) [DOI] [PubMed] [Google Scholar]
- 93.Degnan PH, Pusey AE, Lonsdorf EV, Goodall J, Wroblewski EE, Wilson ML, Rudicell RS, Hahn BH, Ochman H. 2012. Factors associated with the diversification of the gut microbial communities within chimpanzees from Gombe National Park. Proc. Natl Acad. Sci. USA 109, 13 034–13 039. ( 10.1073/pnas.1110994109) [DOI] [PMC free article] [PubMed] [Google Scholar]
- 94.Aplin LM, Farine DR, Morand-Ferron J, Cole EF, Cockburn A, Sheldon BC. 2013. Individual personalities predict social behaviour in wild networks of great tits (Parus major). Ecol. Lett. 16, 1365–1372. ( 10.1111/ele.12181) [DOI] [PubMed] [Google Scholar]
- 95.Holekamp KE, Dloniak SM, Regina M. 2010. Intraspecific variation in the behavioral ecology of a tropical carnivore, the spotted hyena. Adv. Stud. Behav. 42, 189–229. ( 10.1016/S0065-3454(10)42006-9) [DOI] [Google Scholar]
- 96.Craft ME, Hawthorne PL, Packer C, Dobson AP. 2008. Dynamics of a multihost pathogen in a carnivore community. J. Anim. Ecol. 77, 1257–1264. ( 10.1111/j.1365-2656.2008.01410.x) [DOI] [PubMed] [Google Scholar]
- 97.Cross PC, Lloyd-Smith JO, Johnson PLF, Getz WM. 2005. Duelling timescales of host movement and disease recovery determine invasion of disease in structured populations. Ecol. Lett. 8, 587–595. ( 10.1111/j.1461-0248.2005.00760.x) [DOI] [Google Scholar]
- 98.Grear DA, Luong LT, Hudson PJ. 2013. Network transmission inference: host behavior and parasite life cycle make social networks meaningful in disease ecology. Ecol. Appl. 23, 1906–1914. ( 10.1890/13-0907.1) [DOI] [PubMed] [Google Scholar]
- 99.Eames K, Bansal S, Frost S, Riley S. 2014. Six challenges in measuring contact networks for use in modelling. Epidemics. ( 10.1016/j.epidem.2014.08.006) [DOI] [PubMed] [Google Scholar]
- 100.VanderWaal KL, Wang H, McCowan B, Fushing H, Isbell LA. 2014. Multilevel social organization and space use in reticulated giraffe (Giraffa camelopardalis). Behav. Ecol. 25, 17–26. ( 10.1093/beheco/art061) [DOI] [Google Scholar]
- 101.Godfrey SS. 2013. Networks and the ecology of parasite transmission: a framework for wildlife parasitology. Int. J. Parasitol. Parasites Wildl. 2, 235–245. ( 10.1016/j.ijppaw.2013.09.001) [DOI] [PMC free article] [PubMed] [Google Scholar]
- 102.Funk S, Bansal S, Bauch CT, Eames KTD, Edmunds WJ, Galvani AP, Klepac P. 2015. Nine challenges in incorporating the dynamics of behaviour in infectious diseases models. Epidemics. ( 10.1016/j.epidem.2014.09.005) [DOI] [PubMed] [Google Scholar]
- 103.Schaller M, Murray DR, Bangerter A. 2015. Implications of the behavioural immune system for social behaviour and human health in the modern world. Phil. Trans. R. Soc. B 370, 20140105 ( 10.1098/rstb.2014.0105) [DOI] [PMC free article] [PubMed] [Google Scholar]
- 104.Berdoy M, Webster JP, Macdonald D. 2000. Fatal attraction in rats infected with Toxoplasma gondii. Proc. R. Soc. Lond. B 267, 1591–1594. ( 10.1098/rspb.2000.1182) [DOI] [PMC free article] [PubMed] [Google Scholar]
- 105.Vyas A, Kim S-K, Giacomini N, Boothroyd JC, Sapolsky RM. 2007. Behavioral changes induced by Toxoplasma infection of rodents are highly specific to aversion of cat odors. Proc. Natl Acad. Sci. USA 104, 6442–6447. ( 10.1073/pnas.0608310104) [DOI] [PMC free article] [PubMed] [Google Scholar]
- 106.Theis FJ, Ugelvig LV, Marr C, Cremer S. 2015. Opposing effects of allogrooming on disease transmission in ant societies. Phil. Trans. R. Soc. B 370, 20140108 ( 10.1098/rstb.2014.0108) [DOI] [PMC free article] [PubMed] [Google Scholar]
- 107.Croft DP, Edenbrow M, Darden SK, Ramnarine IW, van Oosterhout C, Cable J. 2011. Effect of gyrodactylid ectoparasites on host behaviour and social network structure in guppies Poecilia reticulata. Behav. Ecol. Sociobiol. 65, 2219–2227. ( 10.1007/s00265-011-1230-2) [DOI] [Google Scholar]
- 108.MacGregor LH, Cumming GS, Hockey PA. 2011. Understanding pathogen transmission dynamics in waterbird communities: at what scale should interactions be studied? South Afr. J. Sci. 107, 1–10. ( 10.4102/sajs.v107i9/10.283) [DOI] [Google Scholar]
- 109.Turner J, Bowers RG, Clancy D, Behnke MC, Christley RM. 2008. A network model of E. coli O157 transmission within a typical UK dairy herd: the effect of heterogeneity and clustering on the prevalence of infection. J. Theor. Biol. 254, 45–54. ( 10.1016/j.jtbi.2008.05.007) [DOI] [PubMed] [Google Scholar]
- 110.Buhnerkempe MG, Grear DA, Portacci K, Miller RS, Lombard JE, Webb CT. 2013. A national-scale picture of US cattle movements obtained from Interstate Certificate of Veterinary Inspection data. Prev. Vet. Med. 112, 318–329. ( 10.1016/j.prevetmed.2013.08.002) [DOI] [PubMed] [Google Scholar]
- 111.Craft ME, Volz E, Packer C, Meyers LA. 2009. Distinguishing epidemic waves from disease spillover in a wildlife population. Proc. R. Soc. B 276, 1777–1785. ( 10.1098/rspb.2008.1636) [DOI] [PMC free article] [PubMed] [Google Scholar]
- 112.Drewe J, O'Connor H, Weber N, McDonald R, Delahay R. 2013. Patterns of direct and indirect contact between cattle and badgers naturally infected with tuberculosis. Epidemiol. Infect. 141, 1467–1475. ( 10.1017/S0950268813000691) [DOI] [PMC free article] [PubMed] [Google Scholar]
- 113.Roy S, McElwain TF, Wan Y. 2011. A network control theory approach to modeling and optimal control of zoonoses: case study of brucellosis transmission in sub-Saharan Africa. PLoS Negl. Trop. Dis. 5, e1259 ( 10.1371/journal.pntd.0001259) [DOI] [PMC free article] [PubMed] [Google Scholar]
- 114.Miller RS, Farnsworth ML, Malmberg JL. 2013. Diseases at the livestock–wildlife interface: status, challenges, and opportunities in the United States. Prev. Vet. Med. 110, 119–132. ( 10.1016/j.prevetmed.2012.11.021) [DOI] [PMC free article] [PubMed] [Google Scholar]
- 115.Grear DA, Perkins SE, Hudson PJ. 2009. Does elevated testosterone result in increased exposure and transmission of parasites? Ecol. Lett. 12, 528–537. ( 10.1111/j.1461-0248.2009.01306.x) [DOI] [PubMed] [Google Scholar]
- 116.Knowles SCL, Fenton A, Petchey OL, Jones TR, Barber R, Pedersen AB. 2013. Stability of within-host–parasite communities in a wild mammal system. Proc. R. Soc. B 280, 20130598 ( 10.1098/rspb.2013.0598) [DOI] [PMC free article] [PubMed] [Google Scholar]
- 117.Lloyd-Smith JO, Funk S, McLean AR, Riley S, Wood JLN. 2014. Nine challenges in modelling the emergence of novel pathogens. Epidemics. ( 10.1016/j.epidem.2014.09.002) [DOI] [PMC free article] [PubMed] [Google Scholar]
- 118.Atkins KE, Read AF, Walkden-Brown SW, Savill NJ, Woolhouse MEJ. 2013. The effectiveness of mass vaccination on Marek's disease virus (MDV) outbreaks and detection within a broiler barn: a modeling study. Epidemics 5, 208–217. ( 10.1016/j.epidem.2013.10.001) [DOI] [PMC free article] [PubMed] [Google Scholar]
- 119.Brooks-Pollock E, de Jong MCM, Keeling MJ, Klinkenberg D, Wood JLN. 2014. Eight challenges in modelling infectious livestock diseases. Epidemics. ( 10.1016/j.epidem.2014.08.005) [DOI] [PubMed] [Google Scholar]
- 120.Archie EA, Luikart G, Ezenwa VO. 2009. Infecting epidemiology with genetics: a new frontier in disease ecology. Trends Ecol. Evol. 24, 21–30. ( 10.1016/j.tree.2008.08.008) [DOI] [PubMed] [Google Scholar]
- 121.Grenfell BT, Pybus OG, Gog JR, Wood JL, Daly JM, Mumford JA, Holmes EC. 2004. Unifying the epidemiological and evolutionary dynamics of pathogens. Science 303, 327–332. ( 10.1126/science.1090727) [DOI] [PubMed] [Google Scholar]
- 122.Biek R, Drummond AJ, Poss M. 2006. A virus reveals population structure and recent demographic history of its carnivore host. Science 311, 538–541. ( 10.1126/science.1121360) [DOI] [PubMed] [Google Scholar]
- 123.Brunker K, Hampson K, Horton D, Biek R. 2012. Integrating the landscape epidemiology and genetics of RNA viruses: rabies in domestic dogs as a model. Parasitology 139, 1899–1913. ( 10.1017/S003118201200090X) [DOI] [PMC free article] [PubMed] [Google Scholar]
- 124.Lee JS, Ruell EW, Boydston EE, Lyren LM, Alonso RS, Troyer JL, Crooks KR, VandeWoude S. 2012. Gene flow and pathogen transmission among bobcats (Lynx rufus) in a fragmented urban landscape. Mol. Ecol. 21, 1617–1631. ( 10.1111/j.1365-294X.2012.05493.x) [DOI] [PubMed] [Google Scholar]
- 125.Drummond AJ, Pybus OG, Rambaut A, Forsberg R, Rodrigo AG. 2003. Measurably evolving populations. Trends Ecol. Evol. 18, 481–488. ( 10.1016/S0169-5347(03)00216-7) [DOI] [Google Scholar]
- 126.Biek R, Rodrigo AG, Holley D, Drummond A, Anderson CR, Ross HA, Poss M. 2003. Epidemiology, genetic diversity, and evolution of endemic feline immunodeficiency virus in a population of wild cougars. J. Virol. 77, 9578–9589. ( 10.1128/JVI.77.17.9578-9589.2003) [DOI] [PMC free article] [PubMed] [Google Scholar]
- 127.Cottam EM, et al. 2008. Transmission pathways of foot-and-mouth disease virus in the United Kingdom in 2007. PLoS Pathog. 4, e1000050 ( 10.1371/journal.ppat.1000050) [DOI] [PMC free article] [PubMed] [Google Scholar]
- 128.Volz EM, Koelle K, Bedford T. 2013. Viral phylodynamics. PLoS Comput. Biol. 9, e1002947 ( 10.1371/journal.pcbi.1002947) [DOI] [PMC free article] [PubMed] [Google Scholar]
- 129.VanderWaal KL, Atwill ER, Isbell LA, McCowan B. 2014. Linking social and pathogen transmission networks using microbial genetics in giraffe (Giraffa camelopardalis). J. Anim. Ecol. 83, 406–414. ( 10.1111/1365-2656.12137) [DOI] [PubMed] [Google Scholar]
- 130.Bull C, Godfrey S, Gordon D. 2012. Social networks and the spread of Salmonella in a sleepy lizard population. Mol. Ecol. 21, 4386–4392. ( 10.1111/j.1365-294X.2012.05653.x) [DOI] [PubMed] [Google Scholar]
- 131.Chiyo PI, Grieneisen LE, Wittemyer G, Moss CJ, Lee PC, Douglas-Hamilton I, Archie EA. 2014. The influence of social structure, habitat, and host traits on the transmission of Escherichia coli in wild elephants. PLoS ONE 9, e93408 ( 10.1371/journal.pone.0093408) [DOI] [PMC free article] [PubMed] [Google Scholar]
- 132.VanderWaal KL, Atwill ER, Isbell LA, McCowan B. 2014. Quantifying microbe transmission networks for wild and domestic ungulates in Kenya. Biol. Conserv. 169, 136–146. ( 10.1016/j.biocon.2013.11.008) [DOI] [Google Scholar]
- 133.Rwego IB, Isabirye-Basuta G, Gillespie TR, Goldberg TL. 2008. Gastrointestinal bacterial transmission among humans, mountain gorillas, and livestock in Bwindi Impenetrable National Park, Uganda. Conserv. Biol. 22, 1600–1607. ( 10.1111/j.1523-1739.2008.01018.x) [DOI] [PubMed] [Google Scholar]
- 134.Pflughoeft KJ, Versalovic J. 2012. Human microbiome in health and disease. Annu. Rev. Pathol. Mech. Dis. 7, 99–122. ( 10.1146/annurev-pathol-011811-132421) [DOI] [PubMed] [Google Scholar]
- 135.de Vos WM, de Vos EA. 2012. Role of the intestinal microbiome in health and disease: from correlation to causation. Nutr. Rev. 70, S45–S56. ( 10.1111/j.1753-4887.2012.00505.x) [DOI] [PubMed] [Google Scholar]
- 136.Danzeisen JL, Calvert AJ, Noll SL, McComb B, Sherwood JS, Logue CM, Johnson TJ. 2013. Succession of the turkey gastrointestinal bacterial microbiome related to weight gain. PeerJ 1, e237 ( 10.7717/peerj.237) [DOI] [PMC free article] [PubMed] [Google Scholar]
- 137.Shepard SM, Danzeisen JL, Isaacson RE, Seemann T, Achtman M, Johnson TJ. 2012. Genome sequences and phylogenetic analysis of K88-and F18-positive porcine enterotoxigenic Escherichia coli. J. Bacteriol. 194, 395–405. ( 10.1128/JB.06225-11) [DOI] [PMC free article] [PubMed] [Google Scholar]
- 138.Danzeisen JL, Kim HB, Isaacson RE, Tu ZJ, Johnson TJ. 2011. Modulations of the chicken cecal microbiome and metagenome in response to anticoccidial and growth promoter treatment. PLoS ONE 6, e27949 ( 10.1371/journal.pone.0027949) [DOI] [PMC free article] [PubMed] [Google Scholar]
- 139.Knights D, Kuczynski J, Charlson ES, Zaneveld J, Mozer MC, Collman RG, Bushman FD, Knight R, Kelley ST. 2011. Bayesian community-wide culture-independent microbial source tracking. Nat. Methods 8, 761–763. ( 10.1038/nmeth.1650) [DOI] [PMC free article] [PubMed] [Google Scholar]
- 140.Lax S, et al. 2014. Longitudinal analysis of microbial interaction between humans and the indoor environment. Science 345, 1048–1052. ( 10.1126/science.1254529) [DOI] [PMC free article] [PubMed] [Google Scholar]
- 141.Song SJ, et al. 2013. Cohabiting family members share microbiota with one another and with their dogs. Elife 2, e00458 ( 10.7554/eLife.00458) [DOI] [PMC free article] [PubMed] [Google Scholar]
- 142.Koch H, Schmid-Hempel P. 2011. Socially transmitted gut microbiota protect bumble bees against an intestinal parasite. Proc. Natl Acad. Sci. USA 108, 19 288–19 292. ( 10.1073/pnas.1110474108) [DOI] [PMC free article] [PubMed] [Google Scholar]
- 143.Jewell CP, Roberts GO. 2012. Enhancing Bayesian risk prediction for epidemics using contact tracing. Biostatistics 13, 567–579. ( 10.1093/biostatistics/kxs012) [DOI] [PubMed] [Google Scholar]
- 144.Kao RR, Haydon DT, Lycett SJ, Murcia PR. 2014. Supersize me: how whole-genome sequencing and big data are transforming epidemiology. Trends Microbiol. 22, 282–291. ( 10.1016/j.tim.2014.02.011) [DOI] [PMC free article] [PubMed] [Google Scholar]
- 145.Rasmussen DA, Volz EM, Koelle K. 2014. Phylodynamic inference for structured epidemiological models. PLoS Comput. Biol. 10, e1003570 ( 10.1371/journal.pcbi.1003570) [DOI] [PMC free article] [PubMed] [Google Scholar]
- 146.Pellis L, Ball F, Bansal S, Eames K, House T, Isham V, Trapman P. 2014. Eight challenges for network epidemic models. Epidemics. ( 10.1016/j.epidem.2014.07.003) [DOI] [PubMed] [Google Scholar]
- 147.Frost SDW, Pybus OG, Gog JR, Viboud C, Bonhoeffer S, Bedford T. 2014. Eight challenges in phylodynamic inference. Epidemics. ( 10.1016/j.epidem.2014.09.001) [DOI] [PMC free article] [PubMed] [Google Scholar]
- 148.Volz E, Meyers LA. 2009. Epidemic thresholds in dynamic contact networks. J. R. Soc. Interface 6, 233–241. ( 10.1098/rsif.2008.0218) [DOI] [PMC free article] [PubMed] [Google Scholar]
- 149.Enns EA, Brandeau ML. 2011. Inferring model parameters in network-based disease simulation. Health Care Manag. Sci. 14, 174–188. ( 10.1007/s10729-011-9150-2) [DOI] [PMC free article] [PubMed] [Google Scholar]
- 150.Restif O, et al. 2012. Model-guided fieldwork: practical guidelines for multidisciplinary research on wildlife ecological and epidemiological dynamics. Ecol. Lett. 15, 1083–1094. ( 10.1111/j.1461-0248.2012.01836.x) [DOI] [PMC free article] [PubMed] [Google Scholar]
- 151.Haydon DT. 2008. Cross-disciplinary demands of multihost pathogens. J. Anim. Ecol. 77, 1079–1081. ( 10.1111/j.1365-2656.2008.01474.x) [DOI] [PubMed] [Google Scholar]