

Abstract
Elevated risk of disease transmission is considered a major cost of sociality, although empirical evidence supporting this idea remains scant. Variation in spatial cohesion and the occurrence of social interactions may have profound implications for patterns of interindividual parasite transmission. We used a social network approach to shed light on the importance of different aspects of group-living (i.e. within-group associations versus physical contact) on patterns of parasitism in a neotropical primate, the brown spider monkey (Ateles hybridus), which exhibits a high degree of fission–fusion subgrouping. We used daily subgroup composition records to create a ‘proximity’ network, and built a separate ‘contact’ network using social interactions involving physical contact. In the proximity network, connectivity between individuals was homogeneous, whereas the contact network highlighted high between-individual variation in the extent to which animals had physical contact with others, which correlated with an individual's age and sex. The gastrointestinal parasite species richness of highly connected individuals was greater than that of less connected individuals in the contact network, but not in the proximity network. Our findings suggest that among brown spider monkeys, physical contact impacts the spread of several common parasites and supports the idea that pathogen transmission is one cost associated with social contact.
Keywords: contact networks, fission–fusion social structure, gastrointestinal parasites, parasite transmission, sociality
1. Introduction
Social behaviour is ubiquitous in nature—even solitary species must encounter conspecifics to mate and many provide parental care for their offspring. However, degree of social contact is highly variable among species, and this has important implications for the transmission of pathogens and parasites. In contrast to solitary species, adults of group-living species permanently associate with other adult conspecifics. Elevated risk of disease transmission is considered a major cost of group-living [1–3]. Support for this hypothesis comes from studies examining how patterns of parasitism relate to interspecific differences in social organization (i.e. group-living versus solitary lifestyle). Parasite prevalence and richness are often higher in gregarious mammals and colonial birds than in solitary species [4–6]. Additional evidence in support of this hypothesis is provided by studies of free-ranging primates, where group-living gorillas appear more susceptible to infections with Ebola than solitary males [7], and where the risk of infection with malaria parasites increases with group size in neotropical primates [8].
Parasite and pathogen transmission can be either direct (i.e. between host individuals) or indirect (i.e. encountered in the environment or passed through intermediate hosts or vectors). Social interactions that involve close proximity or physical contact between group members (e.g. grooming, huddling, mating, biting) can be used by parasites and pathogens as direct transmission pathways to spread through host populations [9–12] (reviewed in [1,2,13]). Therefore, generally, it has been predicted that higher levels of social interaction are associated with higher levels of transmission for directly transmitted parasites and pathogens, (e.g. sexually transmitted diseases, tuberculosis, rabies), whereas this should not be true for species with indirect transmission pathways [2]. However, empirical evidence shows that gastrointestinal parasites, which usually have indirect transmission pathways, can also be transmitted through social interactions (e.g. during grooming, when infectious stages are ingested by the grooming actor from the fur of the grooming recipient [9,11]).
Recently, social network analysis has been identified as a valuable tool to improve our understanding of the importance of social interactions in the transmission of parasites [14–23]. Social network tools can detect key social interactions of humans [24–26] and wildlife species [9,10,12,17,27–33] that may facilitate parasite transmission from one host individual to another (e.g. sexual encounters, grooming, biting). Such knowledge can be employed to predict which individuals or groups of individuals (e.g. specific age or sex classes) are likely to play pivotal roles in the transmission of infectious agents [20,31,34–39]. For example, social network analyses have demonstrated that in a variety of vertebrates—ranging from reptiles (sleepy lizards, Tiliqua rugosa [18,32]; tuatara, Sphenodon punctatus [40]) to mammals (giraffes, Giraffa camelopardalis [20]; brushtail possums, Trichosurus vulpecula [27])—highly connected individuals within a social network are also more likely to be infected with both ectoparasites [18,40] and bacteria (Escherchia coli [20], Salmonella enterica [32], Mycobacterium bovis [27]) than their conspecifics. Moreover, individuals that engage in certain types of behaviour (e.g. physical contact, grooming) or that are connected to infected individuals are also at greater risk of becoming infected themselves [9,10,12,33].
Social network tools have also proven useful to study the huge variation in spatio-temporal cohesion of group-living animals [41–43]. Variation in spatial cohesion of group members is a less studied, but probably also important, factor impacting the transmission of parasites and pathogens [2]. For example, the level of group stability (closed groups versus fluid or open groups) has been shown to affect the relationship between group size and prevalence of intestinal parasites in 11 African bovid species [4]. Similarly, the formation of seasonally stable subpopulations inhibits the spread of pneumonia among bighorn lambs (Oviscanadensis) belonging to different subpopulations [44]. Substructuring into social units (subpopulations or subgroups) probably impacts rates of social behaviour and therefore, potentially, parasite transmission through a population as well [45].
Typically, empirical studies investigating parasite transmission pathways build social networks by means of data on either social interactions [9,10,12] or spatial proximity (e.g. refuge sharing, home-range overlap) [17,18,20,30,35,36,40]. However, few studies have examined how different scales of spatial proximity affect parasite transmission, e.g. association patterns and home-range overlap [20], or subgroup membership and close physical contact [37]. To date, information is scant concerning the relative importance of social interactions and spatial cohesion of group members for the transmission of parasites. Species that manifest a high degree of fission–fusion dynamics—i.e. those where subgroups vary in size and composition over short time intervals [43]—represent a notable opportunity to study the relative influence of these factors on patterns of parasite transmission.
In this study, we aim to shed light on the relative importance of different levels of social interaction and spatial proximity for the transmission of gastrointestinal parasites. We collected data on a group-living primate species, the brown spider monkey (Ateles hybridus), which exhibits a high degree of fission–fusion dynamics. Using a social network approach, we combine information on social interactions between group members and spatial proximity (i.e. subgroup membership) with data on parasite infections. To investigate how spatial proximity in the same subgroup versus close physical contact differentially influence patterns of parasitism, we compared results using a ‘proximity’ network based on subgroup composition records and a ‘contact’ network based on social interactions involving physical contact (e.g. grooming, mating). We examined several common gastrointestinal parasites (Strongyloides, Entamoeba, Necator, Trichostrongylus, Trypanoxyuris) of A. hybridus to evaluate the relative importance of social interactions and spatial proximity on parasite transmission. Strongyloides, Trichostrongylus and Necator are environmentally borne nematodes [46]. Similarly, cysts of the protozoa Entamoeba survive outside the host in water and soil [47]. In contrast, Trypanoxyuris is a faecal–orally transmitted pinworm, which adheres its eggs on the perianal skin [48,49]. Empirical evidence suggests that all of these parasites can be transmitted through interactions involving physical contact. For example, grooming has been shown to facilitate the transmission of nematode species in mice (Mus musculus) [11] and Japanese macaques (Macaca fuscata yakui) [9].
Simultaneously investigating these dynamics allows us to determine the relative importance of social (through physical contact) versus environmental (though space sharing while in the same subgroup) transmission for gastrointestinal parasites. If physical contact between host individuals represents an important transmission pathway for these parasites, we expect that certain parameters of the contact network (i.e. node degree, centrality indices, indegree and outdegree) will correlate with patterns of parasitism in the study group, and that highly connected individuals will have greater parasite diversity than less connected individuals, whereas if environmental transmission is the more common transmission mode, we predict finding a stronger association between these network parameters and the patterns of parasitism in the proximity network.
2. Methods
(a). Study site and study subjects
We collected data on brown spider monkeys (A. hybridus) living in a forest fragment located within the private cattle ranch ‘Hacienda San Juan de Carare’ (06°43′ N, 74°09′ W; 150–200 m.a.s.l.) in Colombia. The fragment comprises 65 ha of seasonally flooded tropical rainforest and is located between the central and eastern cordilleras of the Andes in the middle Magdalena River Valley. The area has bimodal rainy seasons, with peak rains occurring from March to May and from September to November [50]. The area receives an annual median rainfall of approximately 3500 mm and has a mean temperature of 27.9°C [51]. Brown spider monkeys are endemic to Colombia and Venezuela, and they are listed as critically endangered by the IUCN [52]. For this study, we collected data on one study group (SJ-1), which during the study period consisted of three to four adult males, five adult females, one subadult female, one to three subadult males, zero to two juvenile males, three to four juvenile females, one infant male and one infant female (total = 14–16). The forest fragment was occupied by a second group of brown spider monkeys, but intergroup encounters between these two groups were rare [53], however, and almost never included physical contact. Thus, we assumed that between-group parasite transmission rates were very low or non-existent. Although the study group ranges in a small forest fragment, patterns (e.g. directionality) and rates of social interactions resemble those seen in other studies of Ateles in less disturbed habitat (see [54]). Therefore, we are confident that the results concerning the social interactions are representative for the study taxon.
(b). Faecal sample collection and analysis
We collected a total of 166 faecal samples from the study group between August 2010 and August 2012. On average, we collected 19 faecal samples per adult female (s.d. = 1.5), 15.6 (s.d. = 3.2) per adult male and 7.6 (s.d. = 5.8) per subadult individual. Only one faecal sample was collected from a juvenile individual. We placed approximately 1 g of fresh faeces into a 15 ml polypropylene tube pre-filled with 10% buffered formalin solution and shook the tube manually until the sample was suspended in the solvent. Each tube was sealed with parafilm and labelled with the animal's ID and the collection date. We stored the tubes at ambient temperatures (approx. 25°C) and transported them to the University of Los Andes, Bogotá every two months, where we stored them at −20°C until shipment to Emory University, Atlanta for the analysis of gastrointestinal parasites.
We examined each faecal sample for helminth eggs and larvae and protozoan cysts using concentration by sodium nitrate flotation and faecal sedimentation [55]. We counted eggs and cysts, and used egg or cyst colour, shape, contents and size to identify parasites. Iodine was used to facilitate protozoan identification. Parasites were identified to the family level and if possible to the genus level.
(c). Behavioural sampling
We collected behavioural data on all adult individuals from July 2010 to June 2012 using all-day focal animal sampling (total of 1554 h). We collected, on average, 173 h (s.d. = 29.6) of focal animal data on each adult female and 156 h (s.d. = 33.6) on each adult male. All individuals could reliably be identified, and we attempted to balance the sampling effort between individuals. We recorded subgroup composition upon encountering a subgroup, and thereafter every 15 min, for the entire length of the focal animal sample. Changes in subgroup composition were recorded whenever one or more individuals joined (‘fused’) or left (‘fissioned’) the subgroup containing the focal animal. We considered individuals as belonging to the same subgroup when they were at a distance of less than or equal to 50 m from at least one other subgroup member following a chain rule [53,56]. On a daily basis, multiple observers (2–5) followed one focal individual each, thereby increasing the probability of noting ‘fission’ and ‘fusion’ events. For cases in which several observers followed individuals that ranged together in the same subgroup during a focal animal follow, we used only data on the subgroup composition collected by one observer (the longest one focal animal sampling) to prevent pseudo-replication.
During focal animal follows, we also recorded all social interactions that involved physical contact (grooming, resting in contact, embracing, mating and social play) using all-occurrence sampling. We recorded the duration of each interaction (except for ‘embraces’ because they are brief events) and identified the actor and recipient whenever possible.
(d). Social network parameters
We used daily subgroup composition records to build a proximity network, and we used data on social interactions involving physical contact to build two contact networks (one including all types of social interactions and a second one only using data on grooming interactions). We used weighted networks, which take into account the frequency of social interactions in the contact network and interindividual association indices in the proximity network. In the contact networks, the weight used for the links represents the amount of time (minutes) that a pair of individuals was in physical contact. The amount of time any given pair spent in contact was corrected for the time these individuals spent together in the same subgroup. Similarly, weight was applied to the grooming network by dividing the amount of time of ‘received’ and ‘given’ grooming by the amount of time spent in the same subgroup. Links in the proximity network were weighted using the association index of each dyad. The association index between pairs was calculated using the half-weight index (HWI) [57], according to the following formula
where mab represents the time during which individual a and individual b were seen together in a subgroup; m0 represents focal samplings during which the two animals were not in observed subgroups; ma and mb represent periods in which only one of the two individuals, either a or b, was observed in a subgroup [58]. The HWI ranges from zero (i.e. for dyads that were never seen together) to one (i.e. for dyads that were always seen together).
In all networks, each node represents an individual, and the link connecting two nodes represents either subgroup co-membership or a physical contact event between the two individuals (e.g. grooming, mating and embracing) in the proximity network or contact networks, respectively. We also made distinctions between sex and age of individuals. In addition, we created a distinct network including parasite infection to highlight how structure and frequency of contacts could have modulated the patterns of parasitism seen in the surveyed spider monkey group. In this parasite network, nodes are represented by pie charts showing the infection pool of each individual, and the width of each link is proportional to frequency of interactions between connected nodes.
In order to describe the topology of the proximity and contact networks, for each individual we calculated five network parameters that are presumed to be relevant for parasite transmission [29]. Three of these parameters (node strength, closeness centrality and betweenness centrality) were weight, the link weight for the contact network and the proximity network were frequency of social interactions (time) and HWI, respectively. (i) Node strength: the sum of link weights of a given individual [59]. Centrality is a general measure of the importance of an individual in the network; the more central an individual is in the network, the greater is its potential role in pathogen transmission. Insights into the heterogeneity of a network can thus be gained from indices of centrality, and we determined two such indices—namely closeness centrality and betweenness centrality. (ii) Closeness centrality: the shortest path (number of links) needed to reach all individuals in the network from a given individual. This index represents how easily infectious stages can spread from one individual to all others in the network [27]. A high closeness value represents a network in which one central individual is connected to all others, whereas all other individuals are not connected. A low closeness value indicates a homogeneous network in which all individuals are equally connected to one another. (iii) Betweenness centrality: the number of paths that pass through an individual if the shortest paths between all other pairs of individuals are traced. The flow of parasites and pathogen through the network can be measured using this index. In contrast to closeness, individuals with a high betweenness value do not necessarily have a high number of links with other individuals, but can play an important bridging role in terms of transmission. When betweenness is at its maximum, a single individual is the ‘hub’ that connects all other individuals; when betweenness is at its minimum, all individuals are equally connected. Further, we calculated two unweight parameters for the contact network representing grooming interactions: (iv) indegree: the number of links directed towards a given animal, i.e. the number of social interactions it receives; and (v) outdegree: the number of links originating from a given individual, i.e. the number of social interactions it initiates.
Fission–fusion grouping patterns, as exhibited by spider monkeys, can have a great impact on social interactions between individuals. Subgroup formation is dynamic, and subgroups may last for as little as a few minutes to a few hours, or for longer periods like several days. We created a dynamic network to visualize the fluidity of fission–fusion events in the study group. The changes in the dynamic network are presented in a video (see electronic supplementary material, video S1). However, the dynamic network was used for visual inspection of the fission–fusion dynamics only; no statistical analyses were conducted using this video. Links in the network presented in the electronic supplementary material, video S1 represent the co-presence of individuals in a subgroup during a focal observation.
(e). Statistical analyses
A Shapiro–Wilk test was used to determine whether distribution of node strength for contact network and proximity network followed a normal distribution. The data did not follow a normal distribution (Shapiro–Wilk test, W = 0.94, p < 0.01), thus non-parametric procedures were used. We used Wilcoxon sign-rank tests to test for differences in social interactions involving physical contact between animals belonging to different age and sex classes. We used Spearman's rank correlation tests to investigate associations between network parameters of nodes and parasite infection (using Bonferroni corrections of p-values for multiple comparisons). Differences of HWI average (mean of HWI of node links) between individuals from different sex and age classes were tested using t-tests. Correlations between HWI node strength (sum of HWI of node links) and parasite infection were investigated using Spearman's rank correlation tests (with Bonferroni corrections of p-values for multiple comparisons).
The composition of the spider monkey group changed slightly during the study period. To investigate if this factor heavily affected contact and proximity networks, we performed a Mantel test to compare networks between years. We did not find any significant differences among the proximity networks between years (Mantel test, p = 0.34), and therefore combined the data from the different years.
Given the non-independence of the data (subgroup co-membership is a prerequisite for social interactions), we tested our data against a null model generated by randomizations of the social networks [57,60,61]. For each test, we generated 10 000 randomizations of the social networks. The randomized networks were created using the algorithm described in Bejder et al. [62], interchanging individuals between subgroups. All analyses were conducted in R [63].
3. Results
(a). Proximity network
Subgroup composition was fluid (electronic supplementary material, video S1), and visual inspection of the network video demonstrated no stable subgroups (except for adult females and their dependent offspring) in the study group. The number of individuals forming each subgroup varied from one individual to the entire group (median (MD) = 10, interquartile range (IQR) = 6–13), and all individuals showed similar association indices (figure 1b). The individual HWI average of juveniles (mean = 0.66, s.d. = 0.08) and adults (mean = 0.69, s.d. = 0.06) was not significantly different (t-test, t = 5.8, p = 0.22, sample size = 17). Similar results were found comparing the mean HWI of females (mean = 0.67, s.d. = 0.05) and males (mean = 0.69, s.d. = 0.06; t-test, t = 3.5, p = 0.33, sample size = 17). Values of closeness and betweenness for the proximity network were 0.45 (s.d. = 0.03) and 0.32 (s.d. = 0.05), respectively. Similar HWI values between individuals indicate that no individual was seen more often in subgroups than others. The process of dynamic subgroup formation and reassortment observed in the study group resulted in a well-mixed social environment in which each individual could potentially come into contact with any and all other members of its group.
Figure 1.
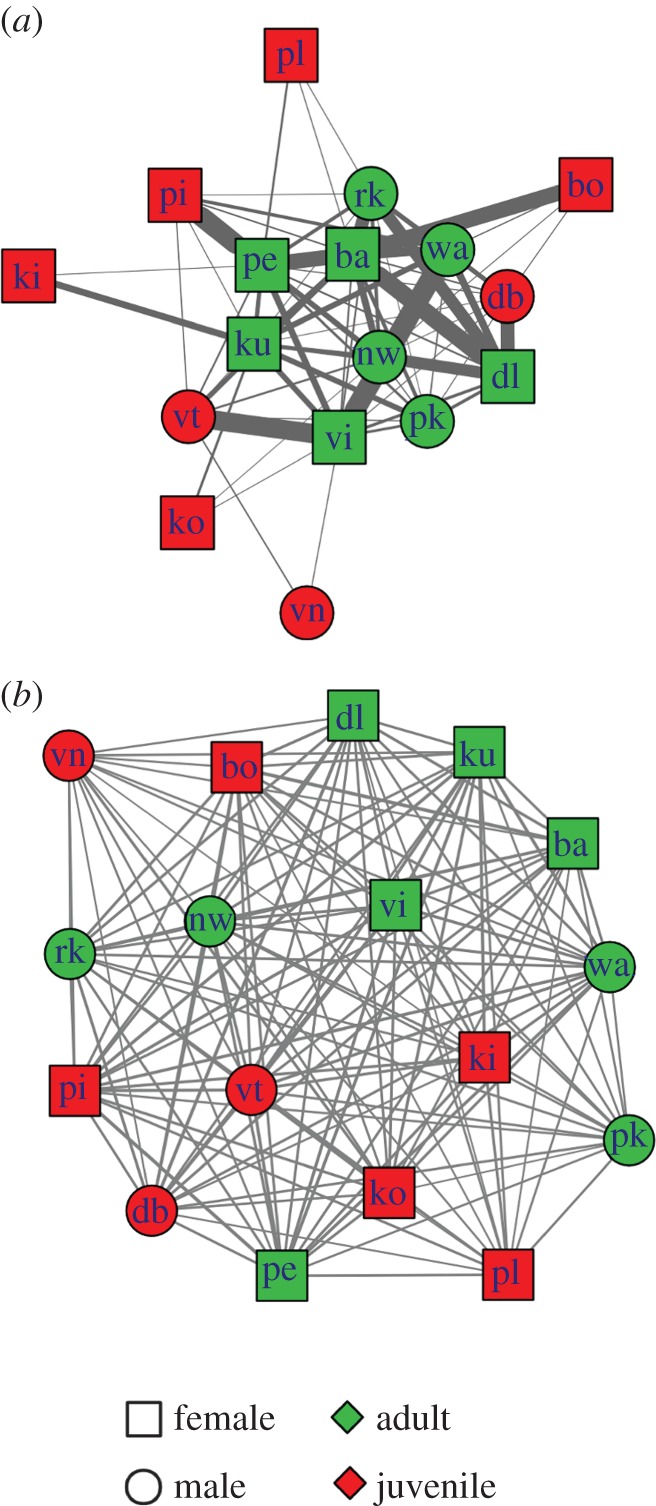
Contact and proximity networks. (a) Contact network: width of links is proportional to contact frequency, calculated as the number of minutes spent in contact divided by the number of minutes spent in same subgroup. (b) Proximity network: this network is a static representation of interconnections between spider monkeys shown in the dynamic network presented in the electronic supplementary material, video S1. Individuals are linked to one another only if they were recorded in the same subgroup during the study period. The width of links is proportional to the half-weight index (HWI) of the dyad. Both the contact and proximity network also indicate the age and sex attributes of individuals. The position of nodes in the networks was calculated with the Kamada–Kawai algorithm based on link weight. Individual identity of each spider monkey is indicated by a two-letter code. (Online version in colour.)
(b). Contact network
The median number of edges of each individual in the contact network (figure 1) was equal to 9 (IQR: 4–12). Adults had a significantly higher frequency of social interactions involving physical contact (MD = 0.57, IQR: 0.35–0.67) than juveniles (MD = 0.32; IQR: 0.23–0.45; Wilcoxon test, W = 8.2, p < 0.01, sample size = 17; figure 1a). Females had significantly more social interactions involving physical contact (MD = 0.62; IQR: 0.41–0.76) than males (MD = 0.43; IQR: 0.32–0.61; Wilcoxon test, W = 15.3, p < 0.01, sample size = 17). Grooming was the most common form of physical contact, followed by mating and playing (figure 2b). During the entire study period, females groomed other individuals (outgrooming) more often than males (Wilcoxon test, W = 8.3, p < 0.01, sample size = 17; figure 3). Juveniles groomed and received grooming from fewer individuals than adults (Wilcoxon test, W = 12.1, p < 0.01, sample size = 17; figure 2a). The contact network structure did not differ between study years (Mantel test, p = 0.24).
Figure 2.
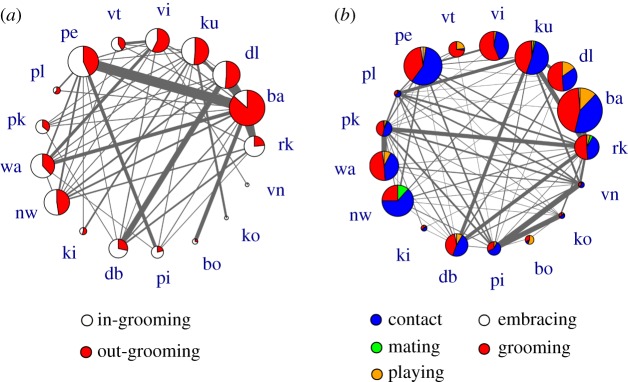
Grooming network and topology of contacts between individuals of the study group. (a) Pies of nodes represent the percentage of grooming during which an individual was grooming other individuals (outgrooming, red) versus receiving grooming (in-grooming, white) from another individual of the group. (b) Social network showing the proportion of the most common types of social interactions per individual. The size of each pie is proportional to the number of individual links. In both networks, the link width was set proportional to the grooming frequency and the overall physical contact frequency for the grooming network and for the overall contact network, respectively. Individual identity of each spider monkey is indicated by a two-letter code. (Online version in colour.)
Figure 3.
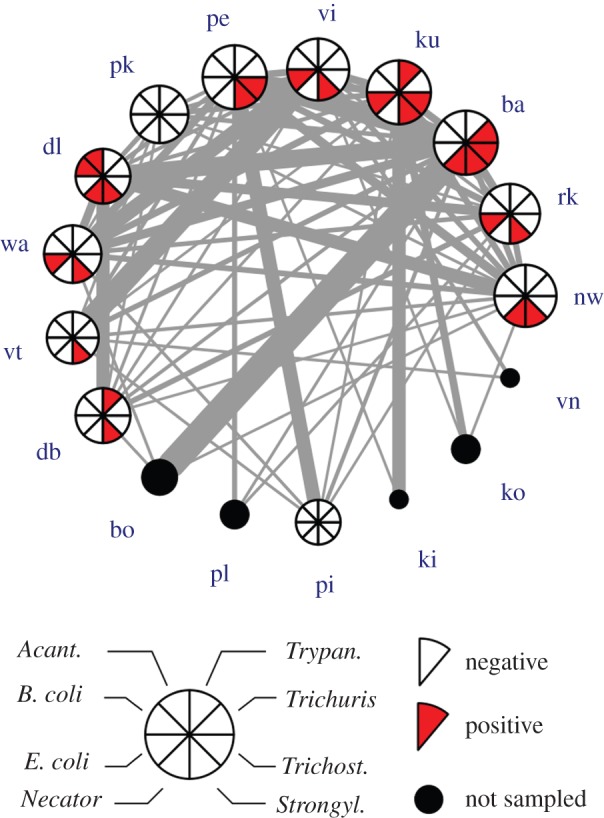
Spider monkey contact network and level of parasite infection of each individual. The network represents the network of social interactions with physical contact among individuals in the study group. The width of each link is proportional to the frequency of interactions between connected nodes. Nodes are represented by pie charts showing the infection pool of the individual. The size of each pie is proportional to the number of other individuals connected to a given individual (i.e. its node degree). Individual identity of each spider monkey is indicated by a two-letter code. (Online version in colour.)
(c). Parasitism
Among the 12 spider monkeys examined, 10 had parasites (83.3%) and nine (75%) of them showed a simultaneous infection with two to four parasites (figure 3). Strongyloides sp. was reported in all parasitized animals (n = 10). Four individuals (33.3%) were infected with Entamoeba, three with Necator (25%), three with Trichostrongylus and two with Trypanoxyuris (16.7%). Single infections with Acanthocephala, Neobalantidium and Trichuris were found. Moreover, different individual spider monkeys were co-infected with different combinations of parasites. Strongyloides associated with Entamoeba was the most frequent type of co-infection (33.3%; figure 3).
(d). Network metrics and parasitism
Correlations between parameters of the contact network and patterns of parasitism in the study group are reported in table 1. The degree of parasitism (parasite richness) showed by each spider monkey was related to the social connectivity of individuals (table 1). The strength and the centrality index ‘betweenness’ were both correlated with infections with Strongyloides sp. and Trichostrongylus. The number of grooming interactions initiated by a given individual was also positively associated with both these parasites. Additionally, ‘closeness’ in the contact network was also significantly correlated with infections with Trichostrongylus. Parasite species richness was positively correlated with the time spent together in a subgroup, betweenness, closeness and frequency of initiated grooming interactions. In contrast, the frequency of received grooming interactions correlated neither with parasite infection nor with parasite species richness. In contrast to the correlations between network parameters and parasite infection in the contact network (table 1), no correlations were found between parasite infection and node association index/betweenness/closeness in the proximity network (table 2).
Table 1.
Correlations between parasite infection and parasite species richness with node attributes of the contact network. Spearman's rank correlation coefficients (ρ) are reported. Statistically significant correlations (after Bonferroni correction) are highlighted in italics. Sample size = 12 animals.
| parasite species | node strengtha | betweennessa | closenessa | indegreeb | outdegreec |
|---|---|---|---|---|---|
| Entamoeba | 0.16 | 0.24 | 0.21 | 0.25 | 0.07 |
| Necator | 0.34 | 0.12 | 0.11 | 0.01 | 0.53 |
| Strongyloides | 0.57* | 0.61* | 0.42 | 0.35 | 0.75* |
| Trichostrongylus | 0.54* | 0.54* | 0.66** | 0.11 | 0.54* |
| Trichuris | 0.21 | 0.15 | 0.19 | −0.20 | 0.48 |
| Trypanoxyuris | −0.09 | 0.02 | 0.09 | −0.12 | −0.13 |
| parasite species richnessd | 0.67** | 0.58* | 0.87* | 0.12 | 0.72** |
*p < 0.05.
**p < 0.01.
aThis measure was calculated as frequency of direct contact with other individuals from the full contact network in figure 1.
bCalculated as frequency of received grooming interactions during the study period.
cCalculated as frequency of initiated grooming interactions during the study period.
dThe number of parasite species found in one host.
Table 2.
Correlations between parasite infection and parasite species richness with node attributes of the proximity network. Spearman's rank correlation coefficients (ρ) are reported. Sample size = 12 animals.
| parasite species | node strengtha | betweennessa | closenessa |
|---|---|---|---|
| Entamoeba | 0.23 | 0.14 | 0.01 |
| Necator | 0.02 | 0.13 | −0.10 |
| Strongyloides | 0.13 | 0.17 | 0.32 |
| Trichostrongylus | 0.13 | −0.12 | 0.07 |
| Trichuris | −0.11 | 0.22 | 0.18 |
| Trypanoxyuris | 0.10 | 0.02 | 0.23 |
| parasite species richnessb | 0.21 | 0.32 | −0.01 |
aThis measure was calculated as the sum of all association indices (HWI) of each individual.
bThe number of parasite species found in one host.
4. Discussion
Our results suggest that the two aspects of group-living we examined—association in the same subgroup (or ‘proximity’) versus physical contact—differ concerning their impact on the spread of gastrointestinal parasites between brown spider monkeys. Further, our results demonstrate that patterns of social interactions seemingly affect gastrointestinal parasite transmission in the study species. The results concerning the two types of social network contrasted strongly: while the proximity network showed a homogeneous connectivity among all individuals and no correlation between parasite infection and network parameters, the contact network showed high between-individual heterogeneity and correlations between parasite infection and several network parameters. Specifically, infection with two common parasites of brown spider monkeys—Strongyloides sp. and Trichostrongylus—correlated with individuals’ participation in grooming interactions. An individual's parasite species richness was also correlated with its position in the contact network, further emphasizing the importance of social interactions for parasite transmission.
The relationship between an individual's position in the social network on the one hand and parasite infection on the other suggests that social interactions involving physical contact can play a role in gastrointestinal parasite transmission. This link between social interactions and parasite or pathogen transmission has also been reported among other primates (e.g. in female Japanese macaques [9]) and other social mammals (e.g. giraffes [20], meerkats (Suricata suricatta [12]). Interestingly, these studies included parasites and pathogens with different transmission modes, e.g. with direct transmission like M. bovis [12] but also with environmental transmission like Oesophagostomum aculeatum [9] and E. coli [20], demonstrating that the documented link between social interactions and parasite/pathogen transmission is more common than previously thought and also applies to species with an indirect transmission mode, as further confirmed by our study. Collectively, these results provide support for the hypothesis that increased risk of disease transmission is a cost of higher diversity and number of social contacts [1–3] (reviewed in [64]).
(a). Importance of grooming interactions for the transmission of parasites
Our results suggest that the directionality of social interactions may also be an important factor influencing the risk of infection with gastrointestinal parasites and emphasize that this factor must be considered when investigating parasite transmission in social animals. In our study, indegree (initiated grooming interactions) was positively associated with an individual's infection with Strongyloides sp. and Trichostrongylus and with parasite species richness. By contrast, outdegree (grooming received) was correlated with neither parasite infection nor with parasite species richness. Gastrointestinal parasites can be transmitted if the grooming actor ingests infectious stages while grooming another individual. Infectious stages may be ingested in various ways: (i) during ano-genital grooming as some parasites deposit their eggs on the perianal skin (e.g. Trypanoxyuris [48,49]—although the absence of correlations between network parameters and infection with this parasite indicates that this might not be a common transmission pathway in our study group), or (ii) during grooming of other body parts, where larvae are attached to the fur of their hosts (e.g. trichostrongyloid nematodes [40]).
A differential influence of directionality of grooming interactions has also been found in meerkats, where individuals who groom others most were more likely to become infected with tuberculosis (M. bovis) than were individuals who received most grooming [12]. In contrast, in female Japanese macaques, exposure to infective stages of gastrointestinal nematodes was affected by rank-mediated social contact, where high-ranking individuals showed high levels of infection with parasites and also occupied central positions in both the outward and inward grooming networks [9]. Dominance rank influences grooming relationships in many species [54,65–67] and can also be a factor affecting parasite transmission [9,68]. During this study, however, we could not detect a dominance hierarchy among the individuals in the study group. These findings match those of most other long-term studies on spider monkeys, which also report a lack of dominance hierarchies both among males and among females [69–71]. Hence, dominance relationships are unlikely to affect patterns of parasite transmission in A. hybridus (and other spider monkey species).
Social networks have been used as a tool to identify individuals likely to become ‘super-spreaders’—individuals that are disproportionately responsible for the transmission of a pathogen throughout a network [38,72,73]. However, our results suggest that there is a low potential for the occurrence of ‘super-spreaders’ in our study group. For an individual to act as a ‘super-spreader’ in this particular group, it would have to (i) initiate a disproportionately high number of grooming interactions in order to become infected with the pathogens of other individuals, and (ii) it would also have to receive a disproportionately high number grooming interactions from others to spread these pathogens to additional individuals. Although adult females initiated more grooming interactions than adult males, none of these females also received disproportionately high numbers of grooming interactions, decreasing the potential for the occurrence of ‘super-spreaders’ in this group. Similar conclusions can be drawn from the fact that the proximity network was essentially homogeneous; each individual had a similar number of links, providing no evidence for the presence of ‘super-spreaders’.
(b). Differential effect of spatial cohesion and social interactions on pathogen transmission
To date, few studies have evaluated the differential influence of spatial cohesion and social interactions on pathogen transmission within the same study species [20,32], and very little information is available concerning species that exhibit fluid grouping patterns [20,37]. Chimpanzees (Pan troglodytes) and spider monkeys share many aspects of their social system [74–76]; most notably, both genera exhibit very high levels of fission–fusion dynamics [75,77,78]. However, in contrast to our results, a party composition network (comparable to our proximity network) and a close-contact network (less than or equal to 5 m proximity) of chimpanzees both showed high homogeneity, and most individuals showed moderate centrality in these networks [37]. In the same study, higher-ranking individuals were also more central in both networks and more likely to play an important role in parasite transmission [37]. These results stand in contrast to our results and demonstrate that similarly fluid grouping patterns may not necessarily result in similarly structured social networks. Factors such as presence (or absence) of dominance hierarchies can modulate social networks and, hence, also parasite transmission through these networks. To date, information on how species with flexible grouping patterns differ in the transmission of pathogens through their social networks is scant and warrants further research.
(c). Conclusions
Our results highlight how social interactions—and specifically the directionality of grooming interactions—can affect the transmission of common gastrointestinal parasites in A. hybridus. Our findings add empirical support to the idea that pathogen transmission can be one cost of social contact, and that fluid subgrouping patterns may promote (gastrointestinal) parasite transmission when compared with groups or populations which are substructured, but where those subgroups or subpopulations are less fluid and flexible. High fission–fusion dynamics can modulate parasite transmission by creating opportunities for frequent social interactions with all other group members.
Supplementary Material
Supplementary Material
Supplementary Material
Acknowledgements
We thank the Lalinde and DeGreiff families who have allowed us to conduct our research at ‘Hacienda San Juan de Carare’. We also thank the Ministerio de Medio Ambiente y Desarrollo Sostenible in Colombia for all the permits needed to conduct this study. We thank Prof. P. R. Stevenson for logistic support with sample storage, and we thank F. Alfonso, L. J. Diaz, N. Fuentes, M. Garcia, A. Montes and A. Pardo for their help with data collection. We thank W. Eckardt for her help in the laboratory at Emory University and C. Young for helpful comments on an earlier version of this manuscript. We are grateful to P. Kappeler and C. Nunn for the invitation to participate in this issue, and thank P. Kappeler, C. Nunn and two anonymous reviewers for their valuable comments on an earlier version of this manuscript. We thank Fundación Proyecto Primates for providing all logistical support. The research adhered to the legal requirements and animal care regulations of Germany and Colombia.
Data accessibility
The datasets supporting this article have been uploaded as part of the electronic supplementary material.
Funding statement
R.R. was supported by the German Primate Center. R.R., N.G. and A.L. were supported by Marsh Biodiversity Foundation's Primate Action Fund, Rufford Small Grants Foundation and Idea Wild. T.R.G. and D.B. were supported by Emory University. A.L. and A.D. were funded by the Ecopetrol Diversity Grants programme, the National Science Foundation of the United States (BCS 1062540) and the National Geographic Society (grant no. 8785-10).
Authors' contributions
R.R., A.L., A.D. and N.G. designed the field study research design and collected field data. N.G. and T.R.G. carried out the laboratory analyses. D.B. and T.R.G. carried out statistical analyses. R.R., D.B. and T.R.G. wrote the manuscript. All authors gave final approval for publication.
Conflict of interests
The authors have no competing interests.
References
- 1.Møller A, Dufva R, Allander K. 1993. Parasites and the evolution of host social behavior. Adv. Study Behav. 22, 65–102. ( 10.1016/S0065-3454(08)60405-2) [DOI] [Google Scholar]
- 2.Altizer S, et al. 2003. Social organization and parasite risk in mammals: integrating theory and empirical studies. Annu. Rev. Ecol. Evol. Syst. 34, 517–547. ( 10.1146/annurev.ecolsys.34.030102.151725) [DOI] [Google Scholar]
- 3.Alexander RD. 1974. The evolution of social behavior. Annu. Rev. Ecol. Syst. 5, 325–383. ( 10.1146/annurev.es.05.110174.001545) [DOI] [Google Scholar]
- 4.Ezenwa VO. 2004. Host social behavior and parasitic infection: a multifactorial approach. Behav. Ecol. 15, 446–454. ( 10.1093/beheco/arh028) [DOI] [Google Scholar]
- 5.Tella JL. 2002. The evolutionary transition to coloniality promotes higher blood parasitism in birds. J. Evol. Biol. 15, 32–41. ( 10.1046/j.1420-9101.2002.00375.x) [DOI] [Google Scholar]
- 6.Poulin R. 1991. Group-living and infestation by ectoparasites in passerines. Condor 93, 418–423. ( 10.2307/1368958) [DOI] [Google Scholar]
- 7.Caillaud D, Levréro F, Cristescu R, Gatti S, Dewas M, Douadi M, Gautier-Hion A, Raymond M, Ménard N. 2006. Gorilla susceptibility to Ebola virus: the cost of sociality. Curr. Biol. 16, R489–R491. ( 10.1016/j.cub.2006.06.017) [DOI] [PubMed] [Google Scholar]
- 8.Nunn CL, Heymann EW. 2005. Malaria infection and host behavior: a comparative study of Neotropical primates. Behav. Ecol. Sociobiol. 59, 30–37. ( 10.1007/s00265-005-0005-z) [DOI] [Google Scholar]
- 9.MacIntosh AJJ, Jacobs A, Garcia C, Shimizu K, Mouri K, Huffman MA, Hernandez AD. 2012. Monkeys in the middle: parasite transmission through the social network of a wild primate. PLoS ONE 7, e51144 ( 10.1371/journal.pone.0051144) [DOI] [PMC free article] [PubMed] [Google Scholar]
- 10.Otterstatter MC, Thomson JD. 2007. Contact networks and transmission of an intestinal pathogen in bumble bee (Bombus impatiens) colonies. Oecologia 154, 411–421. ( 10.1007/s00442-007-0834-8) [DOI] [PubMed] [Google Scholar]
- 11.Hernandez AD, Sukhdeo MVK. 1995. Host grooming and the transmission strategy of Heligmosomoides polygyrus. J. Parasitol. 81, 865–869. ( 10.2307/3284031) [DOI] [PubMed] [Google Scholar]
- 12.Drewe JA. 2010. Who infects whom? Social networks and tuberculosis transmission in wild meerkats. Proc. R. Soc. B 277, 633–642. ( 10.1098/rspb.2009.1775) [DOI] [PMC free article] [PubMed] [Google Scholar]
- 13.Craft ME. 2015. Infectious disease transmission and contact networks in wildlife and livestock. Phil. Trans. R. Soc. B 370, 20140107 ( 10.1098/rstb.2014.0107) [DOI] [PMC free article] [PubMed] [Google Scholar]
- 14.Craft ME, Caillaud D. 2011. Network models: an underutilized tool in wildlife epidemiology? Interdiscip. Perspect. Infect. Dis. 2011, 676949 ( 10.1155/2011/676949) [DOI] [PMC free article] [PubMed] [Google Scholar]
- 15.Craft ME, Volz E, Packer C, Meyers LA. 2009. Distinguishing epidemic waves from disease spillover in a wildlife population. Proc. R. Soc. B 276, 1777–1785. ( 10.1098/rspb.2008.1636) [DOI] [PMC free article] [PubMed] [Google Scholar]
- 16.Bansal S, Grenfell BT, Meyers LA. 2007. When individual behaviour matters: homogeneous and network models in epidemiology. J. R. Soc. Interface 4, 879–891. ( 10.1098/rsif.2007.1100) [DOI] [PMC free article] [PubMed] [Google Scholar]
- 17.Hirsch BT, Prange S, Hauver SA, Gehrt SD. 2013. Raccoon social networks and the potential for disease transmission. PLoS ONE 8, e75830 ( 10.1371/journal.pone.0075830) [DOI] [PMC free article] [PubMed] [Google Scholar]
- 18.Leu ST, Kappeler PM, Bull CM. 2010. Refuge sharing network predicts ectoparasite load in a lizard. Behav. Ecol. Sociobiol. 64, 1495–1503. ( 10.1007/s00265-010-0964-6) [DOI] [PMC free article] [PubMed] [Google Scholar]
- 19.Kurvers RHJM, Krause J, Croft DP, Wilson ADM, Wolf M. 2014. The evolutionary and ecological consequences of animal social networks: emerging issues. Trends Ecol. Evol. 29, 326–335. ( 10.1016/j.tree.2014.04.002) [DOI] [PubMed] [Google Scholar]
- 20.VanderWaal KL, Atwill ER, Isbell LA, McCowan B. 2014. Linking social and pathogen transmission networks using microbial genetics in giraffe (Giraffa camelopardalis). J. Anim. Ecol. 83, 406–414. ( 10.1111/1365-2656.12137) [DOI] [PubMed] [Google Scholar]
- 21.Meyers LA. 2007. Contact network epidemiology: bond percolation applied to infectious disease prediction and control. Bull. Am. Math. Soc. 44, 63–87. ( 10.1090/S0273-0979-06-01148-7) [DOI] [Google Scholar]
- 22.Godfrey SS. 2013. Networks and the ecology of parasite transmission: a framework for wildlife parasitology. Int. J. Parasitol. Parasites Wildl. 2, 235–245. ( 10.1016/j.ijppaw.2013.09.001) [DOI] [PMC free article] [PubMed] [Google Scholar]
- 23.Keeling MJ, Eames KTD. 2005. Networks and epidemic models. J. R. Soc. Interface 2, 295–307. ( 10.1098/rsif.2005.0051) [DOI] [PMC free article] [PubMed] [Google Scholar]
- 24.Read JM, Eames KTD, Edmunds WJ. 2008. Dynamic social networks and the implications for the spread of infectious disease. J. R. Soc. Interface 5, 1001–1007. ( 10.1098/rsif.2008.0013) [DOI] [PMC free article] [PubMed] [Google Scholar]
- 25.Liljeros F, Edling CR, Amaral LAN, Stanley HE, Åberg Y. 2001. The web of human sexual contacts. Nature 411, 907–908. ( 10.1038/35082140) [DOI] [PubMed] [Google Scholar]
- 26.Eubank S, Guclu H, Kumar VSA, Marathe MV, Srinivasan A, Toroczkai Z, Wang N. 2004. Modelling disease outbreaks in realistic urban social networks. Nature 429, 180–184. ( 10.1038/nature02541) [DOI] [PubMed] [Google Scholar]
- 27.Corner LAL, Pfeiffer DU, Morris RS. 2003. Social-network analysis of Mycobacterium bovis transmission among captive brushtail possums (Trichosurus vulpecula). Prev. Vet. Med. 59, 147–167. ( 10.1016/S0167-5877(03)00075-8) [DOI] [PubMed] [Google Scholar]
- 28.Keeling M. 2005. The implications of network structure for epidemic dynamics. Theor. Popul. Biol. 67, 1–8. ( 10.1016/j.tpb.2004.08.002) [DOI] [PubMed] [Google Scholar]
- 29.Perkins SE, Cagnacci F, Stradiotto A, Arnoldi D, Hudson PJ. 2009. Comparison of social networks derived from ecological data: implications for inferring infectious disease dynamics. J. Anim. Ecol. 78, 1015–1022. ( 10.1111/j.1365-2656.2009.01557.x) [DOI] [PubMed] [Google Scholar]
- 30.Cross PC, Lloyd-Smith JO, Bowers JA, Hay CT, Hofmeyr M, Getz WM. 2004. Integrating association data and disease dynamics in a social ungulate: bovine tuberculosis in African buffalo in the Kruger National Park. Ann. Zool. Fennici 41, 879–892. [Google Scholar]
- 31.Craft ME, Volz E, Packer C, Meyers LA. 2011. Disease transmission in territorial populations: the small-world network of Serengeti lions. J. R. Soc. Interface 8, 776–786. ( 10.1098/rsif.2010.0511) [DOI] [PMC free article] [PubMed] [Google Scholar]
- 32.Bull CM, Godfrey SS, Gordon DM. 2012. Social networks and the spread of Salmonella in a sleepy lizard population. Mol. Ecol. 21, 4386–4392. ( 10.1111/j.1365-294X.2012.05653.x) [DOI] [PubMed] [Google Scholar]
- 33.Porphyre T, McKenzie J, Stevenson MA. 2011. Contact patterns as a risk factor for bovine tuberculosis infection in a free-living adult brushtail possum Trichosurus vulpecula population. Prev. Vet. Med. 100, 221–230. ( 10.1016/j.prevetmed.2011.03.014) [DOI] [PubMed] [Google Scholar]
- 34.Christley RM, Pinchbeck GL, Bowers RG, Clancy D, French NP, Bennett R, Turner J. 2005. Infection in social networks: using network analysis to identify high-risk individuals. Am. J. Epidemiol. 162, 1024–1031. ( 10.1093/aje/kwi308) [DOI] [PubMed] [Google Scholar]
- 35.Hamede RK, Bashford J, McCallum H, Jones M. 2009. Contact networks in a wild Tasmanian devil (Sarcophilus harrisii) population: using social network analysis to reveal seasonal variability in social behaviour and its implications for transmission of devil facial tumour disease. Ecol. Lett. 12, 1147–1157. ( 10.1111/j.1461-0248.2009.01370.x) [DOI] [PubMed] [Google Scholar]
- 36.Böhm M, Hutchings MR, White PCL. 2009. Contact networks in a wildlife-livestock host community: identifying high-risk individuals in the transmission of bovine TB among badgers and cattle. PLoS ONE 4, e5016 ( 10.1371/journal.pone.0005016) [DOI] [PMC free article] [PubMed] [Google Scholar]
- 37.Rushmore J, Caillaud D, Matamba L, Stumpf RM, Borgatti SP, Altizer S. 2013. Social network analysis of wild chimpanzees provides insights for predicting infectious disease risk. J. Anim. Ecol. 82, 976–986. ( 10.1111/1365-2656.12088) [DOI] [PubMed] [Google Scholar]
- 38.Zohdy S, Kemp AD, Durden LA, Wright PC, Jernvall J. 2012. Mapping the social network: tracking lice in a wild primate (Microcebus rufus) population to infer social contacts and vector potential. BMC Ecol. 12, 4 ( 10.1186/1472-6785-12-4) [DOI] [PMC free article] [PubMed] [Google Scholar]
- 39.VanderWaal K, Atwill E, Hooper S, Buckle K, McCowan B. 2013. Network structure and prevalence of Cryptosporidium in Belding's ground squirrels. Behav. Ecol. Sociobiol. 67, 1951–1959. ( 10.1007/s00265-013-1602-x) [DOI] [Google Scholar]
- 40.Godfrey SS, Moore JA, Nelson NJ, Bull CM. 2010. Social network structure and parasite infection patterns in a territorial reptile, the tuatara (Sphenodon punctatus). Int. J. Parasitol. 40, 1575–1585. ( 10.1016/j.ijpara.2010.06.002) [DOI] [PubMed] [Google Scholar]
- 41.Brent LJN, Lehmann J, Ramos-Fernández G. 2011. Social network analysis in the study of nonhuman primates: a historical perspective. Am. J. Primatol. 73, 1–11. ( 10.1002/ajp.20949) [DOI] [PMC free article] [PubMed] [Google Scholar]
- 42.Ramos-Fernández G, Boyer D, Aureli F, Vick LG. 2009. Association networks in spider monkeys (Ateles geoffroyi). Behav. Ecol. Sociobiol. 63, 999–1013. ( 10.1007/s00265-009-0719-4) [DOI] [Google Scholar]
- 43.Aureli F, et al. 2008. Fission–fusion dynamics: new research frameworks. Curr. Anthropol. 49, 627–654. ( 10.1086/586708) [DOI] [Google Scholar]
- 44.Manlove KR, Cassirer EF, Cross PC, Plowright RK, Hudson PJ. 2014. Costs and benefits of group living with disease: a case study of pneumonia in bighorn lambs (Ovis canadensis). Proc. R. Soc. B 281, 20142331 ( 10.1098/rspb.2014.2331) [DOI] [PMC free article] [PubMed] [Google Scholar]
- 45.Nunn CL, Jordán F, McCabe CM, Verdolin JL, Fewell JH. 2015. Infectious disease and group size: more than just a numbers game. Phil. Trans. R. Soc. B 370, 20140111 ( 10.1098/rstb.2014.0111) [DOI] [PMC free article] [PubMed] [Google Scholar]
- 46.Anderson R. 2000. Nematode parasites of vertebrates: their development and transmission. Wallington, DC: CABI Publishing. [Google Scholar]
- 47.Loomis MR, Britt JO, Gendron AP, Holshuh HJ, Howard EB. 1983. Hepatic and gastric amebiasis in black and white colobus monkeys. J. Am. Vet. Med. Assoc. 183, 1188–1191. [PubMed] [Google Scholar]
- 48.Vitazkova S, Wade S. 2007. Effects of ecology on the gastrointestinal parasites of Alouatta pigra. Int. J. Primatol. 28, 1327–1343. ( 10.1007/s10764-007-9229-2) [DOI] [Google Scholar]
- 49.Pritchett KR, Johnston NA. 2002. A review of treatments for the eradication of pinworm infections from laboratory. J. Am. Assoc. Lab. Anim. Sci. 41, 36–46. [PubMed] [Google Scholar]
- 50.Link A, de Luna AG, Alfonso F, Giraldo-Beltran P, Ramirez F. 2010. Initial effects of fragmentation on the density of three neotropical primate species in two lowland forests of Colombia. Endanger. Species Res. 13, 41–50. ( 10.3354/esr00312) [DOI] [Google Scholar]
- 51.IDEAM. 2008. Instituto de hidrologia, meteorologia y estudios ambientales www.ideam.gov.co
- 52.Urbani B, Morales AL, Link A, Stevenson PR. 2008. Ateles hybridus. In The IUCN Red List of threatened species. Version 2010.1. International Union for Conservation of Nature.
- 53.Rimbach R, Link A, Montes-Rojas A, Di Fiore A, Heistermann M, Heymann EW. 2014. Behavioral and physiological responses to fruit availability of spider monkeys ranging in a small forest fragment. Am. J. Primatol. 76, 1049–1061. ( 10.1002/ajp.22292) [DOI] [PMC free article] [PubMed] [Google Scholar]
- 54.Armitage KB. 1962. Social behaviour of a colony of the yellow-bellied marmot (Marmota flaviventris). Anim. Behav. 10, 319–331. ( 10.1016/0003-3472(62)90055-6) [DOI] [Google Scholar]
- 55.Gillespie TR. 2006. Noninvasive assessment of gastrointestinal parasite infections in free-ranging primates. Int. J. Primatol. 27, 1129–1143. ( 10.1007/s10764-006-9064-x) [DOI] [Google Scholar]
- 56.Ramos-Fernández G. 2005. Vocal communication in a fission–fusion society: do spider monkeys stay in touch with close associates? Int. J. Primatol. 26, 1077–1092. ( 10.1007/s10764-005-6459-z) [DOI] [Google Scholar]
- 57.Whitehead H. 2008. Analyzing animal societies: quantitative methods for vertebrate social analysis. Chicago, IL: University of Chicago Press. [Google Scholar]
- 58.Whitehead Dufault SH. 1999. Techniques for analyzing vertebrate social structure using identified individuals: review and recommendations. Adv. Study Behav. 28, 33–74. ( 10.1016/S0065-3454(08)60215-6) [DOI] [Google Scholar]
- 59.Carter KD, Brand R, Carter JK, Shorrocks B, Goldizen AW. 2013. Social networks, long-term associations and age-related sociability of wild giraffes. Anim. Behav. 86, 901–910. ( 10.1016/j.anbehav.2013.08.002) [DOI] [Google Scholar]
- 60.Whitehead H, Bejder L, Ottensmeyer CA. 2005. Testing association patterns: issues arising and extensions. Anim. Behav. 69, e1–e6. ( 10.1016/j.anbehav.2004.11.004) [DOI] [Google Scholar]
- 61.Croft DP, James R, Krause J. 2008. Exploring animal social networks. Princeton, NJ: Princeton University Press. [Google Scholar]
- 62.Bejder Fletcher D, Bräger SL. 1998. A method for testing association patterns of social animals. Anim. Behav. 56, 719–725. ( 10.1006/anbe.1998.0802) [DOI] [PubMed] [Google Scholar]
- 63.R Development Core Team. 2014. R: A language and environment for statistical computing. Vienna, Austria: R Foundation for Statistical Computing. [Google Scholar]
- 64.Kappeler PM, Cremer S, Nunn CL. 2015. Sociality and health: impacts of sociality on disease susceptibility and transmission in animal and human societies. Phil. Trans. R. Soc. B 370, 20140116 ( 10.1098/rstb.2014.0116) [DOI] [PMC free article] [PubMed] [Google Scholar]
- 65.Schino G. 2001. Grooming, competition and social rank among female primates: a meta-analysis. Anim. Behav. 62, 265–271. ( 10.1006/anbe.2001.1750) [DOI] [Google Scholar]
- 66.Kutsukake N, Clutton-Brock TH. 2010. Grooming and the value of social relationships in cooperatively breeding meerkats. Anim. Behav. 79, 271–279. ( 10.1016/j.anbehav.2009.10.014) [DOI] [Google Scholar]
- 67.Steiner AL. 1973. Self- and allo-grooming behavior in some ground squirrels (Sciuridae), a descriptive study. Can. J. Zool. 51, 151–161. ( 10.1139/z73-023) [DOI] [Google Scholar]
- 68.Muehlenbein MP. 2006. Intestinal parasite infections and fecal steroid levels in wild chimpanzees. Am. J. Phys. Anthropol. 130, 546–550. ( 10.1002/ajpa.20391) [DOI] [PubMed] [Google Scholar]
- 69.Fedigan LM, Baxter MJ. 1984. Sex differences and social organization in free-ranging spider monkeys (Ateles geoffroyi). Primates 25, 279–294. ( 10.1007/BF02382267) [DOI] [Google Scholar]
- 70.Slater KY, Schaffner CM, Aureli F. 2009. Sex differences in the social behavior of wild spider monkeys (Ateles geoffroyi yucatanensis). Am. J. Primatol. 71, 21–29. ( 10.1002/ajp.20618) [DOI] [PubMed] [Google Scholar]
- 71.Asensio N, Korstjens AH, Schaffner CM, Aureli F. 2008. Intragroup aggression, fission–fusion dynamics and feeding competition in spider monkeys. Behaviour 145, 983–1001. ( 10.1163/156853908784089234) [DOI] [Google Scholar]
- 72.Lloyd-Smith JO, Schreiber SJ, Kopp PE, Getz WM. 2005. Superspreading and the effect of individual variation on disease emergence. Nature 438, 355–359. ( 10.1038/nature04153) [DOI] [PMC free article] [PubMed] [Google Scholar]
- 73.Woolhouse MEJ, et al. 1997. Heterogeneities in the transmission of infectious agents: implications for the design of control programs. Proc. Natl Acad. Sci. USA 94, 338–342. ( 10.1073/pnas.94.1.338) [DOI] [PMC free article] [PubMed] [Google Scholar]
- 74.Chapman CA, Wrangham RW, Chapman LJ. 1995. Ecological constraints on group size: an analysis of spider monkey and chimpanzee subgroups. Behav. Ecol. Sociobiol. 36, 59–70. ( 10.1007/BF00175729) [DOI] [Google Scholar]
- 75.Symington MM. 1990. Fission–fusion social organization in Ateles and Pan. Int. J. Primatol. 11, 47–61. ( 10.1007/BF02193695) [DOI] [Google Scholar]
- 76.Di Fiore A, Campbell CJ. 2007. The atelines: variation in ecology, behavior, and social organization. In Primates in perspective (eds Campbell CJ, Fuentes A, MacKinnon KC, Panger M, Bearder SK.), pp. 155–185. New York, NY: Oxford University Press. [Google Scholar]
- 77.Nishida T, Hiraiwa-Hasegawa M. 1987. Chimpanzees and bonobos: cooperative relationships among males. In Primate Societies (eds Smuts BB, Cheney DL, Seyfarth RM, Wrangham RW, Struhsaker TT.), pp. 165–180. Chicago, IL: The University of Chicago Press. [Google Scholar]
- 78.Wrangham RW. 1986. Ecology and social relationships in two species of chimpanzees. In Ecological aspects of social evolution (eds Rubenstein D, Wrangham R.), pp. 352–378. Princeton, NJ: Princeton University Press. [Google Scholar]
Associated Data
This section collects any data citations, data availability statements, or supplementary materials included in this article.
Supplementary Materials
Data Availability Statement
The datasets supporting this article have been uploaded as part of the electronic supplementary material.