



Abstract
Background
Longitudinal associations between the aminoterminal pro B-type natriuretic peptide (NT-proBNP) and incident hypertension are lacking.
Methods
We tested associations between baseline NT-proBNP (bNT-proBNP) and also change in NT-proBNP (ΔNT-proBNP) (visit 3 NT-proBNP – bNT-proBNP; 3.2 years apart) with incident hypertension (systolic blood pressure ≥140 and/or diastolic BP ≥90 mmHg or taking anti-hypertensive medications). Incident hypertension was evaluated in 5596 individuals in the Multi-Ethnic Study of Atherosclerosis (MESA) without hypertension at baseline (53% females, age range 45 – 84 years without overt cardiovascular disease) and followup for 9.5 years and in a subgroup (1550) who had bNT-proBNP <100 pg/mL and no hypertension at visit 3. Incident hypertension was regressed (proportional hazards) on quintiles of bNT-proBNP (range) 1) reference <19.2, 2) 19.3 – 40.8, 3) 40.9 – 70.9, 4) 71 – 135.2 and 5) >135.5 and also on ΔNT-proBNP categories (reference < −10, −10 — 10, >10 — 50 and >50 pg/mL). Hazard ratios (HRs) were adjusted for age, race, sex, education, diabetes, obesity, LV mass/height, SBP and DBP, IL-6, salt intake, estimated glomerular filtration rate and exercise.
Results
Compared to the reference category, HRs (95% CI) for incident hypertension compared to the first quintile of bNT-proBNP were 1.47 (1.13–1.93), 1.57 (1.18–2.09), 1.52 (1.12–2.06) and 2.36 (1.62–3.41). HRs for incident hypertension by categories of ΔNT-proBNP from 3.2 to 9.5 years followup were 0.98 (0.62 – 1.56), 1.13 (0.72 – 1.79) and 1.82 (1.07 – 3.12).
Conclusion
The development of hypertension tended to be preceded by elevated levels of bNT-proBNP or a substantial positive ΔNT-proBNP.
Keywords: hypertension, incidence, NT-proBNP, change in NT-proBNP, subclinical atherosclerosis, risk factor
Introduction
Cross-sectional reports have shown a positive association between B-type natriuretic peptide (BNP) and blood pressure in both normotensive and hypertensive individuals [1, 2]. Conversely, the cross-sectional Olmsted County Study [3] found that pre-hypertensive individuals had lower BNP and also lower levels of the biologically inactive amino terminal-pro B-type natriuretic peptide (NT-proBNP) than normotensive or hypertensive subjects. This U-shaped relationship between NT-proBNP and blood pressure categories suggested that low NT-proBNP could be predictive of higher blood pressure values and the development of future hypertension. However, the Framingham Heart Study demonstrated a positive association between BNP and progression of blood pressure in men, but not in women [4], inconsistent with this hypothesis.
Furthermore, BNP was not associated with incident hypertension in either the Jackson Heart Study [5] or the Framingham Heart Study over a followup period of 3 and 5 years, respectively [4]. In the Multi-Ethnic Study of Atherosclerosis (MESA), participants free of overt cardiovascular disease at baseline were followed for 10 years and NT-proBNP was measured at baseline and at visit 3 (3.2 years later). The longer followup time and the use of NT-proBNP, which is more stable and has a longer half-life than BNP [6], by the MESA study, may provide a more optimal setting to predict future hypertension. Therefore, MESA provides an opportunity to test the longitudinal association between baseline levels and change in NT-proBNP (ΔNT-proBNP) with the development of hypertension.
We hypothesized that prehypertensive individuals have lower NT-proBNP values than normotensives cross-sectionally at baseline, as was observed by Macheret et al. [3]. Further, we hypothesized a U-shaped relationship between baseline NT-proBNP and incident hypertension in normotensives, where low and high NT-proBNP levels increase the risk of future hypertension and intermediate values are neutral or protective against the development of future hypertension. We also predicted that in those individuals with NT-proBNP within the physiological range (<100 pg/mL) [7] both a large negative and a large positive ΔNT-proBNP associate with incident hypertension, while intermediate changes do not.
Methods
Study sample
MESA was designed to understand subclinical cardiovascular disease and its progression in a multiethnic cohort [8]. Between July 2000 and August 2002, 6814 men and women of white, black, Hispanic or Chinese race/ethnicity, who were 45–85 years of age and free of overt cardiovascular disease, were recruited from portions of 6 US communities. Table 1 describes the number of participants by followup time. Cross-sectional analysis included 5596 participants with measured NT-proBNP at baseline with and without hypertension. Longitudinal analysis included only those individuals without hypertension at baseline and with measured NT-proBNP (n = 2925). Further subanalysis on this latter group was performed on those with measured NT-proBNP at visit 1 and 3, with baseline NT-proBNP <100 pg/mL and without hypertension at visit 1 (n = 1980) and then in those without hypertension at visit 3 (n= 1555), Table 1. Clinical examinations occurred at baseline and at visit 2–5, on average 1.6, 3.2, 4.8 and 9.5 years later. The institutional review boards at all participating centers approved the study and written informed consent was obtained from every participant before data collection.
Table 1.
Description and number of participants by followup time from the MESA study cohort.
| Followup time | n | Blood pressure category excluded | NT-proBNP measured | NT-proBNP values included |
|---|---|---|---|---|
| Cross sectional | 5596 | None | Visit 1 | All values |
| Visit 1 to visit 5 (9.5 years) | 2925 | Hypertensive at baseline | Visit 1 | All values |
| Visit 1 to visit 3 (3.2 years) | 1980 | Hypertensive at baseline | Visit 1 and 3 | < 100 pg/mL at baseline |
| Visit 3 to visit 5 (6.3 years) | 1555 | Hypertensive at or before visit 3 | Visit 1 and 3 | < 100 pg/mL at baseline |
From an initial cohort of 6814 men and women without overt cardiovascular disease. Value of NT-proBNP < 100 pg/mL reflects a value that does not represent an increased risk of cardiovascular disease.
Laboratory Measures and Data Collection
Resting seated heart rate and blood pressure was measured 3 times using a Dinamap model pro 100 automated oscillometer (Critikon, Tampa, FL) at each visit. The last two measurements were averaged for analysis. In baseline cross-sectional analyses, blood pressure was defined hierarchically by Joint National Committee on Prevention, Detection, Evaluation and Treatment of High Blood pressure (JNC7) [9] categories: <110/75 (reference), 110 – 119/75 – 79, 120 – 129/80 – 84, 130 – 139/85 – 89 (pre-hypertension), or ≥140/90 mmHg (all untreated) or treated with antihypertensive medication, regardless of blood pressure.
All participants self-reported age, sex and race/ethnicity, highest education, daily physical activity (MET-min/week), and medical and dietary histories. Medication containers were examined at each examination for medication inventory. Height and weight were measured wearing light clothing and no shoes. Body mass index (BMI) was weight (kg)/height2 (meters). Obesity was defined as BMI ≥30 kg/m2.
Blood samples were drawn following an 8 hour fast and sent to central laboratories at the Universities of Vermont (Burlington, VT) and Minnesota (Minneapolis, MN). Serum glucose was measured by the Vitros analyzer (Johnson & Johnson Clinical Diagnostics, Rochester, New York). Serum NT-proBNP was measured at the VA San Diego Health Care System using an ElecSys 2010 analyzer (Roche Diagnostics, Indianapolis, IN) with intra-assay and interassay coefficients of variation of 1.3% and 4.8%, respectively [10]. Serum creatinine levels were used to estimate glomerular filtration rate (eGFR) using the Chronic Kidney Disease Epidemiology Collaboration formula (CKD-EPI) formula [11]. IL-6 was measured by ultrasensitive enzyme-linked immunosorbent assay (Quantikine HS human IL-6 immunoassay; R&D Systems, Minneapolis, Minnesota) and highly sensitive C-reactive protein (hsCRP) was determined using the BNII nephelometer (N High Sensitivity CRP, Dade Behring Inc, Deerfield, IL).
Definition of hypertension, metabolic syndrome and diabetes
Incident hypertension was systolic blood pressure ≥ 140 mm Hg or diastolic ≥ 90 mm Hg or antihypertensive medication use ever during followup among people initially free of hypertension. Diabetes was defined as fasting glucose ≥126 mg/dL (≥7 mmol) or history of diabetic medication. Metabolic syndrome was defined according to the Adult Treatment Panel III report [12].
Subclinical disease and imaging protocols
Subclinical CVD was defined by the presence of carotid plaque, left ventricular hypertrophy or coronary artery calcium >0. Carotid plaque was defined as a more than 25% diameter narrowing estimated from Doppler recordings of peak-systolic velocities [13]. Coronary artery calcium (CAC) was determined with electron beam or multi-detector computed tomography (CT) [14]. Left ventricular mass was determined using cardiac MR images [15] and left ventricular hypertrophy (LVH) defined as a left ventricular mass corrected by height above the 95th percentiles by gender; 52 and 49 g/m for males and females, respectively. Left ventricular diastolic wall distensibility (DWD), larger values of which DWD indicate more distensible ventricles, was estimated from left ventricular wall thickness at end systole and end diastole measured using cardiac MRI, determined at 6 different segments averaged across 3 cross sectional slices acquired at the base, middle and apex of the left ventricle (LV), as [16]
where ESWT indicates end systolic wall thickness and EDWT indicates end diastolic wall thickness. DWD indicates the reduction in left ventricular wall thickness during diastole as a fraction of the left ventricular wall thickness during systole.
Statistical analysis
NT-proBNP was log transformed; the mean transform was exponentiated to estimate the geometric mean. Change (visit 3 – baseline) in NT-proBNP (ΔNT-proBNP) was expressed as the median (range) in its natural scale.
Linear regression analyses assessed the cross-sectional association between NT-proBNP and blood pressure categories, with adjustment in model 1 for age, sex and race, and in model 2 adding highest education achieved, diabetes, obesity (BMI > 30 kg/m2), baseline systolic and diastolic blood pressures, left ventricular mass/height, use of added table salt, eGFR, IL-6, and total intentional exercise (MET-min/week). NT-proBNP was used as the dependent variable to replicate the prior analysis 6, which showed lower NT-proBNP in individuals with pre-hypertension.
In the prospective analysis, Cox proportional hazards models estimated hazard ratios (HRs) for incident hypertension regressed on quintiles of baseline NT-proBNP in individuals without baseline hypertension.
Hazard ratios (HRs) for incident hypertension were also regressed on ΔNT-proBNP for individuals with baseline NT-proBNP <100 pg/mL; based on the following prediction categories of ΔNT-proBNP: <−10, −10 – 9.99, 10 – 50 and ≥ 50 pg/mL. The median value of ΔNT-proBNP was 10 pg/mL, which we used as a cutoff to select categories of no substantial ΔNT-proBNP (−10 to <10 pg/mL), large decrease <−10 pg/mL, an intermediate category ≥10 and <50 pg/mL, and an upper category ≥50 pg/mL, representing those with ΔNT-proBNP above the third quartile. Given non-linear associations, categories rather than continuous NT-proBNP were used to flexibly describe the shape of association and test the hypothesis that low levels of NT-proBNP were associated with incident hypertension. Linear and quadratic associations regressing incident hypertension on baseline NT-proBNP or ΔNT-proBNP as continuous variables were also performed.
HRs for incident hypertension regressed on ΔNT-proBNP were evaluated during two time periods. The first time period was concurrent with NT-proBNP change, i.e., baseline to visit 3 (3.2 years) incidence regressed on ΔNT-proBNP, excluding baseline hypertensives. The second period was prospective, i.e., incidence starting at visit 3 to visit 5 (6.5 years), regressed on ΔNT-proBNP (baseline to visit 3), excluding visit 3 hypertensives. HRs were adjusted as in model 1 and model 2. Significance was set at p<0.05. Statistical analysis used PC-SAS version 9.3 by SAS Institute Inc., Cary, NC.
Results
Baseline characteristics
Table 2 shows baseline characteristics by blood pressure categories. NT-proBNP adjusted for age, race and gender was greater in those with hypertension, 59.8 pg/mL (95% CI: 57.6, 62.2) at baseline than in those without, 43.6 pg/mL (95%CI: 42.0, 45.2), p <0.0001. Compared to individuals in the optimal BP category, the proportion of males, blacks, obese and diabetics was higher in the pre-hypertensive category, (p <0.0001). Age, heart rate, height corrected left ventricular end diastolic volume and left ventricular mass and IL-6 increased as a function of blood pressure categories (p <0.0001), while eGFR decreased (p <0.0001). Individuals in the high BP category were more likely to be current smokers, on cholesterol lowering medications and diabetic. Physical activity and added salt table was not different by BP categories, p = 0.2.
Table 2.
Demographic characteristics of 5596 individuals by blood pressure categories at baseline in the Multi-Ethnic Study of Atherosclerosis.
| 5596 | Blood pressure categories (mmHg)
|
p | ||||||
|---|---|---|---|---|---|---|---|---|
| <110/75 | <120/80 | <130/85 | <140/90 | >=140/90 | HBP med | |||
| 1079 | 890 | 629 | 524 | 650 | 1824 | |||
|
| ||||||||
| NT-proBNP, pg/mL, Median (Range) | 43.7 (4.9– 1632) | 39.3 (4.9– 1545) | 42.4 (4.9– 1274) | 52.6 (4.9– 1832) | 76.7 (4.9– 3460) | 69.2 (4.9– 11699) | ||
| Age, years | 56.5 (0.3) | 59.2 (0.3) | 61.2 (0.4) | 63.9 (0.4) | 66.8 (0.4) | 66.5 (0.2) | < 0.0001 | |
| Female % | 52.8 | 60.8 | 44.7 | 40.5 | 47.3 | 47.1 | 52.7 | <0.0001 |
| Race | <0.0001 | |||||||
| White, % | 39.2 | 44.2 | 41.6 | 39.5 | 37.0 | 34.8 | 36.2 | |
| Black, % | 26.3 | 11.7 | 18.4 | 18.6 | 23.4 | 24.0 | 29.7 | |
| Chinese,% | 12.2 | 19.9 | 16.9 | 13.3 | 14.2 | 15.4 | 12.4 | |
| Hispanic, % | 22.4 | 24.1 | 23.0 | 28.7 | 25.4 | 25.8 | 21.8 | |
| Smokers, % | 12.5 | 16.8 | 12.6 | 16.4 | 12.3 | 10.4 | 10.0 | <0.0001 |
| Statin use, % | 14.8 | 8.2 | 9.2 | 7.9 | 10.7 | 9.9 | 24.7 | <0.0001 |
| Diabetes, % | 12.5 | 4.1 | 8.4 | 8.2 | 8.2 | 10.0 | 21.2 | <0.0001 |
| Obese, % | 28 | 13.7 | 21.9 | 31.3 | 27.9 | 29.4 | 35 | < 0.0001 |
| Education level, % | 81.3 | 85.7 | 83.3 | 82.0 | 81.1 | 77.2 | 79.0 | 0.02 |
| Heart rate, bpm | 61.5 (0.3) | 63.5 (0.36) | 65 (0.4) | 65.6 (0.5) | 66 (0.4) | 64.8 (0.2) | < 0.0001 | |
| LV end diastolic volume, mL | 120.3 (1) | 124.2 (1.1) | 124.5 (1.3) | 127.5 (1.4) | 129.5 (1.3) | 130.6 (0.7) | < 0.0001 | |
| LV mass/height, g/cm | 32.7 (0.3) | 34.1 (0.3) | 35.7 (0.3) | 36.8 (0.4) | 39.3 (0.4) | 39.0 (0.2) | < 0.0001 | |
| Added table salt, % | 20.7 | 22.7 | 22.5 | 20.7 | 19.3 | 13.2 | < 0.0001 | |
| IL-6, pg/mL | 1.40 (0.04) | 1.44 (0.04) | 1.46 (0.05) | 1.56 (0.05) | 1.59 (0.05) | 1.70 (0.03) | < 0.0001 | |
| eGFR, mL/min | 78.7 (0.5) | 78.4 (0.5) | 79.7 (0.6) | 79.8 (0.6) | 78.8 (0.6) | 76.0 (0.3) | < 0.0001 | |
| Physical activity, MET- min/week | 1665 (75) | 1588 (80) | 1553 (94) | 1637 (101) | 1388 (92) | 1501 (51) | 0.2 | |
Mean (SE) values adjusted for age, race and gender (except when age, race or gender was the dependent variable). Blood pressure categories defined according to the Joint National Committee on Prevention, Detection, Evaluation and Treatment of High Blood pressure (JNC7). High Blood Pressure (HBP) Med = individuals on antihypertensive medications. Smokers = percent of current smokers. Statin use = percent of individuals on statin medication. Education = % who finished high school or higher. Obese = body mass index ≥ 30 kg/m2, bpm = beats per minute, LV = left ventricle, Added table salt = % of individuals that added salt often or always. IL-6 = interleukin-6. eGFR = estimated glomerular filtration rate according to the Chronic Kidney Disease Epidemiology Collaboration (CKD-EPI) equation, IL-6 = Interleukin 6. MET = metabolic equivalent units.
Among those without baseline hypertension (Table 3), individuals with higher NT-proBNP tended to be female, white, older, nonsmokers and thinner, and to have subclinical cardiovascular disease, and higher IL-6 (Table 3). There was no difference in systolic blood pressure across quintiles and diastolic blood pressure was lower at the highest quintile of NT-proBNP. However, in hypertensive individuals diastolic blood pressure was not associated with baseline NT-proBNP, data not shown. It is important to notice that the prevalence of metabolic syndrome and diabetes were greatest in the lowest quintile of NT-proBNP.
Table 3.
General characteristics of 2925 participants without hypertension by quintiles of NT-proBNP level at baseline.
| Quintiles of baseline NT-proBNP
|
p | |||||
|---|---|---|---|---|---|---|
| pg/mL, median (range) | 8.6 (4.9 – 19.2) | 28.9 (19.3 – 40.8) | 53.7 (40.9 – 70.9) | 95.4 (71 – 135.2) | 213.9 (135.5 – 1832) | |
| n | 770 | 676 | 598 | 537 | 344 | |
| Age, years | 53.9 (0.3) | 57.7 (0.3) | 60.6 (0.4) | 63.3 (0.4) | 67.8 (0.5) | <0.0001 |
| Females, % | 26.6 | 43.2 | 59.5 | 69.3 | 71.2 | <0.0001 |
| Race | <0.0001 | |||||
| White, % | 25.1 | 41.1 | 45.3 | 52.5 | 61.3 | |
| Black, % | 27.5 | 18.8 | 15.6 | 12.3 | 11.3 | |
| Chinese,% | 20.5 | 13.8 | 15.9 | 13.4 | 7.6 | |
| Hispanic, % | 26.9 | 26.3 | 23.2 | 21.8 | 19.8 | |
| Smokers, % | 18.2 | 14.9 | 13.6 | 12.7 | 12.2 | 0.02 |
| Metabolic syndrome, % | 23.1 | 24.3 | 19.3 | 19.7 | 17.2 | 0.03 |
| Diabetes, % | 9 | 8.3 | 4.4 | 5.0 | 6.4 | 0.002 |
| Education level, % | 83.4 | 84.3 | 84.0 | 81.6 | 82.9 | 0.8 |
| Obesity, % | 31.0 | 26.9 | 21.9 | 19.4 | 18.3 | <0.0001 |
| LVH, % | 1.0 | 2.3 | 1.3 | 1.22 | 4.7 | 0.002 |
| Carotid plaque, % | 26.2 | 31.0 | 31.1 | 36.0 | 40.2 | <0.0001 |
| CAC >0, % | 33.6 | 38.3 | 40.3 | 43.4 | 52.9 | <0.0001 |
| SBP, mmHg | 115.0 (0.5) | 115.0 (0.5) | 115.0 (0.5) | 114.5 (0.6) | 114.7 (0.7) | 1.0 |
| DBP, mmHg | 69.7 (0.3) | 69.8 (0.3) | 69.2 (0.3) | 68 (0.4) | 66.4 (0.5) | <0.0001 |
| Added table salt, % | 21.4 | 20.5 | 21.1 | 24.0 | 19.9 | 0.3 |
| HOMA-IR | 3.26 (0.30) | 2.56 (0.29) | 1.96 (0.31) | 1.73 (0.34) | 1.55 (0.44) | 0.006 |
| IL-6, pg/mL | 1.34 (0.04) | 1.36 (0.04) | 1.31 (0.05) | 1.46 (0.05) | 1.67 (0.06) | <0.0001 |
| eGFR, ml/min | 80.8 (0.5) | 81.2 (0.5) | 82.2 (0.5) | 81.7 (0.6) | 81.6 (0.7) | 0.4 |
| Physical activity, MET-min/wk | 1584 (91.2) | 1538 (88.9) | 1611 (94.3) | 1757 (102.6) | 1746 (132.3) | 0.5 |
NT-proBNP values are median (range). Values are mean (SE) adjusted for age (except when age was the dependent variable), race and gender. Obesity = body mass index > 30 kg/m2, LVH = left ventricular hypertrophy define as g/m >95th percentile, 52 and 49 g/m for males and females, respectively, Carotid plaque = a more than 25% diameter narrowing, CAC = coronary artery calcium Agatston score > 0, SBP = systolic blood pressure, DBP = diastolic blood pressure, Added table salt = % of individuals that added salt often or always. Education = finished high school or higher. Homeostatic model assessment insulin resistance (HOMA-IR). eGFR = glomerular filtration rate according to the Chronic Kidney Disease Epidemiology Collaboration (CKD-EPI) equation, IL-6 = Interleukin 6, MET = metabolic equivalent units minutes/week.
Figure 1 shows the nonlinear cross-sectional association between the adjusted NT-proBNP levels as a dependent variable and blood pressure categories. NT-proBNP levels adjusted for model 1 and 2 were ~12% lower in the pre-hypertensive category than in those individuals with optimal blood pressure (<110/75 mmHg), p <0.02. Furthermore, NT-proBNP levels adjusted for model 1 and 2 in individuals with hypertension were higher than those in the optimal and the pre-hypertensive category, p < 0.0001. NT-proBNP followed a quadratic association with BP categories, (p value < 0.0003).
Figure 1.
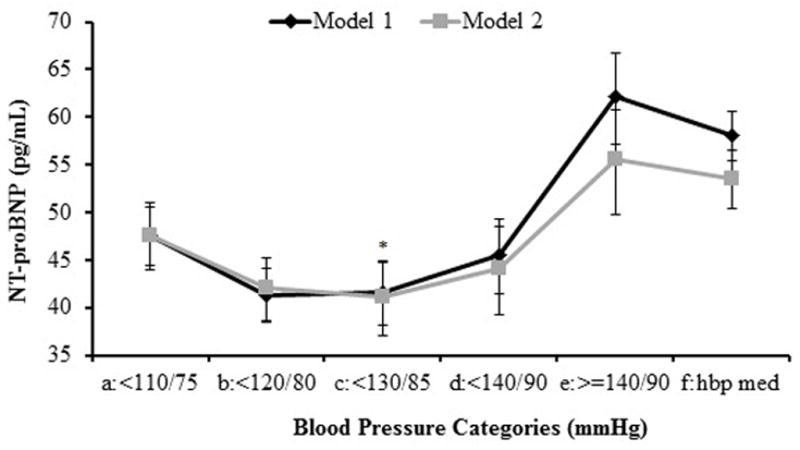
Cross-sectional analysis at baseline. Dip in NT-proBNP levels observed in pre-hypertensive BP categories.
Values are back transformed geometric means ± 95% CI. Model 1 adjusted for age, race and gender. Model 2 = model 1 + highest level of education, presence of diabetes, presence of obesity (BMI > 30 kg/m2), left ventricular end diastolic volume, heart rate categories < or > then 60 beats per minute, left ventricular mass/height, add table salt, estimated glomerular filtration rate, IL-6, and total intentional exercise in MET-min/week. * indicates that NT-proBNP is lower in category c than in categories a, b, d and e for both model 1 and 2, p < 0.02.
Figure 2 shows a quadratic association between NT-proBNP and left ventricular DWD adjusted for age, race and sex, p < 0.0001, (n= 3747). Left ventricular DWD had a positive association with cardiac index and with ejection fraction showing linear coefficients (SE) of 0.04 (0.001) and 0.006 (0.0001) p <0.0001, respectively. These data suggest that higher DWD values are related to better LV function and lower levels may indicate diastolic dysfunction.
Figure 2.

NT-proBNP values as a function of left ventricular diastolic wall distensibility.
NT-proBNP values are back transformed geometric means ± 95% CI. Quadratic model adjusted for age, race and sex, p < 0.0001.
Baseline NT-proBNP and incident hypertension
Incident hypertension over 9.5 years of followup occurred in 41.2% (n=1206/2925). HRs for incident hypertension adjusted for age, race and sex increased by 25% between the first and second quintile, but did not further increase substantially until NT-proBNP reach values >135 pg/mL (Figure 3). These association were strengthened with additional adjustment (model 2), with small but significant increases in risk of incident hypertension when NT-proBNP values were between 19 and 135 pg/mL and substantial increase in HRs at NT-proBNP values >135 pg/mL (Figure 3). Using NT-proBNP as a continuous variable, HRs increased by 0.25 (0.05) for every SD increase in NT-proBNP (model 1), p < 0.0001 and HRs increased by 0.27 (0.08) for every SD increase in NT-proBNP (model 2), p = 0.0007. Quadratic associations were not significant (data not shown). Adding hsCRP to model 2 or restricting to prehypertensives (data not shown) did not substantially alter these findings. In addition, further adjusting model 2 for carotid plaque and CAC >0 did not substantially change the HRs for incident hypertension. No interaction was seen with metabolic syndrome, obesity or diabetes (data not shown).
Figure 3.

Hazard ratios for incident hypertension according to quintiles of NT-proBNP concentrations. Prospective analysis using baseline NT-proBNP and any incident high blood pressure at exams 2–5 (9.7 yr followup), N=2925.
Hazard ratios ± 95% CI. Models 1 and 2 covariates are described in Methods and in the footnote to Table 2. Bar represents the hazard ratio reference line. p values for trend for linear associations regressed on NT-proBNP as a continuous variable for model 1 < 0.0001 and model 2 = 0.0007. Quadratic associations were not significant.
Although no significant interactions with demographic variables were observed between baseline NT-proBNP and hypertension, the distribution of individuals by gender, race and age category varied markedly among quintiles of NT-proBNP. Therefore we examined the association of baseline NT-proBNP with incident hypertension in demographic subgroups to see whether they were consistent with the overall analysis shown in Figure 3. HRs for incident hypertension over 9.5 years of followup regressed on baseline NT-proBNP ≥135.5 vs <19.2 pg/mL were more variable than in the overall analysis (consistent with reduced sample sizes) but were consistent in direction with the overall analysis, ranging across demographics from 2.00 to 5.19 (Table 4) for age category <65 vs ≥ 65 years; for men vs women; and for whites, Hispanics, Chinese, and African Americans.
Table 4.
Hazard ratios for incident hypertension by categories of change (Δ) in NT-proBNP from baseline to visit 3 in 1980 individuals with NT-proBNP ≤ 100 pg/mL at baseline examination and in the subset of 1555 of these people who did not develop hypertension by visit 3.
| ΔNT-proBNP, pg/mL, median (range) | |||||
|---|---|---|---|---|---|
| −22.8 (−76.4 – −10.1) | 0.50 (−10 – 9.95) | 23.4 (10 – 49.9) | 73.8 (50.1 – 3750) | ||
|
| |||||
| Baseline NT-proBNP, pg/mL, median (25th percentile, 75th percentiles) | 56.8 (37.6 – 76.1) | 21.4 (8.1 – 40.6) | 27.5 (12.7 – 47.6) | 44.2 (21.9 – 63.4) | p for quadratic association |
| Incidence of hypertension | |||||
| Baseline to visit 3, n/N, (%) | 56/334 (17) | 116/662 (18) | 154/707 (22) | 99/277 (36) | |
| Model 1 (HR 95% CI) | 1 | 1.06 (0.77 – 1.47) | 1.28 (0.95 – 1.75) | 2.17 (1.57 – 3.04) | < 0.0001 |
| Model 2 (HR 95% CI) | 1 | 0.80 (0.5 – 1.29) | 1.07 (0.71 – 1.67) | 1.18 (0.73 – 1.94) | 0.7 |
| Visit 3 to visit 5, n/N, (%) | 60/278 (22) | 133/546 (24) | 158/553 (29) | 55/178 (31) | |
| Model 1 (HR 95% CI) | 1 | 1.06 (0.77 – 1.47) | 1.28 (0.95 – 1.75) | 2.17 (1.57 – 3.04) | 0.07 |
| Model 2 (HR 95% CI) | 1 | 0.98 (0.62 – 1.56) | 1.13 (0.72 – 1.79) | 1.82 (1.07 – 3.12) | 0.01 |
n/N indicates number of participants that developed hypertension/total number of participants in that category of ΔNT-proBNP, % is the proportion of participants that developed hypertension for that category of ΔNT-proBNP. Model 1 was adjusted for age, race and gender and model 2 = model 1 + highest level of education achieved, presence of diabetes and obesity based on BMI > 30 kg/m2, diastolic and systolic blood pressure, left ventricular mass/height, reported amount of added table salt, estimated glomerular filtration rate, IL-6 and total intentional weekly exercise. Baseline to visit 3 indicates follow-up of non-hypertensive individuals from baseline to visit 3 (3.2 years) concurrent with ΔNT-proBNP. Visit 3 to visit 5 follows non-hypertensive individuals at visit 3 up to visit 5 (6.3 years) for incidence of hypertension subsequent to ΔNT-proBNP.
ΔNT-proBNP and HRs for incident hypertension baseline to visit 3
In this time period, 21.5% (425/1980) hypertension-free participants with baseline NT-proBNP <100 pg/mL developed hypertension. Among these 1980 participants, 14% (n=277) of participants had ΔNT-proBNP ≥50 pg/mL, while 17% (n=334) had a negative change of −10.2 pg/mL or more. Incident hypertension was associated with change in NT-proBNP when adjusted for model 1. But when using the more extended model 2 neither linear nor quadratic fits were associated with incident hypertension, (Table 4).
ΔNT-proBNP and HRs for incident hypertension: visit 3 to visit 5
From visit 3 to visit 5, 26% (406/1555) of participants with baseline NT-proBNP <100 pg/mL and not hypertensive by visit 3 developed hypertension. HRs for incident hypertension increased over categories of ΔNT-proBNP (model 1) for those individuals not hypertensive at visit 3 and followed until visit 5 (6.3 years), p = 0.07. This association strengthened in model 2, where there was a 63% increase in the risk of future hypertension in those whose ΔNT-proBNP ≥50 pg/mL vs those who decreased by −10.2 pg/mL or more. Among the 1980 participants, those with ΔNT-proBNP ≥50 pg/mL, 38% (n=103/277) had carotid plaque and 43% (118/277) had CAC >0. These prevalences were higher than in those with ΔNT-proBNP of −10.2 pg/mL or more: 26% (n=86/331) had coronary plaque and 32% (106/335) had CAC >0. ΔNT-proBNP was unrelated to presence of LVH. Further adjusting model 2 for carotid plaque and CAC >0 did not substantially change the HRs for incident hypertension. A quadratic association was observed between ΔNT-proBNP and incident hypertension, but only when adjusting in model 2, p = 0.01 (Table 4).
HRs for incident hypertension over 6.3 years of followup after visit 3 regressed on ΔNT-proBNP ≥50 vs <−10 pg/mL were mostly consistent with the overall analysis. For age category <65 vs ≥ 65 years hazard ratios ranged from 1.99 to 1.51 (model 2 of Table 3). However, ΔNT-proBNP was associated with incident hypertension in women, but not in men (p=0.04). With regard to race, the association of ΔNT-proBNP with incident hypertension was not significantly different among the 4 race/ethnicity groups, although hazard ratios differed, consistent with substantially reduced samples sizes in each race/ethnic group.
Discussion
This study shows that NT-proBNP predicted hypertension over 9.5 years of followup, particularly among participants whose NT-proBNP was ≥135 pg/mL at baseline. Furthermore, restricting to hypertension-free individuals with baseline NT-proBNP levels not considered to significantly increase the risk of future CVD [17] or all-cause mortality [18] (i.e., <100 pg/mL) a ΔNT-proBNP ≥50 pg/mL over 3.2 years was associated with a 82% increased risk of incident hypertension in the following 6.3 years. Furthermore, the presence of carotid plaque and CAC >0 at baseline appeared to precede a substantial increase in NT-proBNP.
Lack of association between low levels of NT-proBNP and incident hypertension
Our cross-sectional findings agreed with the cross-sectional analysis by Macheret et al. [3] in which pre-hypertensive individuals had low NT-proBNP levels. The association between low NT-proBNP levels and incident hypertension had been postulated based on the observation that individuals with a mutation that raises BNP have less risk of developing hypertension than individuals without it [19]. In addition, the blood pressure lowering physiological functions of natriuretic peptides and successful treatment of an individual with resistant hypertension with subcutaneous BNP [20] supported the hypothesis that the contrary, low levels of NT-proBNP, could lead to hypertension. However, in our longitudinal analysis neither low baseline NT-proBNP (<19.3 pg/mL) nor a decrease in NT-proBNP (>−10 pg/mL) over 3.2 years predicted incident hypertension. In agreement with our findings, a BNP knockout mouse model did not have higher blood pressure values compared to wild type mice with normal BNP levels [21]. Although insulin resistance, metabolic syndrome and diabetes are more frequent at the lowest quintile of baseline NT-proBNP and these are risk factors for hypertension, our longitudinal findings do not support the concept that low NT-proBNP levels elevate the risk of incident hypertension.
Elevated baseline NT-proBNP and a substantial positive ΔNT-proBNP increase the risk of developing hypertension
The positive association between NT-proBNP and incident hypertension observed in our study extends the findings of the Jackson Heart Study [5] and the Framingham Study [4]. In the Jackson Heart Study, baseline BNP levels predicted blood pressure increase, but did not predict incident hypertension. Similarly, in Framingham, baseline BNP levels was associated with progression of blood pressure, but only in males. The longer follow-up time by our study and the use of NT-proBNP instead of BNP, are factors that can contribute to the difference in results between studies. In addition, these associations were generally consistent across different age categories, gender and racial and ethnic groups. It is important to note the small increase in hypertension risk below NT-proBNP 135 pg/mL. To this extent our findings agree with Macheret et al. [3], that when NT-proBNP is <135 pg/mL, natriuretic peptides seems to be able to maintain blood pressure values below hypertensive levels. However, at values >135 pg/mL, this capacity seems to be lost, leading to a progressive rise in blood pressure and the development of hypertension.
The 82% increase in the risk of incident hypertension preceded by a ΔNT-proBNP ≥50 pg/mL in people with NT-proBNP initially <100 pg/mL is a novel finding and highlights the notion that a substantial increase in NT-proBNP should be a risk factor to consider when predicting future hypertension. Eggers et al. [22] reported that in 70 year olds followed for 8 years, those who had a ΔNT-proBNP ≥100% of their baseline values had an increase in all cause and CVD mortality when compared to those who had less increase or a decrease in NT-proBNP [22]. In our study, the median baseline NT-proBNP value for individuals who had an increase of ≥50 pg/mL was 44 pg/mL and the median ΔNT-proBNP after that 3.2-year period was 73.8 pg/mL. Therefore, with an average yearly increase in NT-proBNP of ~23 pg/mL it would take close to 4 years for NT-proBNP to reach levels that would substantially increase the risk of future hypertension (i.e., ≥135 pg/mL) and to exceed the levels that are associated with an increased mortality in hypertensive subjects (>134 pg/mL) [18]. These findings indicate that a substantial ΔNT-proBNP (i.e., ≥ 23 pg/mL per year) would be an earlier marker for risk of hypertension than a single value.
Risk factors related to increases in NT-proBNP
A substantial rise in NT-proBNP could be due to the presence of left ventricular diastolic dysfunction as evidenced by the elevated levels of NT-proBNP in individuals with low levels of left ventricular DWD. Associations of NT-proBNP with IL-6 [23] and carotid plaque in individuals with NT-proBNP <100 pg/mL and no hypertension suggests that the rise in NT-proBNP may be preceded by the combined presence of left ventricular dysfunction and subclinical atherosclerosis along with an inflammatory process. In support of this hypothesis, we showed that the presence of carotid plaque and CAC at baseline was positively associated with an increase in NT-proBNP 3.2 years later. Furthermore, data from the MESA population showed that cIMT is positively associated with systolic and diastolic ventricular dysfunction [23], and cross sectionally CAC is positively associated with IL-6 [24] and both ventricular dysfunction and IL-6 can independently elevate NT-proBNP [25, 26]. Collectively, these data support our hypothesis that subclinical CVD and inflammation precede an increase in NT-proBNP.
Potential biological mechanisms for the association between NT-proBNP and the development of hypertension
These findings are in line with the notion that within a range (<100 pg/mL) variations in NT-proBNP reflect the physiological responses to regulate blood pressure. Instead, values ≥100 pg/mL reflects the influence of pathological process on the production of NT-proBNP [7]. In this regard, prolonged stimulation of natriuretic peptides synthesis can lead to: 1) chronically elevated natriuretic peptides blood levels, which may induce a state of desensitization of natriuretic peptide receptors [27, 28] and 2) alterations in the post-translational maturation process with the release of biologically inactive natriuretic peptides [29, 30]. Additionally, an increased clearance of natriuretic peptides, seen in obese individuals with hypertension can also impair the physiological effects of natriuretic peptides [31]. Interestingly, diastolic blood pressure is inversely associated with NT-proBNP, but only in non-hypertensive individuals. The fact that this association is not observed in hypertensive individuals suggests that the response to natriuretic peptides is different between hypertensives and non-hypertensive individuals. These combined or individual mechanisms can potentially impair the capacity of the renal and cardiovascular system to respond to volume and pressure loads, which could lead to the development of hypertension [32, 33].
Strength and limitations
A major strength of this study is the measurement of NT-proBNP at two different times in a large, well-characterized cohort of participants free of CVD at baseline and the long follow up time of nearly 10 years. One limitation is that BNP was not measured in our study. BNP and NT-proBNP are assumed to exist on an equimolar basis, but because they are cleared from circulation at different rates and through different mechanisms, the ratio BNP to NT-proBNP is different than 1 and should not be used interchangeably [34]. However, our results agree with other studies that have used only BNP. No substantial interactions with demographics were observed, although the small number of individuals at visit 3 free of hypertension and with NT-proBNP < 100 pg/mL does not allow us to state conclusively if the association between ΔNT-proBNP and incident hypertension follows similar patterns between gender and among race/ethnic groups.
Conclusions
Results from this analysis finds that elevated baseline levels (≥135 pg/mL) increased the risk of developing hypertension. In addition, in those with baseline NT-proBNP <100 pg/mL a substantial rise (≥23 pg/mL/year) in NT-proBNP was also predictive of incident hypertension. The substantial increase in the risk of developing hypertension only after NT-proBNP exceeds or changes above a certain rate is consistent with the presence of a threshold value above which NT-proBNP reflects the inability of natriuretic peptides to regulate blood pressure.
Acknowledgments
This research was supported by contracts N01-HC-95159 through N01-HC-95165, N01-HC-95169 grants R01-HL 66075, N01-HC-95168, N01-HC 9808, and N01-HC 95168 from the National Heart, Lung, and Blood Institute. The authors also thank the investigators and staff of the Multi-Ethnic Study of Atherosclerosis (MESA) for their valuable contributions. A full list of MESA investigators and institutions can be found at http://www.mesa-nhlbi.org/.
Footnotes
Disclosures
Otto A. Sanchez, no disclosures. Daniel Duprez MD, PhD consultant to Genentech, Novartis. Hossein Bahrami no disclosures. Lori B Daniels consultant to Singlulex, Critical Diagnostics and Alere, Inc. Joao A. Lima, consultant to Toshiba Medical Systems, Bracco. Alan Maisel, consultant to Alere, BG Medicine, Brahms, Critical Diagnostics, EFG diagnostics, Novartis, Abbott. Carmen A. Peralta, no disclosures. David R Jacobs, no disclosures.
Contributor Information
Otto A. Sanchez, Research Associate, School Public Health, Division of Epidemiology & Community Health, University of Minnesota.
David R. Jacobs, Jr, Mayo Professor of Public Health, School of Public Health, Division of Epidemiology & Community Health, University of Minnesota.
Hossein Bahrami, Cardiology Fellow, Stanford University.
Carmen A. Peralta, Assistant Professor in residence, School of Medicine, University of California San Francisco.
Lori B. Daniels, Associate Professor of Medicine, Division of Cardiology, University of California, San Diego.
João A. Lima, Professor of Medicine, Division of Cardiology, Johns Hopkins Bayview Medical Center.
Alan Maisel, Professor of Medicine, School of Medicine, University of California, San Diego.
Daniel A. Duprez, Professor of Medicine, Division of Cardiology, University of Minnesota.
References
- 1.Buckley MG, Markandu ND, Miller MA, Sagnella GA, MacGregor GA. Plasma concentrations and comparisons of brain and atrial natriuretic peptide in normal subjects and in patients with essential hypertension. Journal of Human Hypertension. 1993;7 (3):245–250. [PubMed] [Google Scholar]
- 2.Kohno M, Horio T, Yokokawa K, Murakawa K, Yasunari K, Akioka K, et al. Brain natriuretic peptide as a cardiac hormone in essential hypertension. Am J Med. 1992;92 (1):29–34. doi: 10.1016/0002-9343(92)90011-y. [DOI] [PubMed] [Google Scholar]
- 3.Macheret F, Heublein D, Costello-Boerrigter LC, Boerrigter G, McKie P, Bellavia D, et al. Human Hypertension Is Characterized by a Lack of Activation of the Antihypertensive Cardiac Hormones ANP and BNP. Journal of the American College of Cardiology. 2012;60 (16):1558–1565. doi: 10.1016/j.jacc.2012.05.049. [DOI] [PMC free article] [PubMed] [Google Scholar]
- 4.Freitag MH, Larson MG, Levy D, Benjamin EJ, Wang TJ, Leip EP, et al. Plasma brain natriuretic peptide levels and blood pressure tracking in the Framingham Heart Study. Hypertension. 2003;41 (4):978–983. doi: 10.1161/01.HYP.0000061116.20490.8D. [DOI] [PubMed] [Google Scholar]
- 5.Fox ER, Musani SK, Singh P, Bidulescu A, Nagarajarao HS, Samdarshi TE, et al. Association of plasma B-type natriuretic peptide concentrations with longitudinal blood pressure tracking in African Americans: findings from the Jackson Heart Study. Hypertension. 2013;61 (1):48–54. doi: 10.1161/HYPERTENSIONAHA.112.197657. [DOI] [PMC free article] [PubMed] [Google Scholar]
- 6.Clerico A, Vittorini S, Passino C. Measurement of the pro-hormone of brain type natriuretic peptide (proBNP): methodological considerations and pathophysiological relevance. Clin Chem Lab Med. 2011;49 (12):1949–1954. doi: 10.1515/CCLM.2011.686. [DOI] [PubMed] [Google Scholar]
- 7.Sanchez OA, Duprez DA, Bahrami H, Daniels LB, Folsom AR, Lima JA, et al. The associations between metabolic variables and NT-proBNP are blunted at pathological ranges: the Multi-Ethnic Study of Atherosclerosis. Metabolism. 2014;63 (4):475–483. doi: 10.1016/j.metabol.2013.11.017. [DOI] [PMC free article] [PubMed] [Google Scholar]
- 8.Wang TJ, Larson MG, Levy D, Benjamin EJ, Leip EP, Wilson PW, et al. Impact of obesity on plasma natriuretic peptide levels. Circulation. 2004;109 (5):594–600. doi: 10.1161/01.CIR.0000112582.16683.EA. [DOI] [PubMed] [Google Scholar]
- 9.Chobanian AV, Bakris GL, Black HR, Cushman WC, Green LA, Izzo JL, Jr, et al. Seventh report of the Joint National Committee on Prevention, Detection, Evaluation, and Treatment of High Blood Pressure. Hypertension. 2003;42 (6):1206–1252. doi: 10.1161/01.HYP.0000107251.49515.c2. [DOI] [PubMed] [Google Scholar]
- 10.Patton KK, Heckbert SR, Alonso A, Bahrami H, Lima JA, Burke G, et al. N-terminal pro-B-type natriuretic peptide as a predictor of incident atrial fibrillation in the Multi-Ethnic Study of Atherosclerosis: the effects of age, sex and ethnicity. Heart. 2013;99 (24):1832–1836. doi: 10.1136/heartjnl-2013-304724. [DOI] [PubMed] [Google Scholar]
- 11.Peralta CA, Jacobs DR, Jr, Katz R, Ix JH, Madero M, Duprez DA, et al. Association of pulse pressure, arterial elasticity, and endothelial function with kidney function decline among adults with estimated GFR >60 mL/min/1.73 m(2): the Multi-Ethnic Study of Atherosclerosis (MESA) Am J Kidney Dis. 2012;59 (1):41–49. doi: 10.1053/j.ajkd.2011.08.015. [DOI] [PMC free article] [PubMed] [Google Scholar]
- 12.Grundy SM, Brewer HB, Cleeman JI, Smith SC, Lenfant C Participants ftC. Definition of Metabolic Syndrome: Report of the National Heart, Lung, and Blood Institute/American Heart Association Conference on Scientific Issues Related to Definition. Circulation. 2004;109 (3):433–438. doi: 10.1161/01.CIR.0000111245.75752.C6. [DOI] [PubMed] [Google Scholar]
- 13.Sharrett AR, Ding J, Criqui MH, Saad MF, Liu K, Polak JF, et al. Smoking, diabetes, and blood cholesterol differ in their associations with subclinical atherosclerosis: The Multiethnic Study of Atherosclerosis (MESA) Atherosclerosis. 2006;186 (2):441–447. doi: 10.1016/j.atherosclerosis.2005.08.010. [DOI] [PubMed] [Google Scholar]
- 14.Agatston AS, Janowitz WR, Hildner FJ, Zusmer NR, Viamonte M, Jr, Detrano R. Quantification of coronary artery calcium using ultrafast computed tomography. Journal of the American College of Cardiology. 1990;15 (4):827–832. doi: 10.1016/0735-1097(90)90282-t. [DOI] [PubMed] [Google Scholar]
- 15.Natori S, Lai S, Finn JP, Gomes AS, Hundley WG, Jerosch-Herold M, et al. Cardiovascular function in multi-ethnic study of atherosclerosis: normal values by age, sex, and ethnicity. AJR Am J Roentgenol. 2006;186 (6 Suppl 2):S357–365. doi: 10.2214/AJR.04.1868. [DOI] [PubMed] [Google Scholar]
- 16.Takeda Y, Sakata Y, Higashimori M, Mano T, Nishio M, Ohtani T, et al. Noninvasive assessment of wall distensibility with the evaluation of diastolic epicardial movement. J Card Fail. 2009;15 (1):68–77. doi: 10.1016/j.cardfail.2008.09.004. [DOI] [PubMed] [Google Scholar]
- 17.Marz W, Tiran B, Seelhorst U, Wellnitz B, Bauersachs J, Winkelmann BR, et al. N-terminal pro-B-type natriuretic peptide predicts total and cardiovascular mortality in individuals with or without stable coronary artery disease: the Ludwigshafen Risk and Cardiovascular Health Study. Clinical Chemistry. 2007;53 (6):1075–1083. doi: 10.1373/clinchem.2006.075929. [DOI] [PubMed] [Google Scholar]
- 18.Paget V, Legedz L, Gaudebout N, Girerd N, Bricca G, Milon H, et al. N-terminal pro-brain natriuretic peptide: a powerful predictor of mortality in hypertension. Hypertension. 2011;57 (4):702–709. doi: 10.1161/HYPERTENSIONAHA.110.163550. [DOI] [PubMed] [Google Scholar]
- 19.Newton-Cheh C, Larson MG, Vasan RS, Levy D, Bloch KD, Surti A, et al. Association of common variants in NPPA and NPPB with circulating natriuretic peptides and blood pressure. Nat Genet. 2009;41 (3):348–353. doi: 10.1038/ng.328. [DOI] [PMC free article] [PubMed] [Google Scholar]
- 20.Cataliotti A, Costello-Boerrigter LC, Chen HH, Textor SC, Burnett JC., Jr Sustained blood pressure-lowering actions of subcutaneous B-type natriuretic peptide (nesiritide) in a patient with uncontrolled hypertension. Mayo Clin Proc. 2012;87 (4):413–415. doi: 10.1016/j.mayocp.2012.02.003. [DOI] [PMC free article] [PubMed] [Google Scholar]
- 21.Tamura N, Ogawa Y, Chusho H, Nakamura K, Nakao K, Suda M, et al. Cardiac fibrosis in mice lacking brain natriuretic peptide. Proceedings of the National Academy of Sciences of the United States of America. 2000;97 (8):4239–4244. doi: 10.1073/pnas.070371497. [DOI] [PMC free article] [PubMed] [Google Scholar]
- 22.Eggers KM, Venge P, Lind L. Prognostic usefulness of the change in N-terminal pro B-type natriuretic peptide levels to predict mortality in a single community cohort aged >/= 70 years. American Journal of Cardiology. 2013;111 (1):131–136. doi: 10.1016/j.amjcard.2012.08.058. [DOI] [PubMed] [Google Scholar]
- 23.Bahrami H, Bluemke DA, Kronmal R, Bertoni AG, Lloyd-Jones DM, Shahar E, et al. Novel metabolic risk factors for incident heart failure and their relationship with obesity: the MESA (Multi-Ethnic Study of Atherosclerosis) study. Journal of the American College of Cardiology. 2008;51 (18):1775–1783. doi: 10.1016/j.jacc.2007.12.048. [DOI] [PubMed] [Google Scholar]
- 24.Jenny NS, Brown ER, Detrano R, Folsom AR, Saad MF, Shea S, et al. Associations of inflammatory markers with coronary artery calcification: results from the Multi-Ethnic Study of Atherosclerosis. Atherosclerosis. 2010;209 (1):226–229. doi: 10.1016/j.atherosclerosis.2009.08.037. [DOI] [PMC free article] [PubMed] [Google Scholar]
- 25.Betti I, Castelli G, Barchielli A, Beligni C, Boscherini V, De Luca L, et al. The role of N-terminal PRO-brain natriuretic peptide and echocardiography for screening asymptomatic left ventricular dysfunction in a population at high risk for heart failure. The PROBE-HF study. J Card Fail. 2009;15 (5):377–384. doi: 10.1016/j.cardfail.2008.12.002. [DOI] [PubMed] [Google Scholar]
- 26.Xia WJ, Huang YY, Chen YL, Chen SL, He JG. Acute myocardial ischemia directly modulates the expression of brain natriuretic peptide at the transcriptional and translational levels via inflammatory cytokines. Eur J Pharmacol. 2011;670 (1):7–12. doi: 10.1016/j.ejphar.2011.09.012. [DOI] [PubMed] [Google Scholar]
- 27.Bryan PM, Xu X, Dickey DM, Chen Y, Potter LR. Renal hyporesponsiveness to atrial natriuretic peptide in congestive heart failure results from reduced atrial natriuretic peptide receptor concentrations. Am J Physiol Renal Physiol. 2007;292 (5):F1636–1644. doi: 10.1152/ajprenal.00418.2006. [DOI] [PubMed] [Google Scholar]
- 28.Potter LR, Garbers DL. Dephosphorylation of the guanylyl cyclase-A receptor causes desensitization. Journal of Biological Chemistry. 1992;267 (21):14531–14534. [PubMed] [Google Scholar]
- 29.Clerico A, Vittorini S, Passino C. Circulating Forms of the B-Type Natriuretic Peptide Prohormone: Pathophysiologic and Clinical Considerations. Advances in Clinical Chemistry. 2012;58:31–44. doi: 10.1016/b978-0-12-394383-5.00008-4. [DOI] [PubMed] [Google Scholar]
- 30.Baerts L, Gomez N, Vanderheyden M, De Meester I, Mc Entee K. Possible mechanisms for brain natriuretic peptide resistance in heart failure with a focus on interspecies differences and canine BNP biology. The Veterinary Journal. 2012;194 (1):34–39. doi: 10.1016/j.tvjl.2012.06.019. [DOI] [PubMed] [Google Scholar]
- 31.Dessi-Fulgheri P, Sarzani R, Tamburrini P, Moraca A, Espinosa E, Cola G, et al. Plasma atrial natriuretic peptide and natriuretic peptide receptor gene expression in adipose tissue of normotensive and hypertensive obese patients. J Hypertens. 1997;15 (12 Pt 2):1695–1699. doi: 10.1097/00004872-199715120-00074. [DOI] [PubMed] [Google Scholar]
- 32.Nakamura M, Arakawa N, Yoshida H, Makita S, Niinuma H, Hiramori K. Vasodilatory effects of B-type natriuretic peptide are impaired in patients with chronic heart failure. American Heart Journal. 1998;135 (3):414–420. doi: 10.1016/s0002-8703(98)70316-3. [DOI] [PubMed] [Google Scholar]
- 33.Roubert P, Lonchampt MO, Chabrier PE, Plas P, Goulin J, Braquet P. Down-regulation of atrial natriuretic factor receptors and correlation with cGMP stimulation in rat cultured vascular smooth muscle cells. Biochem Biophys Res Commun. 1987;148 (1):61–67. doi: 10.1016/0006-291x(87)91076-x. [DOI] [PubMed] [Google Scholar]
- 34.Jensen J, Ma LP, Fu ML, Svaninger D, Lundberg PA, Hammarsten O. Inflammation increases NT-proBNP and the NT-proBNP/BNP ratio. Clin Res Cardiol. 2010;99 (7):445–452. doi: 10.1007/s00392-010-0140-z. [DOI] [PubMed] [Google Scholar]