

Abstract
Self-renewal is the hallmark feature both of normal stem cells and cancer stem cells1. Since the regenerative capacity of normal haematopoietic stem cells is limited by the accumulation of reactive oxygen species and DNA double-strand breaks2–4, we speculated that DNA damage might also constrain leukaemic self-renewal and malignant haematopoiesis. Here we show that the histone methyl-transferase MLL4, a suppressor of B-cell lymphoma5,6, is required for stem-cell activity and an aggressive form of acute myeloid leukaemia harbouring the MLL–AF9 oncogene. Deletion of MLL4 enhances myelopoiesis and myeloid differentiation of leukaemic blasts, which protects mice from death related to acute myeloid leukaemia. MLL4 exerts its function by regulating transcriptional programs associated with the antioxidant response. Addition of reactive oxygen species scavengers or ectopic expression of FOXO3 protects MLL4−/− MLL–AF9 cells from DNA damage and inhibits myeloid maturation. Similar to MLL4 deficiency, loss of ATM or BRCA1 sensitizes transformed cells to differentiation, suggesting that myeloid differentiation is promoted by loss of genome integrity. Indeed, we show that restriction-enzyme-induced double-strand breaks are sufficient to induce differentiation of MLL–AF9 blasts, which requires cyclin-dependent kinase inhibitor p21Cip1 (Cdkn1a) activity. In summary, we have uncovered an unexpected tumour-promoting role of genome guardians in enforcing the oncogene-induced differentiation blockade in acute myeloid leukaemia.
Leukaemias with MLL translocations account for the majority of acute lymphoblastic leukaemias and acute myeloid leukaemias in infants, and are associated with extremely poor prognosis and response to conventional therapies7. MLL1, the founding member of the MLL family of histone methyltransferases, is essential for stem-cell self-renewal8. MLL1 fusion genes lack endogenous histone methyltransferase activity but retain MLL-associated DNA binding7,9; therefore aberrant self-renewal of myeloid progenitors and malignant cell proliferation is thought to require the recruitment of alternative histone methyltransferases to canonical MLL1 target genes7,9. In addition to MLL1, five MLL family members possess H3K4-specific methyltransferase activity. Among these, MLL4 (also known as Kmt2d and orthologous to the human MLL2 gene) has emerged as a major tumour suppressor gene but its mechanism of action and target genes are unknown5,6,10,11. To determine the role of the chromatin regulator MLL4 in normal haematopoiesis and MLL1-fusion-induced leukaemogenesis, we deleted MLL4 in stem and progenitor cells by crossing MLL4f/f mice with transgenic mice expressing interferon-inducible MxCre (Extended Data Fig. 1a–d).
Total bone-marrow cellularity was equivalent in polyinosinic:polycytidylic acid (polyIC)-treated wild-type MxCre+ and MLL4f/f MxCre+ mice (herein referred to as WT and MLL4−/− respectively) (Extended Data Fig. 1e). However, the number of Lin−, Sca1+, c-Kit+ cells (LSKs), long-term haematopoietic stem cells (LT-HSCs) and myeloid (Mac1+, Gr1+) cells was significantly elevated, whereas common lymphoid progenitors and B cells were reduced in the absence of MLL4 (Extended Data Fig.1f–j). While there was no difference in the number of myeloid-biased HSCs (Extended Data Fig. 2a, b; P > 0.8), there was an increased frequency of bone-marrow-derived common myeloid progenitors, and an increased myeloid colony-forming potential in the absence of MLL4 (Extended Data Fig. 2c, d). MLL4−/− spleens were significantly larger than controls and exhibited extramedullary haematopoiesis (Extended Data Fig. 2e–h). Thus, loss of MLL4 results in an expansion of HSCs and myeloid cells but reduced lymphopoesis.
We compared the repopulating ability of a CD45.2 congenic test population (WT or MLL4−/− unfractionated whole bone marrow) against equal numbers of WT cells marked with the CD45.1 allele to support transplantation into lethally irradiated WT CD45.1 recipients (Extended Data Fig. 3a). Peripheral blood analysis revealed that the total CD45.2-derived reconstitution was reduced in mice transplanted with MLL4−/− bone marrow (Extended Data Fig. 3b–d), and MLL4−/− LSKs were eightfold less abundant than WT at 19 weeks after transplantation (Extended Data Fig. 3e). Competitive transplantation experiments with equal numbers of CD34lo LSKs from WT and MLL4−/− mice again revealed poor reconstitution of all lineages from MLL4−/− donor cells (Fig. 1a–c and Extended Data Fig. 3f–h), independently of any potential impact on HSC homing upon transplantation (Extended Data Fig. 3i–l). Despite these deficits in maintaining the MLL4−/− population in competitive assays, MLL4−/− bone marrow supported transplant reconstitution in non-competitive repopulation assays (Extended Data Fig. 3m–o). Thus, although MLL4 deficiency allows for haematopoietic homeostasis, the response to competitive repopulation stress is severely compromised.
Figure 1. Defects in HSC function in the absence of MLL4.

Purified HSCs were transplanted into irradiated recipients (details in Extended Data Fig. 3f). Reconstitution levels were monitored in the peripheral blood (PB) (a, b), and the frequency of donor-derived LSK CD34lo cells was determined in the bone marrow at week 14 (c). Bar graphs show mean ± s.d. of four and five WT and MLL4−/− mice, respectively. d, Division pattern of WT or MLL4−/− HSCs (n = 3 experiments, 40–77 randomly selected divisions per experiment, Extended Data Fig. 4c, d for details). e, LSK and LSK CD34lo cells from WT or MLL4−/− mice were stained with an antibody against phosphorylated Kap1 (top) and DCFDA (2′,7′-dichlorofluorescein diacetate; bottom). (*P < 0.05; **P < 0.01; ***P < 0.005; ****P < 0.0001).
Despite the fact that MLL4-mutant mice showed an increase in the number of HSCs and LSKs (Extended Data Fig. 1f–h), we did not detect an increase in the percentage of cycling (S/G2/M phase) cells (Extended Data Fig. 4a, b). To examine the symmetry of cell divisions during cell cycle, we purified CD150+ CD48− CD41− Flt3− LSK cells and cultured them for an in vitro immunophenotypic division assay (Extended Data Fig. 4c)12,13. After purification, more than 90% of WT and MLL4−/− HSCs expressed the receptor tyrosine kinase molecule Tie2, indicative of their quiescent state (Extended Data Fig. 4d). During asymmetric division, an HSC gives rise to a copy of itself (indicated by Tie2+ CD48−) and to a committed progenitor daughter cell (indicated by Tie2− CD48+) (Extended Data Fig. 4c). We found that after an initial cellular division, the frequency of asymmetric divisions was approximately twofold lower in MLL4−/− compared with WT, with a concomitant increase in the frequency of symmetric commitment (Fig. 1d). Thus, loss of MLL4 is associated with a skewing towards symmetric commitment, which has been linked with attenuated self-renewal capacity12,13. Altogether, our data suggest that under homeostatic conditions loss of MLL4 leads to an increase in HSCs. However, when the cells are forced to enter into cycle under conditions of stress, as during the in vivo repopulation or in vitro cell division assay, their stem-cell capacity is impaired.
To understand how MLL4 regulates stem-cell function, we performed global analysis of gene expression changes in LSK cells. This analysis revealed that genes positively regulated by MLL4 were associated with several processes involved in cellular response to stress (Extended Data Fig. 4e). Specifically, gene set enrichment analysis (GSEA) indicated significant enrichment of the glutathione detoxification pathway in the MLL4 positively regulated genes (Extended Data Fig. 4f, g; false discovery rate (FDR) < 0.1), which was confirmed by quantitative real-time reverse-transcription PCR (RT–qPCR) (Extended Data Fig. 4h). The members of the FoxO transcription factors family FoxO1, 3 and 4 (FoxOs) are also important mediators of HSC resistance to reactive oxygen species (ROS)4,14. Genes that were downregulated in FoxO-deficient LSKs were also significantly enriched among those genes downregulated in the absence of MLL4 (FDR < 0.1, Extended Data Fig. 4i). Thus, MLL4 deficiency in the HSC compartment deregulated the expression of genes mediating resistance to oxidative stress.
Oxidative stress and DNA damage limit HSC functional capacity2–4. Flow cytometric analysis revealed that MLL4−/− LSKs and HSCs (LSK CD34lo) exhibited an increase in ROS (Fig. 1e, bottom, and Extended Data Fig. 4j) and DNA damage, as measured by levels of phosphorylated Kap1 (Fig. 1e, top), a target of the DNA-damage kinases ATM, ATR and DNA-PKcs. Thus, the loss of HSC reconstitution potential and self-renewal defects in MLL4−/− mice are associated with the accumulation of endogenous ROS and DNA damage signalling.
Despite their well-established tumour suppressor functions, FoxOs are required for the maintenance of leukaemic initiating cells in a model that mimics acute myeloid leukaemias containing a translocation between MLL1 and AF9 genes15. To determine whether MLL4 modifies MLL–AF9 leukaemia, we introduced MLL–AF9 into WT and MLL4−/− bone-marrow haematopoietic stem/progenitor cells with a retrovirus marked with green fluorescent protein (GFP) (MLL–AF9-IRES–GFP)16 (Extended Data Fig. 5a, c). When injected into sublethally irradiated recipients, WT cells transformed with MLL–AF9 caused leukaemia, with 70% of the animals succumbing by 80 days (Fig. 2a, b and Extended Data Fig. 5d). In contrast, MLL4-deficient cells transformed with MLL–AF9 failed to cause leukaemia (Fig. 2a), even when MLL4 was excised after cells transformed with MLL–AF9 were injected into syngeneic recipients (Extended Data Fig. 5b and Fig. 2e, f); moreover, unlike non-transformed MLL4−/− counterparts (Extended Data Fig. 5e), MLL–AF9 MLL4−/− cells grew ex-vivo more poorly than WT controls (Fig. 2c, g and Extended Data Fig. 5l), despite no detectable changes in cell death or retroviral infection frequency (Extended Data Fig. 5f, g). However, MLL4-deficient colonies contained fewer blasts (undifferentiated cells) and the majority of cells presented morphological characteristics associated with myeloid differentiation (Fig. 2d, h and Extended Data Fig. 5h–k, m–o). Finally, short hairpin RNA (shRNA)-mediated depletion of MLL4 in WT MLL–AF9 cells also skewed their differentiation towards myeloid lineages in culture (Extended Data Fig. 5p, q). We conclude that although inactivating mutations of MLL4 are found in various cancers5,6,10, MLL4 is essential for MLL–AF9-induced leukaemia.
Figure 2. MLL4 is required for MLL–AF9-induced leukaemia.
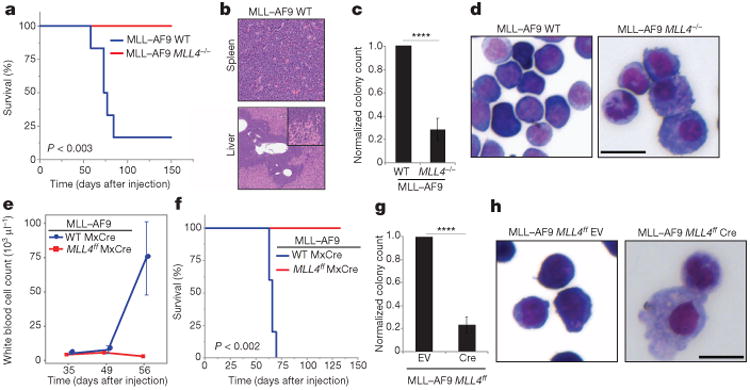
a, Kaplan–Meier survival plots of mice injected with WT or MLL4−/− cells transformed with MLL–AF9 (details in Extended Data Fig. 5a). WT (n = 7), MLL4−/− (n = 6). b, Haematoxylin and eosin stain of WT mice at the time of death showing leukaemic cells in the spleen (top ×20) and liver (bottom ×4, zoomed-in for details). Data representative of at least three mice. c, Blast colony count and colony morphology in methylcellulose, May-Grünwald–Giemsa stain (d) of WT or MLL4−/− cells 10 days after MLL–AF9 transformation. Bar graph shows mean ± s.d. of four independent experiments and (d) is representative of three experiments. e, Peripheral blood white cell counts (mean ± s.d. of five mice) and (f) Kaplan–Meier survival plots of mice injected with MLL-AF9 WTMxCre or MLL–AF9 MLL4f/f MxCre cells and subsequently treated with polyIC injections (details in Extended Data Fig. 5b). Blast colony counts (g) (mean ± s.d. of four independent experiments) and colony morphology (h) of EV or CRE-infected MLL4f/f MLL-AF9 cells 10 days after sort (details in Extended Data Fig. 5b; images representative of three independent experiments); EV, empty vector. Scale bars, 10 μm.
To identify the molecular mechanisms underlying the requirement of MLL4 in MLL–AF9 leukaemogenesis, we examined MLL4-dependent gene expression alterations in cells transformed with MLL–AF9 (Extended Data Figs 5j and 6a). GSEA revealed a marked downregulation of genes highly expressed in the MLL–AF9 leukaemic stem-cell (LSC) signature in MLL4-deficient cells (FDR < 0.1, Extended Data Fig. 6b), as well as global upregulation of genes that are downregulated in granulocyte macrophage progenitor-like leukaemic cells (L-GMP) and HSCs relative to committed progenitors (FDR < 0.1, Extended Data Fig. 6c, Methods). Moreover, specific markers of myeloid maturation were significantly upregulated in the absence of MLL4 (FDR < 0.1, fold change > 2) (Extended Data Fig. 6d–f). Nevertheless, more than 93% of the MLL–AF9 direct targets17 (including HOXA9 and MEIS1) were not differentially expressed (FDR > 0.25, Fig. 3a), suggesting an alternative mechanism by which the LSC signature and self-renewal are compromised.
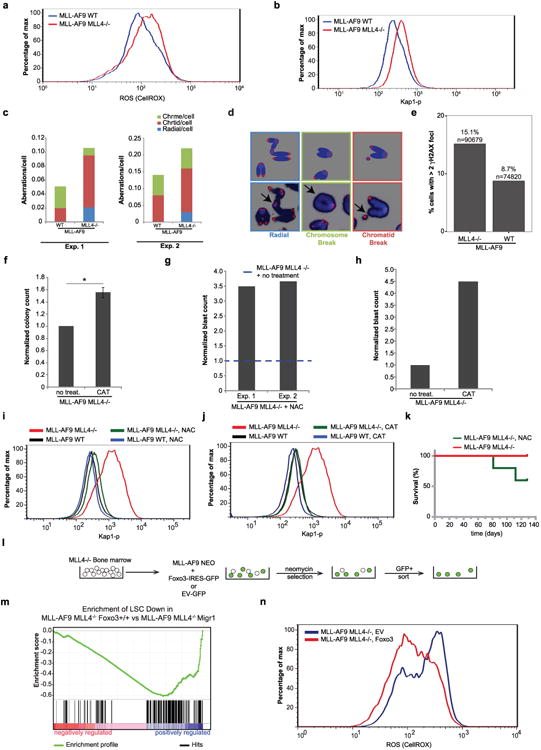
Figure 3. MLL4 enforces the differentiation blockade in cells transformed with MLL–AF9 by protecting against ROS and DNA damage.
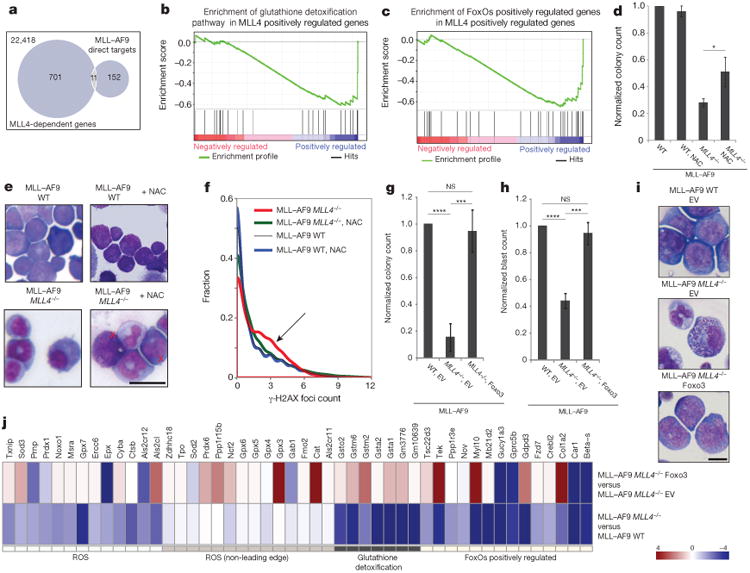
a–c, RNA sequencing (RNA-seq) was performed on WT and MLL4f/f cells transformed with MLL–AF9 5days after CRE infection as in Extended Data Fig. 5b. a, Fewer than 7% of MLL–AF9 direct targets are deregulated in MLL4-deficient cells (FDR > 0.25). b, GSEA shows enrichment of the glutathione detoxification pathway in WT versus MLL4-deficient cells (FDR < 0.05) and (c) downregulation of the FOXO1/3/4 positively regulated genes in MLL4-deficient cells (FDR < 0.05). d–f, Cells transformed with MLL–AF9 were expanded with or without NAC. Blast colony counts (d) and colony morphology (e) were determined (images representative of two independent experiments). Red crosses show morphological changes characteristic of blasts. f, Distribution of γ-H2AX foci per cell measured by high-throughput microscopy. Arrow indicates that NAC treatment reduces the frequency of MLL4-deficient cells with high numbers of foci. g, Blast colony counts, frequency of blasts (h) and colony morphology (i) determined 10 days after sorting FOXO3- or empty-vector-expressing cells transformed with MLL–AF9 (details in Extended Data Fig. 7l; images representative of three independent experiments). Bar graphs show mean ± s.d. of three independent experiments. Scale bars, 10 μm. j, RNA-seq profile showing that FOXO3 complementation reversed some of the MLL4-dependent deregulated genes included in b and c. Experiments were performed three (g–i) or two (j) independent times using the same MLL–AF9 cells expressing FoxO3 or the empty vector.
Increased levels of ROS in haematopoietic progenitors are associated with myeloid differentiation4,18. On the basis of our finding that MLL4-deficient primary stem cells exhibit higher than normal levels of ROS, we hypothesized that myeloid differentiation of MLL4-deficient MLL–AF9 leukaemia blasts (Fig. 2d, h) might similarly be a result of dysregulation of antioxidant genes. Consistent with this, the glutathione detoxification pathway and FOXO1/3/4 positively regulated genes were significantly downregulated in MLL4-deficient MLL–AF9 cells (FDR < 0.05, Fig. 3b, c). Moreover, MLL4−/− MLL-AF9 cells exhibited higher levels of ROS than WT cells transformed with MLL–AF9 (Extended Data Fig. 7a), accompanied by increased levels of phosphorylated Kap-1, chromosomal aberrations and γ-H2AX foci (Extended Data Fig. 7b–e). Thus, MLL4-deficient MLL–AF9 cells have higher than normal levels of ROS and DNA damage.
To test whether ROS was mediating the differentiation of MLL4-deficient MLL–AF9 leukaemic cells, we cultured them with antioxidants N-acetyl-l-cysteine (NAC) and catalase. As expected, MLL4−/− MLL–AF9 cells gave rise to significantly fewer colonies than their WT counterparts, but treatment with NAC or catalase partly reversed this phenotype (Fig. 3d and Extended Data Fig. 7f), and led to a three- to fivefold increase in the percentage of MLL4-deficient blasts (Fig. 3e and Extended Data Fig. 7g, h). This correlated with a decrease in the levels of γ-H2AX foci and phosphorylated Kap-1 (Fig. 3f and Extended Data Fig. 7i, j). Finally, mice that received MLL4f/f MxCre+ MLL–AF9 cells and were fed daily with NAC during and after polyIC administration had reduced survival relative to animals that received the same cells and polyIC treatment but were not treated with NAC (Extended Data Fig. 7k). Together, these data suggest that protection from oxidative stress and DNA damage by MLL4 is critical to enforce the differentiation blockade and thereby promote the growth of MLL–AF9 leukaemic cells.
Since MLL4 positively regulates FOXO-dependent genes (Fig. 3c), we asked whether FOXO3 complementation could bypass the requirement for MLL4. Ectopic FOXO3 expression conferred nearly complete resistance to myeloid differentiation and growth impairment in MLL4−/− cells (Extended Data Fig. 7l and Fig. 3 g–i), and a marked downregulation of MLL–AF9 LSC differentiation signature (Extended Data Fig. 7m). FOXO3 complementation also reversed many of the transcriptional defects in the glutathione, ROS and FOXO pathways (Fig. 3j), and levels of ROS were reduced in MLL4−/− MLL–AF9 cells overexpressing FOXO3 (Extended Data Fig. 7n). These results support the notion that the FOXO pathway is a relevant target of MLL4 in protection against ROS.
To determine whether increased oxidative stress was sufficient to confer differentiation of MLL–AF9 leukaemic blasts, we treated WT cells with hydrogen peroxide. This treatment resulted in increased ROS (Extended Data Fig. 8a), phosphorylated Kap1 (Extended Data Fig. 8b), myeloid differentiation (Extended Data Fig. 8c) and a concomitant decrease in the frequency of blasts (Extended Data Fig. 8d, e). Thus, ROS and DNA-damage signalling are associated with myeloid differentiation.
Since genome stability is a key determinant of the ability of normal HSCs to self-renew and to sustain physiological stress2,3,19, we hypothesized that tumour suppressors that protect against DNA damage and oxidative stress such as ATM and BRCA1 (refs 20–22) might similarly be required to sustain the differentiation block induced by MLL–AF9. To test this, we measured the growth and morphology of WT, BRCA1−/− (BRCA1f/f × Mx-Cre mice treated with polyIC (Extended Data Fig. 8f)) and ATM−/− bone-marrow cells. In granulocyte–macrophage colony-forming unit assays (CFU-GM), loss of ATM and BRCA1 led to a small deficit in cell growth (Extended Data Fig.8 g,h). When transformed with MLL–AF9, these DNA repair mutants were incapable of maintaining in vitro self-renewal and proliferation without differentiation (Extended Data Fig. 8i–n). Moreover, treatment of WT MLL–AF9 cells with a specific ATM inhibitor (Ku55933, ATMi) for 48 h led to a 275% increase in their differentiation with negligible cell death (Extended Data Fig. 8o, p). Similar results were obtained with a specific ATR inhibitor (Extended Data Fig. 8q). While deficiencies in either BRCA1 or ATM led to myeloid maturation, loss of ATM was associated with increased levels of DNA damage and ROS (Extended Data Fig. 9a, b), whereas BRCA1 suppression led to DNA-damage accumulation without a detectable increase in ROS (Extended Data Fig. 9c, d). We conclude that BRCA1, ATM and ATR are critical for cytoprotective responses that maintain the differentiation blockade induced by the MLL–AF9 oncogene.
To separate the effects of ROS and DNA damage, we generated double-strand breaks (DSBs) directly in WT MLL–AF9 cells with a homing endonuclease I-Ppo123 (Extended Data Fig. 10a). I-Ppo1-infected cells exhibited an increase in levels of Kap-1 phosphorylation but no change in ROS relative to cells infected with empty vector (Fig. 4a, b). Moreover, upon re-plating we observed fivefold fewer colonies in I-Ppo1-infected cells (Fig. 4c), a fivefold reduction in the frequency of blasts (Extended Data Fig. 10b) and an induction of mature myeloid lineages (Fig. 4d). To rule out a possible toxic effect of I-Ppo1 interfering with ribosomal biogenesis due to the presence of a recognition site in the 28S ribosomal RNA genes, we used a second inducible restriction enzyme AsiSI (AsiSI-ER-Tet-on)24 to generate DSBs directly in leukaemic cells (Extended Data Fig. 10c). Upon co-administration of doxocycline and 4-hydroxytamoxifen (4OHT), AsiSI-ER became expressed and translocated from cytoplasm to nucleus; and γ-H2AX was induced in 65% of the cells with no change in the levels of ROS (Fig. 4e; Extended Data Fig. 10d). By 48 h after treatment, there was 60% reduction in the frequency of blasts (Fig. 4f). Together these data suggest that DSBs either generated indirectly through the production of ROS or produced directly can bypass the MLL–AF9 oncogene-induced differentiation blockade.
Figure 4. DNA damage directly induces differentiation of leukaemic cells.
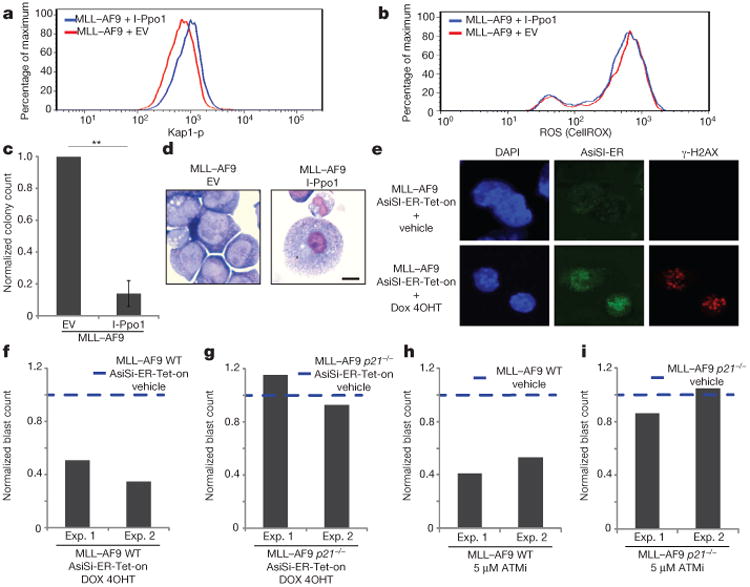
The levels of phosphorylated Kap1 (a) and ROS (b), blast colony counts (c) and colony morphology (d) were determined in cells transformed with MLL–AF9 expressing I-Ppo1 or an empty vector (details in Extended data Fig. 10a). Bar graph shows mean ± s.d. of three independent experiments. d, Images were acquired once. e–g, WT or p21−/− cells transformed with MLL–AF9 were infected with a retrovirus containing the inducible restriction enzyme AsiSI-ER-Tet-on (details in Extended data Fig. 10c). e, γ-H2AX foci and AsiSI-ER (antibody to ER) staining in WT cells 24 h after treatment with doxocycline and 4OHT. Sixty-five per cent of cells were positive for γ-H2AX foci in WT and p21−/− cells (Extended data Fig. 10h; one representative of two experiments). Frequency of blasts in WT (f) and p21−/− (g) cells with or without the restriction enzyme. h, i, WT and p21−/− MLL–AF9 cells were treated with 5 μM of ATMi or vehicle for 48 h and the frequency of blasts was determined. f–i, The frequency of blasts is normalized to vehicle-treated cells in independent experiments.
Recent studies have uncovered connections between DNA-damage checkpoint pathways, stem-cell self-renewal and differentiation19,25. Since DNA-damage-induced differentiation in MLL–AF9 transformed cells was associated with impaired growth, we wondered whether the cyclin-dependent kinase inhibitor p21, which regulates the G1–S checkpoint in response to DNA damage, could be involved in terminal differentiation. In contrast to MLL4-, ATM- and BRCA1- deficiency, loss of p21 had no negative impact on proliferation or myeloid differentiation in the setting of MLL–AF9 transformation (Extended Data Fig. 10 e, f). However, after exogenous DNA damage, p21 transcripts were induced (Extended Data Fig. 10g). Moreover, when exogenous DSBs were generated either by activation of AsiSI-ER (Fig. 4e–g and Extended Data Fig. 10c, h) or by ATMi treatment (Fig.4 h, i and Extended Data Fig. 10i), p21-deficient MLL–AF9 cells were resistant to DNA-damage-induced differentiation and growth inhibition. These data suggest that DNA-damage-induced cell-cycle exit and differentiation of cells transformed with MLL–AF9 are coupled by the activation of p21.
The ‘oncogene-induced replication stress’ model for cancer development posits that DNA damage induced by oncogenes in pre-cancerous lesions activates ATM and p53, which in turn trigger cell-cycle arrest, senescence and apoptosis26. These well-established DNA-damage checkpoints raise the barrier against tumour progression, but at an advanced disease state this barrier is breached by mutations in ATM and p53, which promote genome instability and cancer26. In contrast, our results argue that DNA-damage response proteins are activated in response to MLL-fusion oncogenes, but in this case they are required for tumorigenic function (Extended Data Fig. 10j). In line with this, suppression of the ATR kinase inhibits acute myeloid leukaemia driven by the MLL–ENL oncogene27. One potential mechanism by which DNA damage can induce myeloid differentiation is by lengthening the cell cycle. Indeed, recent studies showed that retroviral transduction of p21 in lympho-myeloid progenitors induced cell-cycle lengthening and consequent accumulation of the lineage determining PU.1 transcription factor, which favours macrophage differentiation28. Similarly, we hypothesize that when MLL–AF9 oncogene-induced DNA damage in leukaemic cells reaches beyond a certain threshold, p21 is activated, cells exit the cycle and initiate terminal differentiation. As a corollary, DNA repair pathway inhibitors, such as ATMi/ATRi described here (Extended Data Fig. 8o, q), may prove to be a promising modality of differentiation therapy for the treatment of MLL-associated leukaemia.
Methods
Mice
MLL4f/f mice were generated by inserting a loxp-FRT-Neo-FRT cassette 5′ to exon 19 and a loxp site 3′ of exon 16 to generate the targeting vector. Targeted embryonic stem cells gave germline transmission and the neo cassette was removed by crossing the mice with Flp deleter mice. Cre recombination removed exons 16–19 and generated a frameshift mutation that resulted in a truncated protein missing the carboxy (C)-terminal ∼4,200 amino acids11. These animals were maintained in a B6/129 background. BRCA1f(Δ11)/f(Δ11) (NCI mouse repository), B6-Ly5.2/Cr (NCI mouse repository), B6;129S2-Cdkn1atm1Tyj/J (p21−/−) (The Jackson Laboratory), Mx1-Cre (The Jackson Laboratory) and ATM−/− (provided by A. Wynshaw-Boris) mice have been described. Experiments were performed with 6- to 10-week-old mice. Males and females were equally distributed between different experimental groups. All mice were housed in the Frederick National Laboratory and treated with procedures approved by the National Institutes of Health Animal Care and Use Committee.
PolyIC treatment
Three hundred micrograms of polyIC (Sigma Aldrich) was administered by intraperitoneal injection five times every other day. The experiments were performed 3 weeks after the last polyIC injection.
Isolation of bone-marrow cells, flow cytometry and HSC isolation
Bone-marrow cells were flushed from the long bones (tibias and femurs) and stained in PBS (Corning Cellgro) supplemented with 2% of inactivated fetal bovine serum (Gemini BioProducts) with the following antibodies from BD Biosciences: B220 FITC, CD11b FITC, PE, APC or APCcy7, CD11CFITC, PE, APC or APC-cy7, CD4FITC, PE or APC, CD8 FITC, PE or APC, NK1.1 FITC, Ter119 FITC, CD3 FITC (when gates on lineage negative bone-marrow cells were used, FITC-conjugated antibodies were used), c-Kit PE or APC, Flk2 PE, CD45.2 biotin or FITC, CD45.1 APC, IL7R Alexa 647, CD34 APC, CD150 PE. From eBiosciences: Sca-1 PEcy7, AA4.1 bio or PEcy-7, streptavidin APC. From Invitrogen: streptavidin Pacific blue. DAPI was used to exclude dead cells. Flow cytometry was performed on a fluorescence-activated cell sorting (FACS) Calibur, LSRII or LSR Fortessa (BD Biosciences).
Long-term repopulation assays
Two hundred sort-purified LSK bone-marrow cells harvested from 6- to 10-week-old mice were mixed with 500,000 congenic whole bone-marrow cells and injected intravenously into lethally irradiated (900 rad) recipients. For whole bone-marrow transplants, bone-marrow cells (4×10⁶ to 8×10⁶) harvested from 6-to10-week-old mice were injected intravenously in to lethally irradiated (900 rad) recipients. Beginning 4 weeks after transplantation and continuing for 12–19 weeks, blood was obtained from the tail veins of recipient mice, subjected to lysis of red blood cells (ACK lysing buffer, Quality Biological) and stained with antibodies to monitor engraftment.
HSC cell division assays
Division patterns of HSCs were determined as previously described12. Briefly, single-cell deposition of bone-marrow CD150+CD48−CD41−Flt3−CD34− KSL cells from WT or MLL4−/− mice (total 90–180 cells per experiment) were cultured in StemSPAN (StemCell Technologies) supplemented with 50 ng ml−1 SCF and 50 ng ml−1 thrombopoietin. Cells were stained with anti-mouse Tie2 antibody, anti-mouse CD48 antibody and DAPI at day 3. Student's t-test was used to determine statistical significance, and statistical significances in division pattern and the disturbance of division pattern were also confirmed by log-linear model and χ2 test (data not shown).
HSC and progenitor replating and granulocyte–macrophage colony-forming unit assays
For HSC isolation from whole bone marrow, c-Kit enrichment was performed using CD117 magnetic beads (Miltenyi). Cells were stained with antibodies against lineage (CD3, CD4, CD8, B220, Ter119, Mac1, Gr1 and Il7ra), Sca1, c-Kit, CD34, Flk2, CD150 and PI. HSCs were sorted as PI−, Lin−, c-Kit+, Sca1+, CD34−, Flk2−, CD150+ on a FACS Aria II (Becton, Dickinson) before genomic DNA isolation and PCR quantification of deletion efficiency. For in vitro replating assays, 1,000 myeloid progenitors from WT and MLL4−/− mice were FACS sorted from bone marrow, plated in triplicate in MethoCult M3434 (StemCell Technologies), and grown at low (5%) oxygen conditions. After primary quantification, triplicates were pooled and counted. 10,000 cells per well were plated in triplicates for subsequent analysis. All colonies were quantified after 10 days of growth. For granulocyte– macrophage colony-forming unit assays, whole bone-marrow cells were plated in MethoCult M3434 (StemCell Technologies) in the presence of SCF (100 ng ml−1), IL3 (10 ng ml−1) and IL6 (10 ng ml−1) (all from Peprotech). Colonies were scored between days 10 and 12.
Intracellular staining of phosphorylated Kap1 and detection of ROS
To detect Kap1-p cells were fixed and permeablized using the BD Cytofix/Cytoperm Kit (BD Biosciences) as described by the manufacturer. Anti Kap1-p (Bethyl) was added to the cells for 1 h at 4 °C followed by the secondary antibody (either mouse-anti-rabbit Alexa Fluor 488 or Pacific Blue (Invitrogen)). To detect ROS, cells were incubated with DCFDA (2′,7′-dichlorofluorescein diacetate; Invitrogen) or CellROX Deep Red Reagent (Invitrogen) according to the manufacturer's instructions for 30min at 37 °C followed by flow cytometry.
Immunofluorescence, metaphase analysis and microscopy
For immunofluorescent staining of γ-H2AX and AsiSI-ER, the ERα Antibody (sc-543; Santa Cruz; 1/500) and anti-phospho-Histone H2A.X (Ser139) (JBW301 Millipore, 1/5,000) were used. Cells were treated with doxocycline at 1 μg ml−1 and 4OHT at 1μM for 24 and 4 h respectively, before fixation and processing as described29. Cells were harvested for metaphase analysis as described30. Imaging of γ-H2AX foci was performed using a wide-field epi-fluorescence Zeiss Axio Observer Z1 microscope equipped with a ×20 plan apochromatic lens (numerical aperture 0.8), motorized stage and Zeiss AxioCam CCD (charge-coupled device) camera. Images were acquired and processed using Zeiss Zen imaging software with a custom-made algorithm for foci detection and then filtered based on the nucleus area, staining background and cell morphology. For acquisition of May–Grunwald–Giemsa stained cytospin slides, images were collected using Zeiss Zen image acquisition software controlling an Axio Observer Z1 wide-field microscope equipped with a plan-apochromat ×63 (numerical aperture 1.4) objective lens and an AxioCam MRc5 colour CCD camera.
Plasmids, transformation and culture of murine cells and generation of leukaemias in vivo
The following plasmids were provided by S. Armstrong: MSCV-MLL–AF9-IRES–GFP, MSCV-MLL–AF9-neo, MSCV-Cre-IRES-Tomato Red and MSCV-IRES-Tomato Red. For construction of the AsiSI-ER-Tet-on vector, a fragment containing HA-ER-AsiSI was PCR amplified from pBabe-AsiSI-ER and cloned under the control of TRE3G doxycycline-inducible promoter of pRT3GEPIR; BamHI-MluI sites were used to remove GFP-miR-E, then HA-ER-AsiSI was cloned in pRT3GEPIR. pBabe-AsiSI-ER and pRT3GEPIR were gifts from G. Legube and J. Zuber, respectively. AsiSI-ER-Tet-on and FoxO3 (FoxO3-IRES–GFP) retroviruses were generated in 293T cells. Retroviruses were used to infect bone-marrow cells harvested 4 days after administration of 5-FU (250 mg per kg) as previously described31. After infection, cells were maintained in methylcellulose (Methocult, StemCell Technologies) in the presence of SCF (100 ng ml−1), IL3 (10 ng ml−1) and IL6 (10 ng ml−1) (all from Peprotech). Eight days after infection, 3×10⁶ cells were injected intravenously into sublethally irradiated recipients (650 rad). White blood-cell counts were monitored from peripheral blood collections using a Hemavet (Drew Scientific). For all colony assays, MLL–AF9-infected cells were plated at 1,000 or 5,000 cells in Methocult in the presence of IL3, Il6 and SCF as above. When used, NAC (Sigma Aldrich) was added at 1 μM, Catalase (Sigma Aldrich) at 100 μg ml−1 and ATMi KU55933 (TOCRIS Bioscience) at 5μM. ATRi32 was used at 1 μM. For in vivo experiments, 5 mg ml−1 of NAC was added to the drinking water.
Colony assays and cell morphology staining
For colony assays, cells were plated in M3434 cytokine-enriched methylcellulose (Stem Cell Technologies) according to the manufacturer's instructions. Cytospins were performed in a Shandon Cytospin 4 (Thermo Scientific) and cells were stained first with May-Grünwald dye and then Giemsa stain (both from Sigma Aldrich). For the experiments with MLL–AF9 cells stably infected with AsiSI-ER-Tet-on, AsiSI-ER was induced with doxocycline at 1 μg ml−1 and 4OHT at 1 μM for 24 and 4 h, respectively, in liquid media, then plated in M3434 cytokine-enriched methylcellulose and maintained at the same concentration of doxocycline and 4OHT until the end of the experiment.
qPCR
RNA extraction was performed using a QIAGEN RNeasy Mini Kit. Complementary DNA (cDNA) was synthesized from RNA with a Superscript II kit (Invitrogen). Transcripts were amplified with Sybr Green PCR Master Mix (ABI). qPCR was performed on an ABI Prism real-time PCR system. The following primers were used to quantify MLL4 expression: MLL4-F 5′-GCCACCTCTTGGCCTGTTCA-3′; MLL4-R 5′-ACACAACGCCAGCCCTTCAG-3′. The following primers were used to quantify Prdx1, Cstb, Txnip and p21 expression: Prdx1-F 5′-GCGCTTCTGTGGATTCTCACTTCT-3′, Prdx1-R5′-ACTCCATAATCCTGAGCAATGGTG-3′, Cstb-F 5′-GAAGTCCCAGCTTGAATCGAAAGAA-3′, Cstb-R 5′-TAGGAAGACAGGGTCAAAGGCTTGT-3′, Txnip-F 5′-GCTGCAACATCCTCAAAGTCGAA-3′, Txnip-R 5′-TCTTGAGAGTCGTCCACATCGTC-3′, p21F 5′-CTGGGAGGGGACAAGAG-3′ and p21 R-5′-GCTTGGAGTGATAGAAATCTG-3′. The MLL4 flox and Cre-deleted alleles were quantify using the following primers: MLL4DNA-A5′-AGGAACCTGAGGGAAACGAACC-3′, MLL4DNA-B 5′-GGAGAACAGGAGATGCCTCAGC-3′, MLL4DNA-C 5′-TGCAGAAGCCTGCTATGTCCAG-3′.
shRNA targeting MLL4 expression
Trans OMIC shRNAmir against MLL4 (RLGM-GU42557, target sequence: TGGGAATGATTCTAAAATGTT) and non-targeting control shRNA-mir (TRM1103, target sequence: ACCGGCTGAAGAGCCTGATCA) were cloned from pMLP to the pLEPG backbone (a gift from J. Zuber). Retroviruses were generated in Phoenix-eco cells. WT MLL–AF9 cells were infected and selected for 96h in puromycin (4 μg ml−1), and depletion of MLL4 messenger RNA (mRNA) was measured by qPCR using the primers for MLL4 mRNA described above.
RNA-seq
To perform RNA-seq in MLL–AF9-infected cells, RNA extraction was performed using TRIzol (Ambion) following the manufacturer's protocol. RNA was washed, purified with an RNeasy kit (QIAGEN) and measured for quality using Agilent RNA 6000, Nano reagents and Bioanalyzer. RNA was then prepared for sequencing using a TruSeq RNA sample prep kit (Illumina). To perform RNA-seq in LSK cells, we followed a protocol for single cell RNA-seq33. Sequence reads from each cDNA library were mapped onto the Build 37 assembly of the National Center for Biotechnology Information mouse genome data (July 2007; NCBI37/ mm9) using Top Hat, and outputted to bam format34. Bioconductor35 packages were used to quantify the expression abundance of RefSeq genes from the aligned reads and calculate the reads per million on the genes' exons. For comparison of RNA-seq experiments in CRE-infected MLL4f/f cells transformed with MLL–AF9 versus CRE-infected WT cells transformed with MLL–AF9, genes with more than a twofold change and FDR < 0.1 were designated as MLL4-dependent genes. Visualization was achieved by generating custom tracks for the University of California at Santa Cruz Genome Browser.
Gene set analysis
Gene sets were obtained from the biological processes classification from Gene Ontology36, Reactome37 and Pathway Commons38 to assess the canonical pathways and biological processes over-represented among the genes downregulated in MLL4f/f MxCre (MLL4−/−) versus WT MxCre (WT) LSK cells. MLL–AF9 direct target genes were identified using the MLL–AF9 ChIP-seq data set deposited at the GEO under accession code GSE29130 and compared with MLL4-dependent genes in cells transformed with MLL–AF9. Fisher's exact test with Benjamini–Hochberg multiple-testing correction39 was used as the measure of gene set over-representation. GSEA used Pre-ranked tool version 2.0.12 with 10,000 per-mutations. Moderated logarithmic fold change was used as the gene dysregulation ranking metric. MLL–AF9 ‘leukemic stem cell’ self-renewal associated signatures (Up LSC and Down LSC) were defined on the basis of the microarray data set from ref. 16 deposited in the NCBI Gene Expression Omnibus under accession code GSE3725. FOXO1/3/4 positively regulated HSC gene sets were defined on the basis of analysing the microarray gene expression profiling of FOXO1/3/4-deficient HSC cells from the GEO data set GSE6623 (ref. 4). Limma package in Bioconductor40 was used for microarray processing and differential gene expression. The glutathione-mediated detoxification pathway is a modified version of the genes annotated for the process at Pathway Commons38. The heatmap plot in Fig. 3j was generated on the genes in the glutathione, ROS and FOXO pathways that were associated with MLL4 deficiency identified by the leading edge of GSEA analyses unless indicated otherwise in the plot.
Statistical analyses
Multiple independent biological experiments were performed to assess the reproducibility of experimental findings. Each group is presented by mean ± s.d. To compare two experimental groups, statistical tests were conducted using R statistical language (http://r-project.org). Unpaired, one-tailed t-tests were used for all analyses. For ex vivo experiments, multiple independent biological replicates were used. For leukaemia transplantation, five to seven recipients per group were used since variation among experiments was low. Animals were placed in different experimental groups and disease development was accessed blindly without prior knowledge of genotype. The significance between the longevity of cohorts was assessed by Kaplan–Meier survival analysis and log-rank (Mantel–Cox) tests. P values less than 0.05 were considered significant to reject the null hypothesis. No randomization was used in any experiment.
Extended Data
Extended Data Figure 1. Deletion of MLL4 in haematopoietic stem cells.
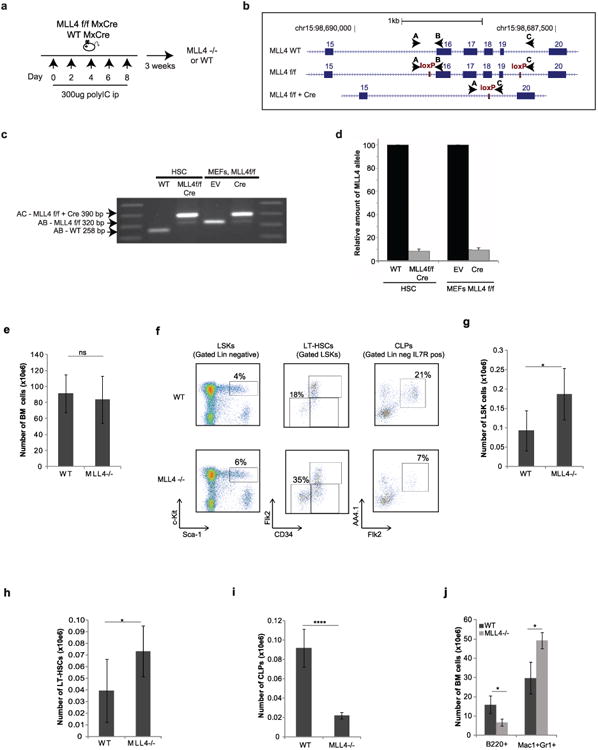
a, MLL4f/f mice (see methods) were crossed with the interferon-inducible transgene MxCre to obtain MLL4f/f MxCre and WTMxCre mice. Animals were then treated with intraperitoneal (ip) injections of 300 μg of polyIC five times every other day and analysed 3 weeks after the last polyIC injection (generating WT and MLL4−/− mice). b, The MLL4 wild-type locus (WT) and the floxed exons locus before and after Cre excision. Exons are represented in numbered boxes. The loxP sites (red rectangles) and the MLL4 PCR primers (black arrows) are indicated. c, PCR analysis for conditional MLL4 knockout mice (exons 16, 17, 18, 19). Genomic DNA from sorted HSCs derived from WT and MLL4−/− mice (PolyIC treated as in a) and from mouse embryonic fibroblasts (MEFs) derived from MLL4f/f cells infected with a retrovirus expressing Cre or empty vector (EV) were analysed by PCR. The wild-type (258 base pairs (bp)) and floxed band (320 bp) were amplified with primers A and B, and the knockout band (390 bp) was amplified with primers A and C in different reactions. One of two independent genotyping experiments is shown. d, qPCR quantification of deletion efficiency in conditional knockout Cre-expressing cells. e, Whole bone-marrow cellularity 3 weeks after polyIC treatment of WTMxCre and MLL4f/f MxCre mice (referred to as WT and MLL4−/− respectively). f, Representative FACS profiles pre-gated on live cells showing LSKs, LT-HSCs and common lymphoid progenitors, and quantification of these bone-marrow populations (g–i) as well as B cells and myeloid cells (j) in the bone marrow. All bar graphs show mean ± s.d. of at least three independent experiments.
Extended Data Figure 2. Extramedullary haematopoiesis in the absence of MLL4.
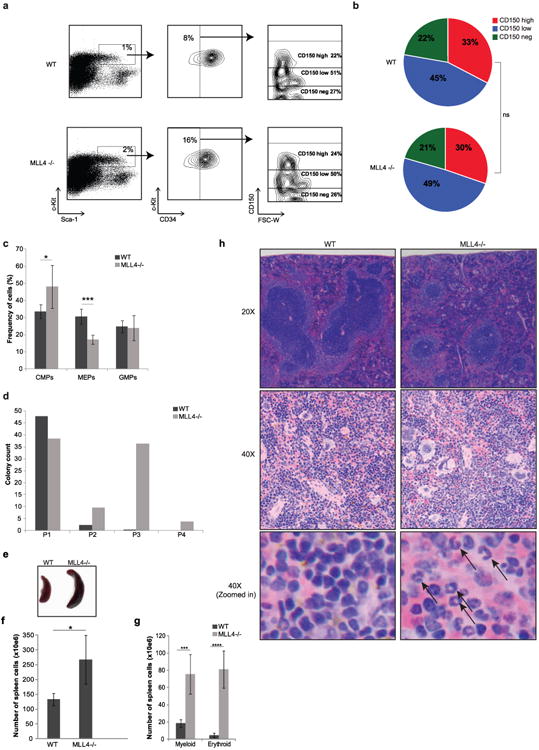
a, Representative FACS plot of LSKs separated based on CD34 and subsequently analysed by cell surface expression of CD150 (Slamf1). b, Pie charts summarize data from three independent mice of each genotype (χ2 test, P > 0.8). c, Frequency of cells determined by FACS analysis of Lin−Sca1+c-Kit− separated based on CD34 and FcγRII/III. CMPs, common myeloid progenitors; MEPs, megakaryocyte-erythroid progenitors; GMPs, granulocyte macrophage progenitors. Mean ± s.d. of three mice per group is shown. d, Quantification of colony numbers generated by WT and MLL4−/− myeloid progenitors (LSK) in serial colony forming assays; y axis, number of colonies; x axis, serial assay, primary to quaternary. e–g, Splenomegaly and increased numbers of myeloid and erythroid cells in the spleens of MLL4−/− mice 3 weeks after polyIC treatment. Image of spleen representative of more than three independent experiments. h, Haematoxylin and eosin staining of spleen (upper panel, ×20; middle panel; ×40; lower panel, magnified picture of the middle panel to visualize details). Black arrows show presence of erythrocytes in MLL4-deficient spleens. Images were acquired in one experiment.
Extended Data Figure 3. MLL4-deficient HSCs have impaired reconstitution capacity.
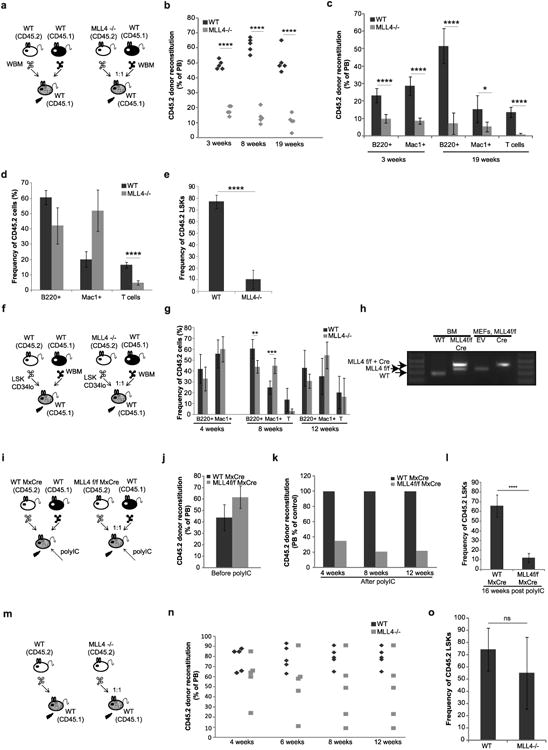
a–e, Whole bone-marrow (WBM) cells from WT or MLL4−/− mice (CD45.2) were mixed in 1:1 ratio with WT WBM (CD45.1) and transplanted into irradiated recipients (CD45.1). Reconstitution levels were monitored for 19 weeks after transplantation in the peripheral blood (PB) (b, c). d, Lineage distribution (B cells, myeloid-Mac1-positive cells and T cells) among remaining CD45.2 cells analysed in the peripheral blood 19 weeks after transplant. The total percentage of reconstitution as well as the frequency of the various lymphoid and myeloid subpopulations are severely diminished in the absence of MLL4 (c). However, among the few remaining MLL4−/− CD45.2-positive cells (d), there was a relatively higher frequency of myeloid cells and a diminished frequency of lymphoid cells. e, The frequency of donor-derived LSKs was determined in the bone marrow at week 19. Bar graphs show mean ± s.d. calculated from five mice of each genotype. f, Two hundred sort-purified LSK CD34lo cells (HSCs) from WT or MLL4−/− mice (CD45.2) were mixed with 500,000 WT WBM (CD45.1) and transplanted into irradiated recipients (CD45.1). g, Lineage distribution (B cells, myeloid-Mac1-positive cells and T cells) among remaining CD45.2 cells analysed in the peripheral blood at indicated time points. h, Genomic DNA derived from sorted bone marrow 14 weeks after transplant or from MEFs derived from MLL4f/f cells infected with a retrovirus expressing Cre or empty vector (EV) were analysed by PCR for MLL4 deletion. Genotyping was performed once with CD45.2+ cells pooled from the animals in each group at the end of the experiment (12weeks). i, WBM from WTMxCre or MLL4f/f MxCre mice (CD45.2) were mixed in 1:1 ratio with WT WBM (CD45.1) and transplanted into irradiated recipient mice (CD45.1). j, Reconstitution levels were monitored in the peripheral blood at 5weeks after transplantation and 1day before the beginning of treatment with polyIC. k, Reconstitution levels were monitored in the peripheral blood at 4–12 weeks after polyIC treatment. l, The frequency of donor-derived LSKs was determined in the bone marrow at week 16. Bar graphs show mean ± s.d. calculated from five mice of each genotype. m, For non-competitive bone-marrow transplants, WBM cells (CD45.2) from WT or MLL4−/− mice (that is, WT MxCre and MLL4f/f MxCre mice 3weeks after polyIC treatment) were transplanted into irradiated recipient mice (CD45.1). n, Reconstitution levels were monitored for 12 weeks after transplantation in the peripheral blood and the frequency of donor-derived LSKs (o) was determined in the bone marrow at week 16. Bar graphs show mean ± s.d. of five mice per group.
Extended Data Figure 4. MLL4 regulates the expression of genes in the glutathione- and FoxO-dependent pathways.

a, Representative FACs plots showing Ki-67 versus DAPI profiles in LSK CD34lo cells (left panel) and LSK cells (right panel). b, Summary of the cell-cycle profiles as in a for three independent mice per group. c, Schematic of division patterns of HSCs. d, Tie2 expression in bone-marrow CD150+CD48−CD41−Flt3−CD34− LSK cells from WT or MLL4−/− mice. e, Canonical pathways and biological processes over-represented within the 1,000 most downregulated genes in MLL4f/f MxCre (MLL4−/−) relative to WT MxCre (WT) sorted LSKs. f, GSEA shows enrichment of glutathione detoxification pathway in WT MxCre (WT) relative to MLL4f/f MxCre (MLL4−/−) LSKs (FDR < 0.1). g, RNA-seq read histograms at Txnip, Prdx1 and Ctsb. The x axis represents the linear sequence of genomic DNA; the y axis represents the reads per million aligned reads (RPM). The genomic scale in kilobase pairs (kbp) is indicated above the tracks. h, mRNA levels detected by qRT–PCR in purified HSCs of selected genes (Txnip, Prdx1 and Ctsb) that were downregulated in the absence of MLL4. i, GSEA plot shows downregulation of the FOXO1/3/4 positively regulated genes in MLL4f/f MxCre (MLL4−/−) LSKs (FDR < 0.1). j, LSK andLSK CD34locells from WT or MLL4−/− mice were stained with CellROX Deep Red Reagent to measure the levels of ROS. One representative of three experiments is shown.
Extended Data Figure 5. MLL4 is required for MLL–AF9 transformation in vivo and in vitro.
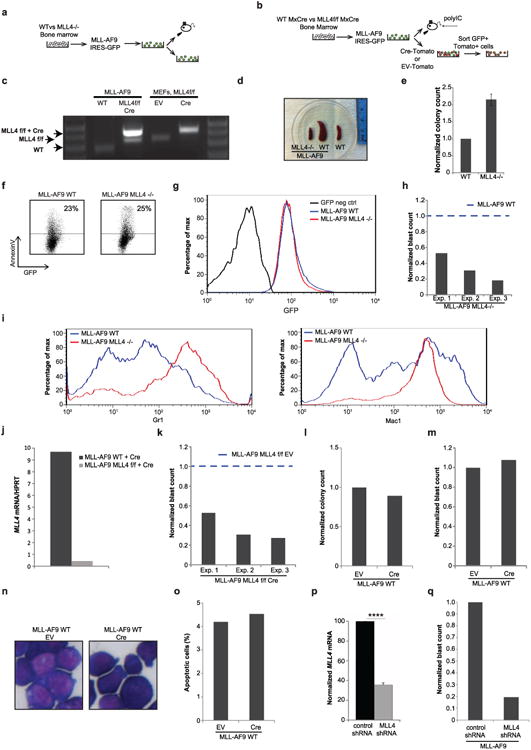
a, WT and MLL4−/− bone-marrow cells were transformed with MLL–AF9 and injected into irradiated recipients (650 rad) or maintained in culture for in vitro experiments. b, Non-polyIC-treated WTMxCre and MLL4f/f MxCre bone-marrow cells were transformed with MLL–AF9. Cells were subsequently infected with retrovirus containing Cre-recombinase (CRE-Tomato) or injected into mice that were administered polyIC 1 week later. c, PCR analysis of genomic DNA shows the extent of MLL4 deletion in MLL–AF9-infected cells. MLL4f/f and MLL4f/f Cre-infected MEFs were used as a control. Genotyping was performed once. d, Spleens from mice 29 days after injection with WT MLL–AF9 or MLL4−/− MLL–AF9 cells, and spleen from non-injected littermates (WT) (see also Fig. 2a–c). Photographs were taken in one experiment. e, Normalized colony counts scored 11 days after culture of WT or MLL4−/− whole bone marrow (non-transformed) in semi-solid media in the presence of IL3, IL6 and SCF. f, Representative FACS plots showing AnnexinV versus GFP staining in MLL–AF9 WT or MLL4−/− cells cultured in semi-solid media (as in a). g, Histogram of GFP expression 10 days after MLL–AF9 transformation. h, Frequency of cells identified as blasts evaluated from cytospin samples in Fig. 2d. Data are shown normalized to WT counts (dotted line) in three independent experiments. i, The morphological changes observed in MLL4-deficient MLL–AF9 cells are accompanied by increased expression of the myeloid markers Mac1 (right) and Gr1 (left). j, WT or MLL4f/f bone-marrow cells were transformed with MLL–AF9 and subsequently MLL4 was excised by retroviral expression of CRE as in b. Five days later, MLL4 mRNA levels were measured by qPCR. k, Frequency of cells identified as blasts in the cytospin samples in Fig. 2h. Data are shown normalized to WT counts (dotted line) in three independent experiments. l–o, WT bone-marrow cells were transformed with MLL–AF9 and subsequently infected with retroviruses expressing CRE (as in b). Blast colony counts (l), frequency of blasts evaluated by May-Grünwald-Giemsa stained cytospins (m, n) and frequency of apoptotic cells determined by morphology (o) were calculated after culture in semi-solid media supplemented with SCF, IL3 and IL6. Images of cytospins were acquired once. p, WT MLL–AF9 cells were stably infected with a retrovirus encoding an shRNA to target and silence MLL4 expression. shRNA depletion of MLL4 mRNA was measured by qPCR and normalized to levels in non-target control shRNA-infected cells. q, Frequency of cells identified as blasts in the cytospin samples from MLL4 shRNA-infected cells compared with control shRNA-infected cells.
Extended Data Figure 6. Genes associated with myeloid maturation are significantly upregulated after MLL4 deletion in cells transformed with MLL–AF9.

a, RNA-seq read histograms at the MLL4 exons 16–19 in MLL–AF9 MLL4f/f Cre and MLL–AF9 WT Cre cells. b, LSC Up gene set constitutes genes upregulated in the MLL–AF9 ‘leukemic stem cell’ self-renewal associated signature. GSEA plot demonstrates downregulation of LSC Up gene set in MLL–AF9 MLL4f/f-Cre cells (FDR < 0.1). c, LSC Down gene set constitutes genes downregulated in the MLL–AF9 ‘leukemic stem cell’ self-renewal associated signature. GSEA plot demonstrates upregulation of LSC Down gene set in MLL–AF9 MLL4f/f-Cre cells (FDR < 0.1). d–f, Comparison of RNA-seq read histograms at the genes Mpo (myeloperoxidase), Elane/Ela2 (neutrophil elastase) and Ctsg (cathepsin G) in MLL–AF9 MLL4f/f-Cre and MLL–AF9 WT Cre cells. The x axis represents the linear sequence of genomic DNA; the y axis represents the reads per million aligned reads (RPM). The genomic scale in kilobase pairs (kbp) is indicated above the tracks.
Extended Data Figure 7. Increased levels of DNA damage and ROS in MLL4-deficient cells transformed with MLL–AF9.
a, WT and MLL4−/− cells were stained with CellROX Deep Red Reagent to measure the levels of ROS after MLL–AF9 infection. b, The levels of phosphorylated Kap1 were determined by flow cytometry. One representative of at least three independent measurements is shown. c, Levels of aberrations (chromosome breaks, chromatid breaks and radial chromosomes) in metaphase spreads in two independent experiments derived from MLL–AF9 WT and MLL4−/− cells. d, Examples of chromosome aberrations. One representative of two experiments. e, High-throughput microscopy imaging of MLL4−/− (n = 90,679) and WT (n = 74,820) quantifies the percentage of cells with at least three γ-H2AX foci. On average, 1.3 and 5.9 foci per cell were observed in WT and MLL4−/− MLL–AF9 cells, respectively. f–j, After infection with MLL–AF9, MLL4-deficient cells were expanded in semi-solid media in the presence or absence of the antioxidants NAC or catalase. f, Normalized colony counts with or without catalase treatment. Data show mean ± s.d. of three independent experiments. g, Frequency of cells identified as blasts with or without NAC in the cytospins of Fig. 3e. Data are shown normalized to WT counts (dotted line) in two independent experiments. h, Frequency of blasts with or without catalase treatment were quantified on the basis of morphology. i, j, NAC or catalase treatment reduces the levels of phosphorylated Kap1 in MLL4-deficient MLL–AF9 cells. The two different treatments (NAC, catalase) and controls (red and black lines) were performed in the same experiment but controls are plotted separately in i and j for simplicity. k, Bone-marrow cells from MLL4f/f MxCre mice (without polyIC treatment) were collected 4 days after 5-FU treatment and infected with a retrovirus containing MLL–AF9. After expansion in semi-solid media, cells were injected into mice that were subsequently (1 week later) administered polyIC to excise MLL4 in vivo. One group of mice was fed with NAC in the drinking water starting 1 week before the injection of the transformed cells. Two out of five animals treated with NAC died (both animals displayed elevated white blood cell counts at time of death) and none of the untreated mice died (and all had normal white blood cell counts). Survival curves were determined at the indicated time points; n = 5 mice per group. l–n, MLL4−/− bone-marrow cells were co-transformed with MLL–AF9-neo and either empty vector or retroviruses encoding FOXO3-IRES–GFP. One week after selection in G418, GFP+ cells were sorted, then cultured ex vivo. m, GSEA plot demonstrates that FOXO complementation reversed upregulation of LSC Down gene set in MLL4f/f-Cre MLL–AF9 cells (FDR < 0.1). n, Cells were stained with CellROX Deep Red Reagent to measure the levels of ROS. One representative of two independent measurements is shown.
Extended Data Figure 8. H2O2 treatment, ATM-, BRCA1-deficiency or ATM and ATR inhibition leads to myeloid differentiation of cells transformed with MLL–AF9 ex vivo.
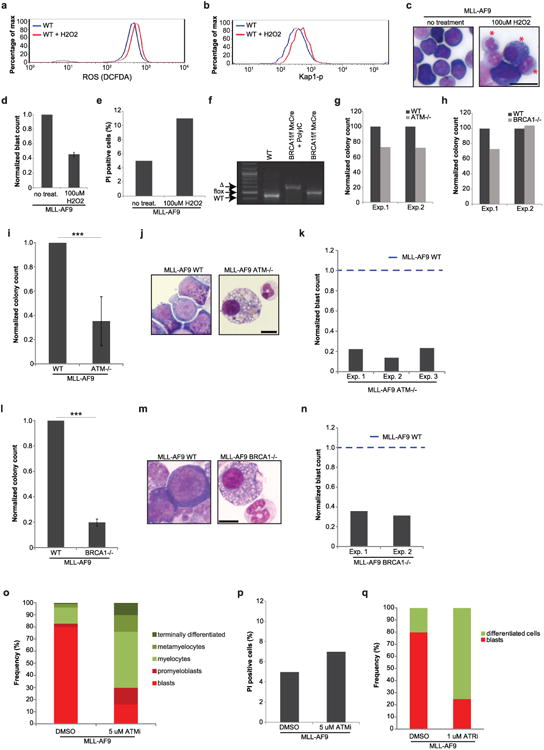
a–e, WT cells transformed with MLL–AF9 (Extended Data Fig. 5a) and expanded in semi-solid media. Cells were treated with 100 μM H2O2 and the levels of ROS detected by DCF-DA staining (a) and phosphorylated Kap1 (b) were determined 48 h after treatment. One representative of two independent experiments is shown. The number of cells with blast morphology (c) was quantified 48 h after treatment (d). Red stars in (c) indicate cells with morphological changes characteristic of differentiation; images of one out of two independent experiments. The same WT controls were used in Fig. 2d. Bar graph shows mean ± s.d. of two independent measurements. e, Bar graph shows the frequency of propidium iodide (PI)-positive cells 48 h after 100 μM H2O2 treatment. f, Genomic DNA was extracted from WT and BRCA1f/f MxCre bone-marrow cells from mice treated or not with polyIC. Detection of the WT-, deleted- and floxed alleles of BRCA1 are indicated. g, h, Whole bone-marrow cells of the indicated genotypes were cultured in methylcellulose media supplemented with IL3, IL6 and SCF and the colony numbers were scored between days 8 and 10. WT or ATM−/− cells were transformed with MLL–AF9 as shown in Extended Data Fig. 5a, and blast colony counts (i) and morphology in methylcellulose, May-Grünwald–Giemsa stains (j) were determined 10 days later; images of one out of three experiments. Bar graph shows mean ± s.d. of four independent experiments. k, The frequency of cells identified as blasts in (j) was determined. Data are shown normalized to WT counts (dotted line) in three independent experiments. l–n, Three weeks after polyIC treatment of WTMxCre and BRCA1f/f MxCre mice, bone-marrow cells were transformed with MLL–AF9, and blast colony counts (l) and colony morphology (m) were assessed at day 10 after transformation (images of one out of two experiments). Bar graph shows mean ± s.d. of three independent experiments. n, The frequency of cells identified as blasts is shown normalized to WT counts (dotted line) in two independent experiments. o, WT cells transformed with MLL–AF9 (as in Extended Data Fig. 5a) were expanded in semi-solid media, treated with 5 μM of ATMi or vehicle for 48 h, and the frequency of blasts and cells at different stages of differentiation was determined by morphology. p, Cells transformed with MLL–AF9 were treated with 5 μM of ATMi for 48 h, and the frequency of propidium iodide (PI)-positive cells is plotted. q, Cells transformed with MLL–AF9 were treated with 1 μM of ATRi for 24–48 h and the frequency of blasts was determined. One of two representative experiments is shown. Scale bars, 10 μm.
Extended Data Figure 9. ROS and DNA damage in ATM- and BRCA1-deficient cells transformed with MLL–AF9.

a, b, WT and ATM−/− cells were transformed with MLL–AF9 and the levels of phosphorylated Kap-1 (a) and ROS (detected by staining cells with CellROX Deep Red reagent) (b) were measured 10 days after expansion in semi-solid media. c, d, WT and BRCA1−/− bone-marrow cells were transformed with MLL–AF9 and the levels of phosphorylated Kap1 (c) and ROS (d) were measured 10 days after expansion in semi-solid media. One representative of two independent experiments is shown.
Extended Data Figure 10. DNA damage induces p21-dependent differentiation of cells transformed with MLL–AF9.
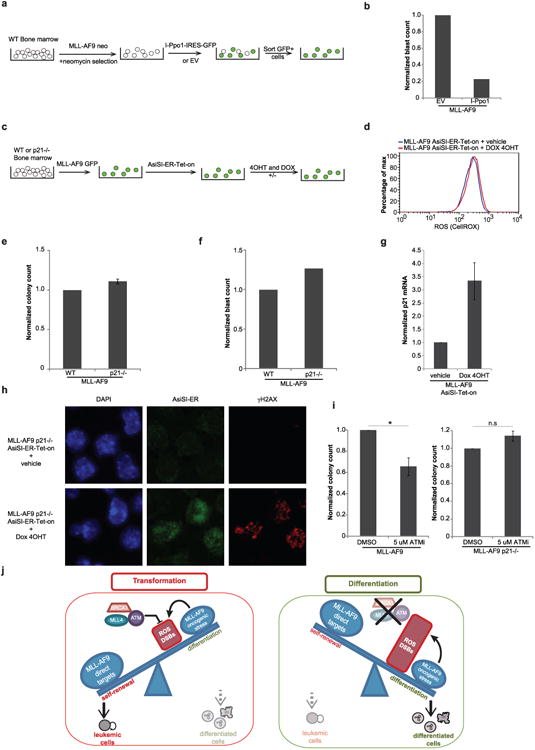
a, b, WT cells were transformed with MLL–AF9-neo. After 2 weeks of selection in neomycin-supplemented media, cells were infected with retroviruses expressing I-Ppo1 or empty vector. b, Eight to ten days after sorting GFP+ cells, the frequency of I-Ppo1 infected cells identified as blasts in the cytospins of Fig. 4d was determined and normalized to the frequency of blasts in empty vector infected cells. c, d, WT cells were transformed with MLL–AF9 and then were infected with a retrovirus containing the inducible restriction enzyme AsiSI-ER-Tet-on. After selection, cells were treated with 4OHT and doxocycline for 24 h and the levels of ROS were measured by CellROX staining. e, f, WT or p21−/− cells were transformed with MLL–AF9. Colony counts (e) and frequency of blasts (morphology in May-Grünwald–Giemsa stains) (f) were determined 8–10 days later. g, h, WT or p21−/− cells were transformed with MLL–AF9 and then infected with a retrovirus containing the restriction enzyme AsiSI. g, After selection, cells were treated with 4OHT and doxocycline for 24 h and the levels of p21 mRNA were measured in WT cells by RT–qPCR. h, p21−/− cells containing AsiSI were treated with 4OHT and doxocycline for 24 h, and γ-H2AX foci (red) and AsiSi-ER staining (green) were examined by immunofluorescence (images of one out of two experiments). i, The number of colonies in WT and p21−/− MLL–AF9 cells 5–7 days after treatment with ATMi. j, Model showing that genome caretakers MLL4, ATM and BRCA1 prevent differentiation by protecting against ROS and DSBs.
Acknowledgments
We thank all members of the A. Nussenzweig laboratory, J. Daniel and P. Love for discussions; L. Granger for flow cytometry; M. J. Kruhlak for microscopy; K. Zhao for RNA sequencing; R. Anderson and K. Smith for animal care; K. Naka for the FOXO3 retrovirus; G. Legube for the pBABE-AsiSI-ER plasmid; J. Zuber for pLEPG and pRT3GEPIR plasmids; O. Fernandez-Capetillo for ATRi; and S. John for suggestions. S.A.A. was supported by the Leukemia and Lymphoma Society and National Cancer Institute grants CA66996 and CA140575. This work was supported by the Intramural Research Program of the National Institutes of Health, the National Cancer Institute and the Center for Cancer Research, and an Ellison Medical Foundation Senior Scholar in Aging Award to A.N.
Footnotes
Online Content: Methods, along with any additional Extended Data display items and Source Data, are available in the online version of the paper; references unique to these sections appear only in the online paper.
Author Contributions: M.A.S., R.B.F., P.D.A., S.A.A. and A.N. participated in the study design. M.A.S., A.V.E., A.M.D., A.M., N.F., H.C. and N.W. performed mouse breeding, HSC analysis, transplantation and leukaemia experiments, and analysed data. R.B.F. performed computational experiments. E.C. led the genome stability experiments and analysed data. A.C. generated and performed experiments with AsiSI-ER-Tet-on and MLL4 shRNA and qPCR. P.G.-M. and D.J.R. supervised HSC experiments and performed serial colony assays; S.S. supervised flow cytometry. J.-E.L. and K.G. generated targeting vector and MLL4-deficient mice. K.I. performed the in vitro immunophenotypic division assay. M.O. quantified colony morphology in cytospins. A.D. generated and tested MLL–AF9 vectors. M.A.S. and A.N. wrote the manuscript and all authors reviewed it. A.N. supervised the project.
Author Information: Data sets have been deposited in the Gene Expression Omnibus under accession number GSE57147.
The authors declare no competing financial interests.
Readers are welcome to comment on the online version of the paper.
References
- 1.Magee JA, Piskounova E, Morrison SJ. Cancer stem cells: impact, heterogeneity, and uncertainty. Cancer Cell. 2012;21:283–296. doi: 10.1016/j.ccr.2012.03.003. [DOI] [PMC free article] [PubMed] [Google Scholar]
- 2.Nijnik A, et al. DNA repair is limiting for haematopoietic stem cells during ageing. Nature. 2007;447:686–690. doi: 10.1038/nature05875. [DOI] [PubMed] [Google Scholar]
- 3.Rossi DJ, et al. Deficiencies in DNA damage repair limit the function of haematopoietic stem cells with age. Nature. 2007;447:725–729. doi: 10.1038/nature05862. [DOI] [PubMed] [Google Scholar]
- 4.Tothova Z, et al. FoxOs are critical mediators of hematopoietic stem cell resistance to physiologic oxidative stress. Cell. 2007;128:325–339. doi: 10.1016/j.cell.2007.01.003. [DOI] [PubMed] [Google Scholar]
- 5.Morin RD, et al. Frequent mutation of histone-modifying genes in non-Hodgkin lymphoma. Nature. 2011;476:298–303. doi: 10.1038/nature10351. [DOI] [PMC free article] [PubMed] [Google Scholar]
- 6.Pasqualucci L, et al. Analysis of the coding genome of diffuse large B-cell lymphoma. Nature Genet. 2011;43:830–837. doi: 10.1038/ng.892. [DOI] [PMC free article] [PubMed] [Google Scholar]
- 7.Krivtsov AV, Armstrong SA. MLL translocations, histone modifications and leukaemia stem-cell development. Nature Rev Cancer. 2007;7:823–833. doi: 10.1038/nrc2253. [DOI] [PubMed] [Google Scholar]
- 8.Jude CD, et al. Unique and independent roles for MLL in adult hematopoietic stem cells and progenitors. Cell Stem Cell. 2007;1:324–337. doi: 10.1016/j.stem.2007.05.019. [DOI] [PMC free article] [PubMed] [Google Scholar]
- 9.Somervaille TC, Cleary ML. Grist for the MLL: how do MLL oncogenic fusion proteins generate leukemia stem cells? Int J Hematol. 2010;91:735–741. doi: 10.1007/s12185-010-0579-8. [DOI] [PubMed] [Google Scholar]
- 10.Lawrence MS, et al. Discovery and saturation analysis of cancer genes across 21 tumour types. Nature. 2014;505:495–501. doi: 10.1038/nature12912. [DOI] [PMC free article] [PubMed] [Google Scholar]
- 11.Lee JE, et al. H3K4 mono- and di-methyltransferase MLL4 is required for enhancer activation during cell differentiation. eLife. 2013;2:e01503. doi: 10.7554/eLife.01503. [DOI] [PMC free article] [PubMed] [Google Scholar]
- 12.Ito K, et al. APML-PPAR-δ pathway for fatty acid oxidation regulates hematopoietic stem cell maintenance. Nature Med. 2012;18:1350–1358. doi: 10.1038/nm.2882. [DOI] [PMC free article] [PubMed] [Google Scholar]
- 13.Yamamoto R, et al. Clonal analysis unveils self-renewing lineage-restricted progenitors generated directly from hematopoietic stem cells. Cell. 2013;154:1112–1126. doi: 10.1016/j.cell.2013.08.007. [DOI] [PubMed] [Google Scholar]
- 14.Kops GJ, et al. Forkhead transcription factor FOXO3a protects quiescent cells from oxidative stress. Nature. 2002;419:316–321. doi: 10.1038/nature01036. [DOI] [PubMed] [Google Scholar]
- 15.Sykes SM, et al. AKT/FOXO signaling enforces reversible differentiation blockade in myeloid leukemias. Cell. 2011;146:697–708. doi: 10.1016/j.cell.2011.07.032. [DOI] [PMC free article] [PubMed] [Google Scholar]
- 16.Krivtsov AV, et al. Transformation from committed progenitor to leukaemia stem cell initiated by MLL–AF9. Nature. 2006;442:818–822. doi: 10.1038/nature04980. [DOI] [PubMed] [Google Scholar]
- 17.Bernt KM, et al. MLL-rearranged leukemia is dependent on aberrant H3K79 methylation by DOT1L. Cancer Cell. 2011;20:66–78. doi: 10.1016/j.ccr.2011.06.010. [DOI] [PMC free article] [PubMed] [Google Scholar]
- 18.Owusu-Ansah E, Banerjee U. Reactive oxygen species prime Drosophila haematopoietic progenitors for differentiation. Nature. 2009;461:537–541. doi: 10.1038/nature08313. [DOI] [PMC free article] [PubMed] [Google Scholar]
- 19.Wang J, et al. A differentiation checkpoint limits hematopoietic stem cell self-renewal in response to DNA damage. Cell. 2012;148:1001–1014. doi: 10.1016/j.cell.2012.01.040. [DOI] [PubMed] [Google Scholar]
- 20.Bae I, et al. BRCA1 induces antioxidant gene expression and resistance to oxidative stress. Cancer Res. 2004;64:7893–7909. doi: 10.1158/0008-5472.CAN-04-1119. [DOI] [PubMed] [Google Scholar]
- 21.Gorrini C, et al. BRCA1 interacts with Nrf2 to regulate antioxidant signaling and cell survival. J Exp Med. 2013;210:1529–1544. doi: 10.1084/jem.20121337. [DOI] [PMC free article] [PubMed] [Google Scholar]
- 22.Ito K, et al. Reactive oxygen species act through p38 MAPK to limit the lifespan of hematopoietic stem cells. Nature Med. 2006;12:446–451. doi: 10.1038/nm1388. [DOI] [PubMed] [Google Scholar]
- 23.Argast GM, Stephens KM, Emond MJ, Monnat RJ., Jr I-PpoI and I–CreI homing site sequence degeneracy determined by random mutagenesis and sequential in vitro enrichment. J Mol Biol. 1998;280:345–353. doi: 10.1006/jmbi.1998.1886. [DOI] [PubMed] [Google Scholar]
- 24.Iacovoni JS, et al. High-resolution profiling of cH2AX around DNA double strand breaks in the mammalian genome. EMBO J. 2010;29:1446–1457. doi: 10.1038/emboj.2010.38. [DOI] [PMC free article] [PubMed] [Google Scholar]
- 25.Inomata K, et al. Genotoxic stress abrogates renewal of melanocyte stem cells by triggering their differentiation. Cell. 2009;137:1088–1099. doi: 10.1016/j.cell.2009.03.037. [DOI] [PubMed] [Google Scholar]
- 26.Halazonetis TD, Gorgoulis VG, Bartek J. Anoncogene-induced DNA damage model for cancer development. Science. 2008;319:1352–1355. doi: 10.1126/science.1140735. [DOI] [PubMed] [Google Scholar]
- 27.Schoppy DW, et al. Oncogenic stress sensitizes murine cancers to hypomorphic suppression of ATR. J Clin Invest. 2012;122:241–252. doi: 10.1172/JCI58928. [DOI] [PMC free article] [PubMed] [Google Scholar]
- 28.Kueh HY, Champhekar A, Nutt SL, Elowitz MB, Rothenberg EV. Positive feedback between PU.1 and the cell cycle controls myeloid differentiation. Science. 2013;341:670–673. doi: 10.1126/science.1240831. [DOI] [PMC free article] [PubMed] [Google Scholar]
- 29.Celeste A, et al. Histone H2AX phosphorylation is dispensable for the initial recognition of DNA breaks. Nature Cell Biol. 2003;5:675–679. doi: 10.1038/ncb1004. [DOI] [PubMed] [Google Scholar]
- 30.Callen E, et al. ATM prevents the persistence and propagation of chromosome breaks in lymphocytes. Cell. 2007;130:63–75. doi: 10.1016/j.cell.2007.06.016. [DOI] [PubMed] [Google Scholar]
- 31.Chiang MY, et al. Leukemia-associated NOTCH1 alleles are weak tumor initiators but accelerate K-ras-initiated leukemia. J Clin Invest. 2008;118:3181–3194. doi: 10.1172/JCI35090. [DOI] [PMC free article] [PubMed] [Google Scholar]
- 32.Toledo LI, et al. A cell-based screen identifies ATR inhibitors with synthetic lethal properties for cancer-associated mutations. Nature Struct Mol Biol. 2011;18:721–727. doi: 10.1038/nsmb.2076. [DOI] [PMC free article] [PubMed] [Google Scholar]
- 33.Tang F, et al. RNA-seq analysis to capture the transcriptome landscape of a single cell. Nature Protocols. 2010;5:516–535. doi: 10.1038/nprot.2009.236. [DOI] [PMC free article] [PubMed] [Google Scholar]
- 34.Trapnell C, Pachter L, Salzberg SL. TopHat: discovering splice junctions with RNA-seq. Bioinformatics. 2009;25:1105–1111. doi: 10.1093/bioinformatics/btp120. [DOI] [PMC free article] [PubMed] [Google Scholar]
- 35.Gentleman RC, et al. Bioconductor: open software development for computational biology and bioinformatics. Genome Biol. 2004;5:R80. doi: 10.1186/gb-2004-5-10-r80. [DOI] [PMC free article] [PubMed] [Google Scholar]
- 36.Ashburner M, et al. Gene ontology: tool for the unification of biology. The Gene Ontology Consortium. Nature Genet. 2000;25:25–29. doi: 10.1038/75556. [DOI] [PMC free article] [PubMed] [Google Scholar]
- 37.Vastrik I, et al. Reactome: a knowledge base of biologic pathways and processes. Genome Biol. 2007;8:R39. doi: 10.1186/gb-2007-8-3-r39. [DOI] [PMC free article] [PubMed] [Google Scholar]
- 38.Cerami EG, et al. Pathway Commons, a web resource for biological pathway data. Nucleic Acids Res. 2011;39:D685–D690. doi: 10.1093/nar/gkq1039. [DOI] [PMC free article] [PubMed] [Google Scholar]
- 39.Benjamini Y, Hochberg Y. Controlling the False discovery rate: a practical and powerful approach to multiple testing. J R Stat Soc B. 1995;57:289–300. [Google Scholar]
- 40.Smyth GK. Linear models and empirical Bayes methods for assessing differential expression in microarray experiments. Stat Applic Genet Molec Biol. 2004;3:3. doi: 10.2202/1544-6115.1027. [DOI] [PubMed] [Google Scholar]