

Abstract
Optical coherence elastography (OCE) represents the frontier of optical elasticity imaging techniques and focuses on the micro-scale assessment of tissue biomechanics in 3D that is hard to achieve with traditional elastographic methods. Benefit from the advancement of optical coherence tomography, and driven by the increasing requirements in nondestructive biomechanical characterization, this emerging technique recently has experienced a rapid development. In this paper, we start with the description of the mechanical contrast that has been employed by OCE and review the state-of-the-art techniques based on the reported applications and discuss the current technical challenges, emphasizing the unique role of OCE in tissue mechanical characterization.
The position of OCE among other elastography techniques.

Keywords: optical coherence elastography, optical coherence tomography, tissue characterization, biomechanics, strain, natural frequency, Young’s modulus, elastic wave
1. Introduction
The mechanical property of tissue has been widely used as an important parameter for tissue characterization [1] as many of the pathological and physiological changes involve the alteration of tissue biomechanics [2]. Careful quantification of the changes in biomechanical properties can provide a way for early diagnosis and improved treatment of various diseases and lead to a better understanding of different physiological conditions of cells, tissues and organs. For example, tumors are generally stiffer than the normal surrounding tissues [3], which enables elastographic imaging techniques to capture the initial signs of tumorigenesis [4, 5]. In ophthalmology, the monitoring of the corneal biomechanics could help to optimize and customize the procedures of refractive surgery, e.g. Laser-Assisted in situ Keratomileusis [6, 7]. Nanoscale assessment of the spatiotemporal elasticity distribution of the beating cardiac cells allows relating the structure and the function of the cardiomyocytes [8]. A list of the reported alternations in elastic characteristics (Young’s modulus) associated with the change in tissue pathology and physiology is outlined in Table 1 with the measurement scales from cell level to organ level.
Table 1.
Reported difference in Young’s moduli of cells, tissues, and organs caused by the pathological or physiological changes.
| Tissue Type | Tissue Condition | Young’s Modulus (Pa) |
|---|---|---|
| Cornea (Human) [10] | Normal | 1.3×10⁶ |
| Collagen cross-linking | 5.9×10⁶ | |
| Anterior Lens Capsule (Human) [11] | Normal | 485.8×10³ |
| Cataract | 416.2×10³ | |
| Lens nucleus (Human) [12] | Middle age (about 40 years old) | 5.2×10³ |
| Old age (63-70 years old) | 10.6×10³ | |
| Liver (Human) [13] | Normal | 4-6×10³ |
| Septal fibrosis | 8-12.5×10³ | |
| Breast tissue (Human) [14] | Fat | 5-10×103 |
| Parenchyma | 30×103 | |
| Benign lesions | 55×103 | |
| Malignant lesions | 179×103 | |
| Cartilage (Human) [15] | Under the temperature of 50 Celsius | 80×103 |
| Under the temperature of 80 Celsius | 16×103 | |
| Skin (Human) [16] | Younger (3-30 years old) | 4.2×10⁵ |
| Older (30-89 years old) | 8.5×10⁵ | |
| Skeletal muscle (Human) [17] | Relaxation | 40.6×10³ |
| Contraction | 258.1×10³ | |
| Aortic wall (Human) [18] | Non-fibrous | 41.2×10³ |
| Fibrous | 81.7×10³ | |
| Calcified | 354.5×10³ | |
| Cardiac cell (Rat) [8] | Systolic | 26.2×10³ |
| Diastolic | 7.8×10³ | |
| Breast epithelial cell (Human) [19] | Benign | 1161 |
| Malignant | 616 | |
| Erythrocytes (Human) [20] | Normal | l.lx103 |
| Sickle | 3.05×10³ |
Uniaxial mechanical tensile and compression tests, relying on the precise measurement of the relationship between the stress and the resulted strain [9], have been used as the gold standard of mechanical characterization. However, the testing procedure is generally destructive. The structural and functional properties of soft delicate tissues are difficult to be maintained during the measurement. Also, in situ assessment of biomechanical properties is generally impossible using this method.
In 1980, noninvasive biomechanical assessment of the rheological properties of human soft tissues using ultrasound - termed “elastography” - was proposed [21]. Based on the stimulation with the acoustic radiation force, the displacement of tissue or the propagation of the tissue deformation is captured and analysed with ultrasonic imaging (UI) techniques and used to reconstruct the tissue biomechanics [22-24]. More recently, magnetic resonance elastography (MRE), based on the phase-contrast magnetic resonance imaging (MRI) that measures the mechanically-induced propagating acoustic waves in tissue, was demonstrated [25]. Together with ultrasound elastography (UE), both of these techniques have been extensively developed and applied for clinical use in cancer detection in vivo [26, 27]. However, limited by the spatial resolving ability of UI and MRI, and also dependent on the measurement SNR of the tissue displacement, the spatial scales of UE and MRE for elasticity imaging remain at macroscopic level with the organ-size field of view and the typical resolution of hundreds of micrometres and several millimetres, respectively [28-31]. Alternatively, elastography methods based on atomic force microscopy (AFM) can probe the mechanical properties of single cell through applying nano-scale indention [32]. As an elasticity imaging system, AFM is able to provide the contact force at the level of sub-nanoNewton to load the cell membrane and measures the induced deformation with sub-nanometre accuracy. Such capability has enabled AFM elastography to contribute to various studies in cell mechanics and cell biology [33]. For example, high-resolution (1-5 nm) mapping of the mechanical heterogeneities allows this technique for the detection of cell pathologies [34]. However, AFM elastography has been mainly applied for the cultured cells due to the limited field of view and the measurement procedure [35].
Since different spatial scales of mechanical assessment are essential for the understanding of various physiological states and the detection of particular tissue pathologies [36, 37], it is of great importance to have the imaging technique that fills the gap of the imaging scales between ultrasound/MR elastography (organ level) and AFM elastography (cellular level). Elastographic methods based on several optical imaging techniques, including laser speckle imaging [38], multiphoton microscopy [39], confocal Brillouin microscopy [40], and optical coherence tomography (OCT) [41] have been recently developed to meet this demand. Among these, OCT is a three-dimensional imaging modality with micro-scale spatial resolution and millimetre-scale imaging depth in scattering tissues, which enables its clinical applications in many areas, such as ophthalmology and cardiology [42, 43].
OCT elastography, also termed as optical coherence elastography (OCE), introduced by Schmitt in 1998 [44], was first used to assess the tissue biomechanics through the measurement of localized deformation and strain inside the sample. OCE generally relies on an external or internal stimulation approach to load the tissue and an OCT-based detection method to measure the corresponding tissue response [45-47]. The early development of OCE features the static mechanical contact loading and the cross-correlation-based speckle tracking to capture the displacement [48-51]. The emerging of phase-resolved OCT detection utilizing the interferometric phase information from complex OCT signals, which reaches nanoscale and sub-nanoscale sensitivity to the tissue displacement [52-54], enabled OCE techniques to assess and extract different parameters of the tissue deformation with high accuracy to reconstruct the tissue biomechanical properties [55-59]. Also, the development of OCE for different types of applications results in various loading approaches that have been proposed, such as the use of ultrasound for remote stimulation [56, 60, 61], the employment of air puff for noncontact excitation [62-64], and applying magnetomotive nanoparticles as the internal transducers for vibration [57, 65, 66]. Reinforced from the high spatial resolution of OCT, the imaging or measurement resolution of OCE is spreading over the range from several microns to hundreds of microns depending on the methods used to reconstruct the biomechanical properties [67-71]. Generally, OCE maintains the same or even larger field of view compared with OCT at the millimetre level [72, 73]. Figure 1 indicates the position of OCE among various nondestructive elasticity imaging and measurement techniques with respect to the spatial scale of mechanical assessment (according to the information collected from [28-30, 39, 40, 67-71, 73-80]). In term of the spatial resolution and the field of view, it can be clearly seen that OCE fills well in the gap among the traditional elastographic methods and thus has the potential to make great impacts on the mechanical characterization of tissue.
Figure 1.

The position of OCE among various nondestructive elasticity imaging and measurement techniques in terms of the scale of detection. AFM: atomic force microscopy; OT: optical tweezers [80]; MPM: multiphoton microscopy; CBM: confocal Brillouin microscopy; LSI: laser speckle imaging; UE: ultrasound elastography; HI: holographic imaging [78]; MRE: magnetic resonance elastography.
Motivated by the unique role of OCE in biomechanical characterization, this paper aims at providing a reference for the researchers in the relevant fields through the review of the state-of-the-art techniques and the current existing challenges in OCE. A recent review article of this topic from Kennedy et al. has characterized the major OCE methods mainly from the aspect of the development strategies, including the methods of mechanical loading and displacement estimation [47]. Building on this thorough work, this review will primarily focus on the discussion from the application point of view, together with the description of the basic mechanical contrast in OCE, as we believe that the field of OCE is coming to the phase where specific applications will drive the further shaping and advancement of particular methods, reflected in the way of how the current mechanical contrast is employed.
Based on the parameters that are used to obtain the qualitative or quantitative tissue mechanical properties, current OCE techniques can be divided into three major categories: the measurement of displacement amplitude or strain, the assessment of natural or resonant frequency, and the characterization of elastic wave propagation. In this paper, we will first describe these three types of mechanical contrast employed by OCE, indicating how the mechanical contrast is utilized in the OCE methods for biomechanical imaging and assessment. Based on this, we will then discuss the state-of-the-art OCE techniques with respect to the reported applications in clinical and pre-clinical environment, highlighting the special features that OCE brings to the particular biomedical areas that require mechanical characterization. In the final section, we will discuss our perspectives on the current technical challenges in OCE. Throughout the review, we emphasize that OCE can be potentially used as an essential tool to improve the diagnosis and treatment of diseases and to assist the research and studies of tissue functional properties.
2. Mechanical contrast in OCE
The contrast in biomechanical imaging largely relies on the models from classical mechanics that characterize the motion or deformation upon the mechanical disturbance [81, 82]. The specific characteristics of the sample response to the static or dynamic loading determine the parameters for measurement, and the relationship between these parameters and the tissue biomechanical properties (e.g. elastic modulus) results in the mechanical contrast in OCE. In this section, we categorize the characteristics of mechanical response utilized by OCE into three major groups, and describe the mechanical models that relate them to the tissue elastic properties. Because biological tissues are highly complicated objects, mainly reflected in their inhomogeneity as composed of various essential constituents (both fluids and solids) in different ways [83], proper assumptions are needed to simplify the theoretical models in order to yield quantitative information about tissue biomechanics. The advantages and disadvantages of the three types of mechanical contrast in OCE are also briefly commented.
2.1 Displacement amplitude or strain
As an analogy to the uniaxial compression test [9], OCE methods that employ the displacement amplitude or strain as the mechanical contrast basically rely on the definition of Young’s modulus under one-dimensional Hooke’s law [81]. Modelling the biological tissue as isotropic elastic solid, within the elastic region, Hooke’s law defines a linear relationship between the stress applied to the sample and the resulted strain. Here, the stress σ equals the ratio of the applied loading force F to the cross-sectional area A of the sample that is directly loaded, expressed as σ = F / A. The strain ε is the quantification of the sample deformation, which can be written as ε = ΔL / L, where ΔL is the magnitude of the deformation and L is the original length of the sample. Based on Hooke’s law, the slope of the linear relationship is the characteristic of the sample’s elasticity, termed Young’s modulus E , with the mathematical expression of
| (1) |
Young’s modulus is a direct measure of the sample stiffness. A larger value of Young’s modulus reveals a higher stiffness of the sample. Thus, with the uniform stress applied, the detection of the strain ε or the deformation amplitude ΔL creates the contrast among different parts of the sample that have distinct stiffness or elastic properties. A typical example is shown in Figure 2 with both the experimental and simulation data from a silicone inclusion phantom. The mechanical contrast between the inclusion and the surroundings can be seen based on the mapping of the relative displacement and the strain.
Figure 2.

Experimental and simulation results from a silicone inclusion phantom showing the displacement field and strain field inside the sample (measured by OCE) in response to a compression loading. (a), (c) and (e) are from experimental measurements; (b), (d) and (f) are from simulations. (a) and (b) are OCT structural images; (c) and (d) are displacement fields; (e) and (f) are strain fields. (g), (h) and (i) are A-scan plots of the OCT signal, relative displacement, and strain, respectively, from experiments (blue) and simulations (red). Adapted from Ref. [100].
The mechanical contrast with displacement amplitude or strain has enabled compression or bulk-modulated OCE methods with both static/quasi-static [49, 50, 67, 84-87] and dynamic configurations [55, 72, 88-92] as well as also the recently introduced “needle OCE” technique [93, 94]. The displacement of the sample has been mainly obtained with either OCT speckle-tracking method [48, 95, 96] or phase-resolved OCT approach [89, 97], where the latter one has brought significantly improved imaging quality in compression OCE due to its superior sensitivity to the tissue displacement [54]. Particularly for dynamic loading, a method based on measuring the spread of the Doppler spectrum has been demonstrated having better accuracy than phase-resolved detection for quantifying the deformation amplitude from the positions with low OCT signal SNR [98]. For the assessment of local strain from the displacement, higher sensitivity and better contrast can be achieved with weighted least-squares fitting of the data [99].
To have this mechanical contrast be effective, meaning the strain or the amplitude of deformation inversely proportional to the tissue Young’s modulus, it needs to be assumed that the applied stress over the area of interest from the biological sample is uniform. This further relies on the assumption that the tissue is isotropic homogenous [68]. Also, the viscous property of the sample is assumed to be negligible from the tissue response to the mechanical loading. Because the stress is unknown throughout the sample, current OCE techniques employing this type of mechanical contrast generally remain qualitative, however, with relatively higher spatial resolution that is equal or close to the one of OCT structural imaging [68]. This particular mechanical contrast in OCE has recently been studied with numerical simulations [100], and theoretical work has shown the non-uniformity of the stress distribution in the sample with heterogeneous elasticity [68], causing imaging artefacts in the resulted elastogram, as shown in the region surrounding the inclusion in Figure 2. Such studies point out an important direction for improved OCE that employs displacement amplitude or strain as the mechanical contrast, and also imply the potential approaches towards quantitative elasticity imaging.
2.2 Natural or resonant frequency
Empirical viscoelastic models, such as the Kelvin-Voigt model and the Maxwell model, have been widely used to describe the mechanical behaviour of biological tissues [82]. Based on the one-dimensional Hooke’s law with linear stress-strain relationship, linear spring can be used to simulate the linearly elastic material with the spring constant as the measure of the sample stiffness [82]. Taking the Kelvin-Voigt body as an example, the biological tissue can be modelled as a parallel combination of a linear spring and a dashpot that are representing the elastic and the viscous properties of the tissue sample, respectively. For an underdamped harmonic oscillator [101], the relationship between the loading force F(t) and the resulted displacement x(t) of the sample can be written as a second order differential equation,
| (2) |
where m is the mass of the sample, R is the coefficient of viscosity, and k is the spring constant. By solving this equation, one can obtain the displacement profile x(t) and the natural fluency f as
| (3) |
| (4) |
where B is the amplitude of displacement and φ is the phase factor of the oscillation. From Eq. (4), with the viscosity assumed constant, it is clear that the stiffness of the sample, measured as k , is linearly related to the square of the natural frequency. The experimental verification of this relationship in phantom studies is shown in Figure 3, where the natural frequency of the sample appears to be linearly dependent on square root of the elastic moduli. Thus, the assessment of natural frequency can generate mechanical contrast for different stiffness of the sample. Here, it is worth to mention that with negligible viscosity, the relationship between the spring constant and the natural frequency can be written as k = 4πmf2, which represents the modelling of the sample with only a spring for its elastic property.
Figure 3.

Measured nature frequencies from phantom samples with varying elastic moduli showing the natural frequency is linearly dependent on the square root of the elastic moduli. Adapted from Ref. [57].
In OCE, several loading functions, reflected in F(t), including the step function [56, 57, 65], the dynamic sine or cosine function [102] and the square pulse [61], have been employed for stimulation and to create such damped oscillations in the sample. To obtain the frequency information from the captured temporal dynamics of the sample, approaches such as applying fast Fourier transform [61] and performing least-square regression [65] with Eq. (3) have been utilized in OCE.
When modelling the biological tissue as the Kelvin-Voigt body, it is assumed that the constant stress applied to the system produces constant strain in the spring and constant strain rate in the dashpot [82]. Although a simple empirical model can be utilized as a basic description of the tissue mechanical characteristics, more adaptive models employing finite element analysis [103] could provide more accurate representation of the tissue, thus reducing the error of OCE methods in the quantitative assessment of the sample elasticity [56]. For the qualitative OCE detection with the natural frequency as the mechanical contrast, the assumption of identical or neglectable viscosity of sample could bring artifacts for the elastographic imaging. To date, the OCE techniques based on this type of mechanical contrast have shown both point measurement and also two-dimensional depth-resolved elastogram where the mapping scale remains the same as OCT [102].
Besides the direct employment of natural frequency as the indicator, the resonance phenomenon has been utilized to create mechanical contrast with the detection of strain-related or displacement-related parameters during the sweep of the loading frequency [70, 104-107]. Resonance occurs when the external driving frequency matches the natural frequency of the sample, causing increased displacement amplitude or strain. Because the tissue with different stiffness appears to have distinct natural frequencies, the spatial mapping of the vibration spectrum obtained from OCE can be used to plot an elastogram [70, 104]. Relying on the resonant effect, the natural frequency of the sample can also be estimated through the frequency-sweeping stimulation [107], thus enabling quantitative measurement of the sample elasticity [105]. Although the OCE techniques based on tissue resonance rely on the same assumptions as with the approaches that take direct use of natural frequency, relatively more thorough characterization of the tissue biomechanics is available over a broad spectral range [70], however, with the need of processing larger amount of hyperspectral data.
2.3 Velocity of elastic wave propagation
Besides characterizing the sample deformation, the propagation of the localized displacement, as mechanical waves, also carries the viscoelastic information of the sample [108]. Mechanical assessment based on the mechanical wave propagation is widely applied in the areas such as seismology [109] and material examination [110], and recently has been extensively utilized in tissue elastography with UE [23] and MRE [25]. For OCE techniques, shear wave and surface wave are the two types of mechanical waves that have been mainly employed for elasticity imaging and quantitative biomechanical measurement.
Modelling the sample as a homogeneous isotropic Kelvin-Vogt body, the propagation speed c of a plane shear wave is determined by the viscoelasticity of the sample through the relationship of [111]
| (5) |
where ρ is the mass density of the sample, ω is the angular frequency of the shear wave, μ and η are the shear modulus and the shear viscosity of the sample, respectively. It can be seen that the shear wave velocity is frequency dependent for viscoelastic material, showing as the dispersion of the shear wave caused by the viscous behaviour of the sample. Assuming the negligible viscosity of the sample (η close to zero), Eq. (5) can be simplified into
| (6) |
where the shear wave velocity is directly related to the sample shear modulus and the mass density. Through the ratio of transverse to shear strain, using the Poison’s ratio ν, the sample Young’s modulus E can be related to the shear modulus as
| (7) |
Due to the high percentage composition of water in soft tissue, the incompressibility can be assumed for soft tissue samples, which leads to the Poisson’s ratio of 0.5 [112]. Thus, the Young’s modulus can be directly related to the shear wave velocity as
| (8) |
Equations (6) and (8) enable the estimation of the sample elasticity with a simple relationship based on the shear wave velocity that can be measured by OCE, which creates quantitative mechanical contrast by monitoring the shear wave propagation in the tissue sample.
The detection of shear wave in tissue has been largely relying on the phase information from the complex OCT signals [59, 71, 113]. The shear wave speed in soft tissue samples typically has the range of 1-10 m/s [114]. To capture the wave propagation, M-B scanning mode synchronized with the tissue stimulation is implemented in OCE [113, 115], which enables the visualization of this relatively fast phenomenon. In OCE, the shear wave velocity is calculated with the ratio of the propagation distance to the time delay that is usually obtained through the cross-correlation of the captured local deformation profiles along the wave propagation [71, 116]. Besides, the phase delay of the wave propagation and the frequency of the shear wave can also be utilized to quantify the wave propagation time among the measurement positions [59]. For the generation of the shear wave in tissue, dynamic loading with a fixed frequency [66, 71, 115] and focused impulse stimulation with a relatively short pulse duration [59, 116-119] have been mainly utilized in the OCE techniques. Recently, mechanical stimulation with a broad frequency range is applied and with the pulse compression approach, increased SNR for shear wave detection and reduced artefacts in stiffness mapping have been achieved [120].
Relying on the shear wave velocity for quantitative OCE, estimation errors for the shear or Young’s modulus exist due to simply modelling the biological tissue as an isotropic homogeneous Voigt material and also the assumption on the negligible viscosity of the soft tissue. A recent effort in OCE has been made to measure the frequency-dependent phase velocity for the shear wave dispersion curve [66], which can be used for the quantification of both the shear modulus and the shear viscosity of the tissue based on least-squares fitting with Eq. (5). Taking into account the viscous property of the soft tissue, such OCE method is expected to produce more accurate quantitative elastogram of tissue.
Unlike the shear wave that propagates in the bulk, the surface wave that is close to the surface of an isotropic elastic material contains both longitudinal and transverse motion, which can be considered as Rayleigh wave [121]. The surface wave velocity C of a homogeneous isotropic medium is related to the sample Young’s modulus E through
| (9) |
Based on Eq. (9), for the soft tissue that can be assumed as isotropic homogenous, which ignores the possible effect of wave dispersion, the Young’s modulus of the sample can be directly quantified in OCE with the surface wave velocity [122, 123]. For layered sample with different stiffness of each layer, the dispersion of the surface wave is associated with the depthwise distribution of the sample elasticity [124]. Because the surface wave with lower frequency penetrate deeper inside the sample, while the higher frequency components is limited in the shallower depth, the velocity of the surface wave at different frequencies can be used for depth-resolved elasticity measurement in OCE [58, 73, 124, 125]. Figure 4 shows an example of the phantom studies, where the depthwise distribution of the sample elasticity appears to be associated with the frequency-dependent surface wave velocity. Here, the relationship between the depth z and the frequency fs of the surface wave can be approximated as
| (10) |
where λ is the corresponding wavelength of the surface wave. With Eq. (10), OCE has achieved depth-resolved quantitative elastogram with the mapping of Young’s modulus [69]. Due to the approximation between the depth and the wavelength, the localization of the elasticity in the sample might have errors. Also, with limited frequency range of the surface wave, the elastic properties in the superficial layer of the sample may not be available. However, such OCE techniques employing the dispersion of the surface wave extend the elasticity measurement towards much deeper region inside the sample compared with the field of view in standard OCT.
Figure 4.

Experimental data of surface wave velocity from agar phantoms showing the frequency-dependent phase velocity is related to the depthwise distribution of the sample elasticity. Adapted from Ref. [58].
2.4 Other mechanical contrast in OCE
Besides the three major mechanical contrasts that have been employed in OCE, in this section, we briefly describe and comment on several other parameters that are utilized by OCE for biomechanical imaging and detection.
The recent development of OCE has demonstrated the relaxation rate of the self-recovery process from the sample surface following an impulse stimulation can be used to provide differentiation among samples with distinct stiffness [126]. Instead of an underdamped harmonic oscillator, a first-order differential equation is utilized to model the tissue sample as homogenous isotropic Kelvin-Voigt material [82]. Right after the removal of the external loading, the strain ε of the sample over time t can be express as
| (11) |
where ε0 is the strain when the recovery starts and α is the relaxation rate which is determined by the sample viscoelasticity through
| (12) |
Thus, assuming constant viscosity of the sample, the relaxation rate is directly proportional to the spring constant and can be utilized as the indicator of the sample stiffness. The measurement of the relaxation rate is performed by the exponential fit of the captured self-recovery profile with Eq. (11) [126]. To date, only the relaxation rate from the sample surface is studied with point measurement [126]. How the surface relaxation rate is affected through the depth and whether this parameter can be used to generate elastogram currently remain as questions and require further investigations.
Similar to the use of displacement amplitude or strain as the mechanical contrast, the correlation stability of the OCT structural images before and after the compression loading has been demonstrated as an indicator for mapping the sample stiffness [127, 128]. With uniform stress, the stiffer region within the sample deforms less than the softer region, meaning distinct cross-correlation coefficients for the regions with different elasticity. As a qualitative detection, the correlation stability is considered to be suitable for a much wider strain range from the sample under compression, which makes this OCE technique appropriate for the potential free-hand examination and using the OCT imaging probe to induce deformation. Although this method avoid the possible errors from the measurement of the displacement amplitude or strain [127], it could be very difficult to turn this highly relative representation of the sample stiffness into quantitative detection, which is the major drawback of this particular mechanical contrast.
With a step loading function, the temporal characteristics of deformation and creep have been utilized to differentiate different types of tissues [65]. Specifically, exponential function y = 1 − a × ebt is used to fit the equilibrium part of the sample deformation profile and b is obtained as the creep parameter [65]. Also, the time duration from applying the loading force to the sample reaching the highest displacement is quantified as the rise time [65]. Micro-scale elastogram could potentially be possible through the mapping of such parameters. However, how they are determined by the biomechanical properties of the tissue currently remains unclear and deserves more careful investigations.
3. OCE for tissue characterization
Tissue characterization, specifically the detection of the pathological and physiological changes of tissue, has been driving the development of OCE for many applications. In this section, we discuss the OCE techniques that have been reported for the applications on seven major types of tissues, including cornea, soft-tissue tumor, artery wall, muscle, skin, single cell and crystalline lens, and also on several other types of tissues, such as tendon and airway wall. The mechanical characteristics of these tissues are of great significance for the related clinical diagnosis and pre-clinical studies, where OCE could be potentially useful with its unique scale of biomechanical imaging and assessment.
Compared with the traditional UE and MRE, OCE generally maintains two major features for the applications on soft tissues. Firstly, the scale of elasticity measurement and mechanical imaging of OCE could reach microscopic level with the possible spatial resolution of several microns. This provides highly localized examination of the tissue with sufficient number of pixels to resolve the micro-scale biomechanical heterogeneity, which is not available with the traditional elastography techniques. Secondly, the superior sensitivity of OCE to displacement enables high-SNR detection of sub-micrometre tissue deformation, which allows the loading stress low enough to minimize the alternation of the tissue structural and functional properties during OCE imaging. These two advantages over UE and MRE motivate the development of OCE for many applications in tissue characterization, some of which are discussed in this section.
Although the current OCE techniques are not mature and still under development to be applied in clinical and pre-clinical environments, this section reviews the available OCE methods for the specific applications, provides the current status of OCE development for some types of tissues, and comments on the important features, which are expected to be useful for the further shaping and advancement of the particular OCE techniques to better meet the application requirements.
3.1 Cornea
The mechanical properties of the cornea have drawn great attention due to its important role in the clinical diagnosis and treatment of various degenerative ocular diseases [129]. Some specific examples include the diagnostics and assessment of keratoconus that causes reduced rigidity of the cornea [130], providing essential assistance to adaptive biomechanical modelling of the cornea for the optimization of individual laser ablation procedures [6], and the management of collagen cross-linking therapy [131]. Such applications place several technical requirements on the capabilities of the OCE, such as quantitative measurement for the comparisons over time and across samples, in situ detection with high imaging speed, and spatially resolved assessment for the capture of the mechanical heterogeneity.
The development of OCE for corneal biomechanics starts from the employment of the displacement amplitude in response to static compression loading as the mechanical contrast [132]. Ex vivo human cornea in the eye globe was compressed using a standard clinical gonioscopy lens and most parts of the cornea were in contact with this lens from the anterior side. The map of the displacement amplitude inside the cornea is achieved through 2D cross-correlation of the OCT structural images. Besides the elastogram, the further analysis of both the axial and lateral displacement indicates the heterogeneous mechanical properties within the corneal stroma. However, the possible nonuniform distribution of the stress caused by the incomplete contact between the gonioscopy lens and the cornea could result in significant artefacts for the mapping of the corneal biomechanical properties.
Replacing the direct contact loading with noncontact air-puff stimulation, a few groups have explored the OCE technique that measures the dynamic response of the cornea to a puff of air [62, 63]. Similar to the clinically-available biomechanical test instrument, e.g. ocular response analyser, such OCE method applies high-speed OCT imaging to better resolve the corneal displacement with superior axial resolution. The deformation profile of the cornea and also the quantitative parameters that characterize the deformation process are utilized to represent the corneal biomechanics. In vivo human experiments have been demonstrated in both studies [62, 63], and the sensitivity to detect differences in corneal biomechanics is investigated with virgin and treated porcine corneas on the ex vivo eye globe [63]. This type of OCE technique could be expected to potentially provide more accurate assessment of the corneal dynamics due to the advantage in high-resolution imaging of the anterior segment of the eye. The lack of the capability to resolve the spatially distributed mechanical property might be the factor to limit its possible applications. Also, relatively large deformation (from hundreds of micrometres to millimetre level) of the cornea is induced, which could introduce nonlinear components to the corneal response, making the measured parameters hard to be quantitatively related to the biomechanical characteristics of the cornea.
The recently reported OCE techniques developed for the cornea features the loading of the corneal deformation at micron or sub-micron scale measured using high-sensitivity phase-resolved OCT detection [113, 122, 126, 133-137]. The mechanical contrasts from these OCE methods are mainly from the velocity of the elastic wave propagation in the cornea. Several stimulation approaches have been introduced to generate such mechanical waves with both contact and noncontact configurations. Among these, one of the early studies utilizes pulsed laser (532 nm wavelength) to induce surface acoustic waves on the cornea based on the photothermal effect [122], which enables quantitative Young’s modulus measurement of the cornea from this all-optical OCE method. The configuration of the pulsed-laser stimulation and OCT measurement of surface acoustic wave on cornea is shown in Figure 5(a), where a number of measurements are taken along the wave propagation to quantify the wave velocity. Alternatively, impulse stimulation with a wire tip (contact area of ~0.6 mm2) is used for an in vivo demonstration of the wave velocity estimation on the mouse corneas [133].
Figure 5.

Configurations of (a) the pulsed-laser stimulation and OCT measurement of surface acoustic wave on cornea and (b) the focused air-puff stimulation and OCT measurement of corneal elastic wave. (a) is adapted from Ref. [122]. (b) is adapted from Ref. [113].
More recently, a focused air puff with short duration (< 1 ms) and low pressure (level of pascal) [64] has been applied to cornea as a safe and easy-to-control stimulus. A typical configuration with air-puff loading of the cornea is shown in Figure 5(b) with 3D OCT structural images. With this noncontact loading approach, in vivo OCE detection of the corneal stiffness has been achieved [126, 134], and collagen cross-linking treatment of the cornea is involved in the feasibility studies on the spatial characterization ability of such OCE methods [135]. Also, with the proper synchronization between the air-puff stimulation and the OCT phase-based imaging, the depth-resolved low-amplitude corneal elastic wave propagation has been visualized at an ultra-high frame rate [113]. Figure 6 shows five temporal points of the deformation inside the cornea indicating the visualization of the corneal elastic wave propagation. Based on such ultra-fast imaging of the wave propagation, the very recent studies on corneal OCE have investigated the possibility for micro-scale biomechanical mapping [136] and towards quantitative viscoelasticity measurement [137]. Moreover, the spectral analysis of the corneal elastic wave with the quantification of the wave phase velocity has been demonstrated to be able to provide micro-scale depth-resolved assessment of the corneal biomechanical properties [138]. In Figure 7, the plot of phase velocity over depth indicates the depthwise distribution of the corneal stiffness that are related to the structural features of the cornea, including the epidermis, the anterior and posterior stroma, and the innermost region.
Figure 6.

Elastic wave propagation in cornea induced by focused air puff and imaged with shear wave imaging OCT. Adapted from Ref. [113].
Figure 7.

(a) The elastic wave phase velocity over depth showing the depthwise distribution of the corneal stiffness which is associated with the structural features of the cornea indicated with (b) a general OCT image. Region I: epithelium. Region II: anterior stroma. Region III: posterior stroma. Region IV: innermost region. Adapted from Ref. [138].
As OCT has already been widely used in clinical corneal imaging, the pulsed laser [122] and air puff [113] are two promising loading approaches for potentially convenient and comfortable examination of the cornea with OCE. Further efforts can be placed on the optimization of these two stimulation methods for the efficiency and the potential safety issues, including the control of the heat [139] and the precise positioning of the air-puff port. Relying on the ability to capture the air-puff-induced elastic wave (more specifically, Lamb wave [140]) in the cornea, more analyses associated to the wave properties, such as the wave dispersion, are expected to lead to micro-scale quantitative corneal elastography [138]. For the mechanical contrast that is based on the elastic wave propagation, adaptive models that minimize the number of assumptions could reduce the estimation errors for the tissue biomechanics. As the cornea has laminar structure with curved shape and complex boundary conditions, advanced models for corneal wave propagation would be required to further the application of OCE in the cornea.
3.2 Soft-tissue tumor
The stiffness of sample has been utilized as an important tissue characteristic in clinical tumor detection, ranging from the palpation test during surgeries to the diagnosis and localization of tumor through UE and MRE [26, 27]. OCE technique, due to its microscopic-level mechanical assessment, could potentially provide more accurate delineation of the tumor margin and assist the study of tumor biomechanics at a unique length scale that has not been investigated before. The development efforts regarding the applications of OCE for tumor detection have been mainly focused on two directions, including the imaging of ex vivo excised tissue [70, 85, 102, 104] and towards the intraoperative assessment [93, 123].
For excised tissue samples, dynamic or static compression loading has been mainly employed in OCE, which covers the whole field of view for the mechanical imaging [70, 85, 102, 104]. The early development features the use of a piezoelectric transducer to dynamically load the tissue from the bottom against a fixed glass window which the OCT imaging beam is penetrate through [70, 104]. With the resonance effect and based on the change of the driving frequency, different sample regions that have distinct stiffness could be highlighted with the mapping of the displacement amplitude [70] or the strain rate [104] in a 2D depth-resolved elastogram. Such OCE methods have been demonstrated to be able to detect the tumor region in ex vivo rat mammary tissues. With similar loading configuration, depth-resolved quantitative elastography achieved through least-squares fitting of the tissue response to cosine or step driving function with Voigt model could indicate the tumor region of ex vivo human breast tissue with good SNR. Two-dimensional mapping of the sample elastic modulus can be considered as the major advantage of this natural frequency based OCE technique. Fast Fourier transform can be utilized to replace the regression in the quantification process [56], which could reduce the time required for producing the elastogram.
Recently, common-path OCT configuration providing improved phase stability is combined with a static compression loading approach for the development of optical coherence micro-elastography [85]. A ring actuator is applied to compress the tissue sample by a glass window that is used as the reference mirror for the OCT imaging [85]. Utilizing the OCT phase information, and based on a 3D phase unwrapping algorithm, volumetric mapping of the strain is available for 3D micro-elastogram [85]. Through the comparison with en-face OCT structural images, this OCE method demonstrates clearer and better visualization of the features in ductal carcinoma and uninvolved lymph node from ex vivo human breast tissues, which represents an important step towards the use of OCE to complement conventional OCT for fast histology of resected tissue samples. A typical elastogram of human breast tissue diagnosed as ductal carcinoma obtained with such OCE technique is shown in Figure 8, together with the corresponding OCT structural image and the histology.
Figure 8.
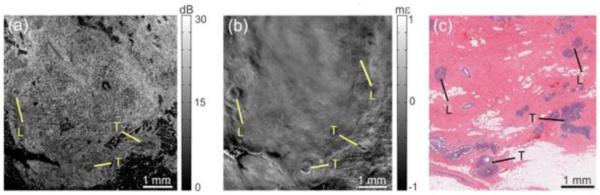
OCE of human breast tissue diagnosed as ductal carcinoma in situ at a depth of ~100 μm indicating additional contrast. (a) En face OCT image; (b) En face micro-elastogram and; (c) Histology. Adapted from Ref. [85].
Intraoperative detection of tumor boundary generally requires the OCE technique to have the stimulation of the tissue from the same side of the imaging. One of the early efforts has been made with the use of a focused air puff to load the tissue [123]. The quantification of the surface wave velocity results in quantitative measurement of the Young’s modulus of ex vivo human soft-tissue tumor, which enables the differentiation from the normal tissue [123]. However, more studies are needed to investigate the feasibility of this OCE method for the tumor margin detection. Needle OCE technique [94], as an unique configuration that integrates OCE with a needle probe for deep tissue mechanical imaging, has recently been applied for the boundary detection of the tumor in situ in the excised human breast tissue [93]. The flat needle tip is functioned as the compression loading during the insertion of the needle into the tissue, and the resulted displacement amplitude of the tissue in front of the needle probe is plotted over depth for the heterogeneity detection [93]. The relative stiffness of different regions inside the sample can be obtained based on strain that is reflected by the slope of the displacement amplitude over depth. A sharp change of the strain (or the slope) could directly indicate the mechanical boundary of the tissue, which can be seen in Figure 9 showing the typical needle OCE results during the insertion of the needle in human mastectomy sample. The boundary between the tumor and the adipose tissue can be clearly visualized based on the slope of the displacement over depth. During the insertion of the needle, the fracture toughness of the tissue might compound the interpretation of the results into the tissue elasticity, which deserves further investigations with the mechanical modelling of the measurement process [93]. However, based on the current studies, the needle OCE technique holds great promise for the intraoperative tumor margin detection. Although being invasive, the capability of the method to make assessment several centimetres deep within the tissue could potentially be of important value to help minimize the residual of the breast tumor.
Figure 9.

Needle OCE results in a human mastectomy sample showing the capability of detecting the tumor boundary deep inside the breast tissue. (a) M-mode OCT image; (b) Histology; (c) and (d) Averaged A-scan signals; (e) and (f) Corresponding displacement over depth. Reproduced from Ref. [93].
3.3 Artery wall
Mechanical characterization of the arterial wall could provide valuable information regarding the stability of the plaque and lead to improved management of atherosclerosis [141]. In response to the natural diastolic pressure variation in the artery, the distribution of the strain from the arterial wall has been utilized by intravascular ultrasound (IVUS) elastography [142] to characterize the elastic properties of different parts within the plaque, thus enabling the analysis of the plaque components and stability [143]. However, the relatively low spatial resolution (hundreds of microns) of the axial strain assessment from IVUS elastography could limit its application for the detection of detailed structural components that carry important information of the plaque vulnerability. Such limitation provides the opportunity for the development of intravascular OCE for high-resolution biomechanical imaging of the arterial wall [49, 144].
Some of the early developments of OCE techniques are focused on the application in artery [49, 51, 144-146]. Such work mainly concerns on the computational approaches for the tissue velocity and strain estimation based on the OCT structural images. Among these, a multi-resolution vibrational framework is proposed for robust estimation of the velocity and strain field from the arterial wall, which is demonstrated with both numerical simulation and experiment on ex vivo normal human aorta segment [49]. In the further development of intravascular OCE, the loading of the tissue deformation is synchronized with the A-line scanning of OCT and the displacement quantification is performed between the adjacent A-lines, which avoids the mechanical imaging artifacts caused by the OCT frame-to-frame decorrelation [146]. Numerical simulations demonstrate the feasibility of this method in detecting the high-strain spot from vulnerable atherosclerotic lesions [146]. These studies lay the foundation for the future strain analysis of the in vivo intravascular OCT images of the coronary arteries, which is highly desired for the advancement of intravascular OCE technique.
The recent development of the OCE techniques for the mechanical imaging of the cardiac wall features the use of the OCT phase information to resolve the displacement induced by acoustic radiation force with either a bulk-modulated loading configuration [90] or a confocal point-stimulation configuration [60, 107]. In the former setup, with the tissue samples placed on the ultrasonic transducer, 3D mapping of the tissue displacement following the 500 Hz modulation is generated as the elastogram [90]. For the latter, focused ultrasound waves are used to drive the tissue sample from the bottom, co-focused with the OCT beam that is from the top. Two types of the mechanical contrasts have been employed with this OCE setup, including the natural frequency obtained through the frequency sweep from the stimulation [107] and the displacement amplitude under certain driving frequencies [60]. All these OCE methods have been demonstrated with the capability of detecting atherosclerotic lesion and fibrous cap from opened human coronary artery [60, 90, 107]. A typical result is shown in Figure 10, where the loose and the denser fibrous caps are highlighted in the elastogram based on different driving frequencies, which are confirmed with histology results. The scale of the resulted 2D and 3D elastograms maintain the same scale with the OCT structural imaging, which is sufficient for resolving the detailed plaque structures. However, how to integrate such OCE methods into an imaging probe that could be used for intravascular imaging is still an open question, which requires further investigations regarding the design, engineering and experimental test.
Figure 10.

Elastogram of human coronary artery produced by resonant acoustic radiation force OCE. (a) OCT structural image; (b) elastogram at 500 Hz driving frequency; (c) elastogram at 800 Hz driving frequency; (d) and (e) Histology. Adapted from Ref. [107].
3.4 Muscle
Motivated by the fact that the functionality of the muscle tissues are highly dependent on their mechanical properties, the development of several OCE techniques have targeted on the imaging and measurement of the elasticity of muscle [87, 116]. Due to the general millimetre-scale field of view, the applications of OCE in muscle tissues are difficult to be involved in clinical diagnosis, but are mainly focused on providing information and assistance to the related studies, such as improving the understanding of certain pathologies. These efforts have been made very recently with two OCE methods developed for micro-scale biomechanical characterization of both the skeletal muscle [87] and the cardiac muscle [116].
With the strain in response to compression loading as the mechanical contrast, 3D micro-elastograms can be generated for mapping the elastic properties of excised rat skeletal muscle [87]. The en-face elastographic result is demonstrated to provide higher SNR than the structural OCT imaging for the detection of particular features and pathologies in the skeletal muscle tissue, such as the necrotic lesions [87]. Figure 11 shows the high-resolution micro-elastogram obtained with OCE, which indicates the damage to the skeletal muscle tissue with the necrotic lesion. The comparison with OCT en-face structural image and the confirmation with histology are also presented. With the unique measurement scale, this OCE method could be useful in the relevant skeletal muscle research for improved treatment of muscle diseases. The quantitative capability of such method is one of the directions for further development, which can be very beneficial to extend the applications in the possible longitudinal studies.
Figure 11.
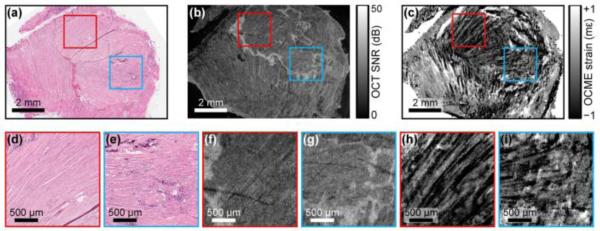
Micro-elastogram showing the detection of the region with a necrotic lesion. (a) Histology; (b) OCT structural image; (c) Micro-elastogram; (d), (f) and (h) show the characteristics from intact muscle fibers; (e), (g) and (i) indicate the necrotic lesion with the strain appears mottled texture and lack of the striation pattern. Adapted from Ref. [87].
One of the current clinical problems with cardiac muscle tissue is the lack of the regenerative ability after the ischemic heart disease. The OCE technique utilizing the shear wave velocity for quantitative measurement of Young’s modulus has been recently demonstrated to be able to assist the studies on cardiac tissue regeneration [116]. Relying on shear wave imaging OCT [113], this OCE method is used to monitor the shear wave propagation in the left ventricle wall and quantify the elasticity difference between the groups of hearts with normal and genetically-altered myocardiocytes [116]. Figure 12 shows the plots of the shear wave propagation distance versus the time delay at typical depths for both types of cardiac muscle tissues, indicating the difference in the shear wave velocity, thus the Young’s modulus. Because such method can provide orientation-dependent elasticity measurement, studies related to the function of the cardiac muscle based on the muscle fiber orientation could be possible with this OCE technique, which is potentially helpful for the investigation of related biological and physiological questions.
Figure 12.

Plots of the shear wave propagation distance versus the time delay at typical depths for the myocardium with (a) normal and (b) genetically-altered cardiomyocytes, indicating distinct shear wave velocities that are used to quantify Young’s moduli of the cardiac muscle tissues. Adapted from Ref. [116].
3.5 Skin
The skin has been extensively used to demonstrate the feasibility in in vivo depth-resolved biomechanical imaging of many OCE methods [44, 69, 72, 73, 88, 91, 124]. These studies, at the same time, indicate various possible applications of OCE for the mechanical characterization of skin in the clinical environment. The biomechanical properties of skin contribute to its health and aging [147], and the change of the skin elasticity is closely related to certain pathologies, such as scleroderma [148] and cancer [149]. The OCE techniques developed for skin elastography have mainly employed two types of mechanical contrast, including the displacement amplitude or strain [44, 72, 88, 91] and the velocity of surface wave [69, 73, 124]. Both of these have shown promising results but with different features for the elasticity imaging of the skin.
With mapping the tissue displacement amplitude for the mechanical heterogeneity of the in vivo human skin, the first OCE study [44] utilizes the static compression loading with piezoelectric actuator and applies 2D cross-correlation speckle tracking to generate elastogram. Employing the displacement amplitude or strain as the mechanical contrast, the further development of OCE features dynamic configuration [88, 91], where the skin is compressively loaded with the frequencies in audio range. The mapping of the displacement amplitude quantified through analysing the Bessel frequency spectrum of the OCT signal from the periodic tissue motion indicates the stiffness difference of the layers in in vivo human skin [91]. The elastogram with micro-strain from the skin in response to dynamic vibrations shows significant contrast between the epidermis and the dermis layer, and the in vivo studies on human also demonstrate the feasibility of OCE for the detection of laceration on the skin [88]. Recently, this type of in vivo OCE technique has been extended into 3D [72]. Based on the OCT phase information, the strain rate caused by the dynamic uniaxial loading is calculated and utilized to produce three-dimensional elastogram that has been demonstrated to be able to monitor the hydration of the skin tissue [72]. Typical results are shown in Figure 13, where 3D elastograms of in vivo human skin under normal conditions and hydrated are shown and compared. Such OCE methods have the pixel scale below ten microns in the axial direction in the elastogram, together with the mechanical contrast, enabling improved accuracy in the measurement of the skin layers. However, because the distribution of the stress can be highly complicated in the skin under compression loading, quantitative elastography could be difficult to achieve.
Figure 13.

Typical 3D elastogram of in vivo human skin tissue. (a), (b) and (c) are the OCT, OCE and overlay images from the skin of middle finger under normal condition, respectively; (d), (e) and (f) are the OCT, OCE and overlay images from hydrated skin of middle finger, respectively. Reproduced from Ref. [72].
The stimulation of surface waves on the skin and the measurement of the wave propagation velocity provide quantitative skin elasticity measurement with OCE. The phase from the OCT complex signal is utilized in these methods to resolve the tissue surface displacement along the wave propagation [69, 73, 124]. With dynamic mechanical loading coupled to the skin surface at different driving frequencies, the quantification of the surface wave velocity based on the phase shift of the displacement profile among multiple locations leads to the measurement of Young’s modulus from different depth levels of the skin [124]. This method is used to show the hydration and dehydration effect of the in vivo human skin, and the anisotropy of the skin elasticity determined by the Langer’s lines can also be detected [124].
Instead of sweeping the frequency of the dynamic loading, pulsed stimulation that contains a broad range of frequencies could also be used for depth-resolved OCE of the skin [69, 73]. In such OCE method, the stimulation is generated with a mechanical shaker with the pulse width that produces the wave frequency up to 10 kHz [69, 73]. This strategy of loading basically reduces the data acquisition time for the depthwise mapping of the skin elasticity. The phase values of wave propagation at different frequencies are obtained from the Fourier transform of the temporal surface displacement profiles and used to quantify the surface wave velocity. The dispersion of the wave is associated with the depth-dependent elastic properties of the skin, which results in the Young’s modulus measurement for different layers of the skin [73]. With this, quantitative depth-resolved elastogram has been produced for the human forearm skin in vivo [69], which is shown in Figure 14. It can be seen that the hard nodule can be differentiated from the elastogram with a good contrast. These OCE methods could probe the elastic properties from the depth beyond what the OCT structural imaging could reach, which suggests the possibility of OCE to complement the traditional OCT imaging in dermatology [150]. As discussed in Section 2.3, a more accurate relation between the frequency and the depth level could be the direction of future work regarding such surface-wave-based OCE techniques.
Figure 14.

Quantitative elastogram obtained with assessing the frequency-dependent velocity of the surface acoustic wave on human skin in vivo. (a) OCT structural image; (b) OCE results. Adapted from Ref. [69].
3.6 Single Cell
Cellular biomechanics is an important parameter to characterize the health of cells and provides important assistance to the studies of the pathological states, e.g. cancer [151]. AFM has been utilized to probe the mechanical properties of single cell and is capable for cellular elastography with the resolution at nanometre level [34]. However, the imaging procedure of AFM elastography makes it very challenging to perform in situ biomechanical imaging of single cell, which is of great significance for the study of pathological process, such as the spread of cancer.
Towards this goal, a recent effort has combined OCE with multiphoton microscopy to detect the cell dynamics from the periodic axial vibration of the microbead in the cell [152]. Such method is based on the configuration of magnetomotive OCE that could resolve the motion of the diffused or injected particles with nanoscale sensitivity [65]. The experimental demonstrations are conducted on mouse macrophage, human breast primary ductal carcinoma cells, and human breast epithelial cell in culture [152]. Figure 15 indicates the cellular dynamic motion detected by magnetomotive OCE with the optical coherence microscopy image showing the position of detection and the magnitude frequency spectra showing the amplitude of vibration. This work can be considered as the first step of developing OCE for in situ assessment of cell biomechanics. The employment of multi-model imaging modality set up an example for the future development of the OCE techniques.
Figure 15.

Magnetomotive OCE data show the response of non-targeted Dynabeads from different locations in human cancer cells. (a) Optical coherence microscopy image of cancer cell; (b) Temporal displacement profiles in response to the external magnetic field; (c) Magnitude frequency spectra showing the dynamic displacement amplitude. Adapted from Ref. [152].
3.7 Crystalline lens
The mechanical property of the crystalline lens is highly related to the accommodative ability of the eye [153], and in situ nondestructive evaluation of the lens elasticity, especially its distribution inside the lens, could improve the understanding of accommodation and presbyopia [154]. Several features of OCE, such as the capability of remote loading and sensing, the possible depth-resolved detection and the requirement of significantly low pressure for stimulation, make it promising for the development towards noninvasive biomechanical characterization of the in situ crystalline lens. Due to the limited view of the whole lens with OCT, the dynamics of the lens surface has been used to assess its elastic properties [155].
The recent development of OCE has proposed a method to assess the depth-dependent elasticity in transparent sample with the spectral analysis of the surface dynamics [61]. Pulsed ultrasound stimulation co-focused with the OCT imaging beam is remotely applied to the surface of the sample, and with phase-resolved detection, the dominant frequency of the surface self-recovery process, also considered as the natural frequency of the sample, is utilized as the indicator for the depthwise distribution of the sample elasticity [61]. More recently, this method has been applied for quantitative assessment of the biomechanical properties of lens in situ [156]. Such measurements can be conducted in real time, which could be beneficial to the studies related to the accommodation and presbyopia.
3.8 Other applications
The recent development of an OCE method has been applied for quantitative evaluation of the degenerated tendon model [92]. Acoustic radiation force is directly coupled in bulk into the excised chicken tendon sample for dynamic modulation with 30 kHz frequency, and the resulted strain inside the sample is obtained based on the amplitude frequency spectrum of the sample displacement profile from phase-resolved OCT detection [92]. With the tendon sample placed inside the agar phantom that has known Young’s modulus, this OCE method employs the linear stress-strain relationship and quantifies the elasticity of the tendon tissue through the comparison (ratio) of the strain between the tendon and the phantom [92]. Quantitative elastography generated with such method has been demonstrated to be able to monitor the degeneration of the tendon tissue induced by collagenase treatment [92]. Figure 16 shows the quantitative elastograms obtained by OCE over time together with the OCT structural images, which indicate the degeneration process of the tendon tissue. As the mechanical property of tendon is essential for the diagnosis of its health and functionality, more work with OCE and physiological examination are deserved for moving this application forward.
Figure 16.

Quantitative elastograms show the degeneration of the chicken tendon tissues. (a)-(c) are the structure images of tendon samples treated with 1, 3.3, and 10 mg/mL collagenase for 60 min, respectively; (d)-(f) are the calculated Young’s modulus elastography for these three samples; (g)-(i) are the overlaid images. Adapted from Ref. [92].
For engineered tissue at early stage, its mechanical property is an important parameter to characterize the tissue and functionally monitor the development process [157], where OCE techniques could potentially be applied as an essential tool. The development of OCE for such application has employed the strain in response to the static compression loading for the elastogram [84]. Two-dimensional cross-correlation is utilized to quantify the displacement inside the tissue caused by the compression [84]. Both engineered tissue and animal model at the early stage of growth are utilized for experiments with longitudinal OCE characterization, and the capability of using OCE for mechanical imaging of the development process is demonstrated [84]. As relative elasticity information is provide with such OCE method, further investigations applying quantitative OCE techniques could possibly provide more accurate characterization, which is potentially useful to the rapidly growing field of tissue engineering.
Similar to the application for the arterial wall, the analysis of the deformations from the airway wall in response to the tidal breathing enables the mechanical characterization of the trachea. An OCE study has taken the high-resolution endoscopic OCT images of the tracheal wall from live rabbit and produces the mapping of the compliance through the tracking of the displacement from the wall surface [158]. Such compliance map of the trachea has been shown to be able to indicate the location of the trachealis from in vivo experiments [158]. This type of OCE method that relies on the intrinsic stimulation of the tissue (such as the tidal breathing here and the diastolic pressure variation in intravascular OCE) has great potential to provide valuable mechanical information to directly complement the OCT structural imaging. With the advancement of endoscopic OCT techniques, the quality of the resulted mechanical imaging is expected to be further improved.
Recently, a potential application of OCE in reconstruction surgery such as laser reshaping of the nasal cartilage has been also demonstrated [159]. The process of stress relaxation caused by laser heating is the primary method to achieve the nasal cartilage reshaping in otolaryngology and orthopaedics. However, stress relaxation in cartilage is a time-dependent and critically temperature-dependent process. In order to achieve the desired changes of the cartilage shape, an accurate measurement of the cartilage elastic property during the temperature and time changes has been performed [159]. Interestingly, as shown in Figure 17, the results from OCE show strong but not linear dependence of cartilage elastic properties on the temperature and are in agreement with the results obtained by uniaxial mechanical compression test. Thus, this rapid and non-destructive experimental method is promising for in vivo measurement and monitoring of the biomechanical properties of cartilage during the laser reshaping process.
Figure 17.

Temperature dependence of Young’s modulus of cartilage tissue, obtained by OCT and mechanical compression test. Adapted from Ref. [159].
4. Discussions
Various applications could place different requirements to the further development of OCE, resulting in certain technical challenges that are required to be investigated. Through the review in Section 2 and 3, we have indicated and discussed several of them. In this section, we present three typical ones, together with the outlining directions for the possible future work.
The quantitative capability of the OCE techniques employing displacement amplitude or strain as the mechanical contrast could bring such methods a number of new applications and will significantly benefit the biomechanical imaging field. The current OCE techniques relying on this type of mechanical contrast, such as compression OCE [67, 72, 104], could provide high-resolution 3D elastogram with superior spatial resolving ability for the detailed mechanical heterogeneity [85, 87]. However, due to the unknown distribution of the stress through the sample, the direct quantification of the Young’s modulus remains unavailable, which significantly limits the application of such techniques for accurate biomechanical comparison across samples. Also, the possible nonuniform distribution of the stress could lead to artefacts in the elastography results. Thus, methods that can provide the estimation of the stress distribution inside the sample will be highly useful, and the combination with these OCE techniques is expected to result in powerful biomechanical imaging/analysis tools. To this end, some of the recent simulation work has addressed this issue with numerically calculated distribution of the stress in a phantom with inclusion [68], as a foundation for the development of experimental methods. Very recently, an OCT-based tactile imaging method has been introduced with the capability of mapping the stress from the surface of the sample [160]. The stress map has been demonstrated to be well related to the features deep inside the sample [160]. However, the localization of the stress to all the available depth levels deserves further development, which might enable multi-model biomechanical imaging modality with high-resolution quantitative elastogram.
The quantitative ability has been considered as one of the major features for the OCE techniques based on the velocity of shear wave propagation [71, 116, 119]. Such quantification of the tissue Young’s modulus highly relies on the assumptions made to the mechanical performance of the tissue (described in Section 2.3), such as the negligible viscosity of the tissue. Especially, at the length scale of mechanical assessment by OCE (micrometres), the complexity of the tissue significantly increases from corresponding macro-descriptions [161], and might not hold certain assumptions. Therefore, it is of great importance to clearly understand how certain assumptions affect the accuracy of the Young’s modulus measurement. To date, no specific studies have been reported to provide systematic characterization regarding this topic. With similar work as an example [100], model-based simulations could be developed to describe the whole loading-measurement process of the shear waves in tissue. Such investigation is expected to provide new insights for the further development and optimization of the shear wave related OCE methods.
The development of OCE probe is one of the important steps to realize the clinical viability of OCE. For several applications, significant efforts have been made in this direction, which enables in vivo human studies [62, 63, 88] or significantly extends the capabilities of the existing technique [93]. Such work includes integrating the traditional air-puff stimulation with the OCT imaging beam [62, 63], applying ring actuator to have the compression loading and the OCT imaging from the same side [88], and putting OCE in a needle for deep tissue mechanical imaging [93]. As focused air-puff loading [113] has shown great promise in corneal elastography, the integration of the air-puff port and the OCT beam could lead to more convenient and efficient detection. For this purpose, forward scanning OCT probe [162] could be employed and bound to the air-puff delivery system. Having ultrasound remote stimulation with the OCT imaging beam from the same side could enable in situ experiments for certain applications, such as measuring the elastic properties of the crystalline lens [61]. The ring-shape ultrasound transducer is potentially useful to help achieve such configuration.
5. Conclusions
The field of OCE has recently drawn great attention and is experiencing rapid development due to its unique capabilities for the biomechanical characterization of tissue. Benefit from the micrometre-scale spatial resolution of OCT, OCE enables mechanical imaging and assessment at microscopic level, placing it a unique position among various nondestructive elasticity imaging and measurement techniques.
This review has described in detail the mechanical contrast employed by the current OCE techniques, and presented the state-of-the-art methods from the application point of view. Specifically, throughout the review, we indicate how the mechanical contrast is utilized in OCE, comment on the advantages and disadvantages of various OCE methods for the specific applications, and discuss the current challenges and the possible solutions for the further development of OCE. Based on all these contents, we emphasize the unique capabilities of OCE and also its promising future for the mechanical characterization of tissue.
As the closure of this review, we envisage three trends for the development of OCE. The first trend is the effort for quantitative high-resolution (micron-level) elastogram, which can be considered as the goal of OCE. The second trend is the more involvement of numerical simulations, as this type of work could significantly improve the current OCE methods. The third trend is the further shaping of the OCE system and the optimization of the processing algorithm, having OCE towards the clinical application.
Acknowledgements
This work was supported by the National Institute of Health with grant 1R01EY022362.
References
- [1].Greenleaf JF, Fatemi M, Insana M. Annu Rev Biomed Eng. 2003;5:57–78. doi: 10.1146/annurev.bioeng.5.040202.121623. [DOI] [PubMed] [Google Scholar]
- [2].Yamada H, Evans FG. Strength of biological materials. Lippincott Williams & Wilkins, Philadelphia; 1970. [Google Scholar]
- [3].Paszek MJ, Zahir N, Johnson KR, Lakins JN, Rozenberg GI, Gefen A, Reinhart-King CA, Margulies SS, Dembo M, Boettiger D, Hammer DA, Weaver VM. Cancer Cell. 2005;8:241–254. doi: 10.1016/j.ccr.2005.08.010. [DOI] [PubMed] [Google Scholar]
- [4].Zhi H, Ou B, Luo BM, Feng X, Wen YL, Yang HY. J Ultrasound Med. 2007;26:807–815. doi: 10.7863/jum.2007.26.6.807. [DOI] [PubMed] [Google Scholar]
- [5].McKnight AL, Kugel JL, Rossman PJ, Manduca A, Hartmann LC, Ehman RL. AJR Am J Roentgenol. 2002;178:1411–1417. doi: 10.2214/ajr.178.6.1781411. [DOI] [PubMed] [Google Scholar]
- [6].Probst LE. Complex cases with LASIK: advanced techniques and complication management. Slack Incorporated, Thorofare; 2000. [Google Scholar]
- [7].Pepose JS, Feigenbaum SK, Qazi MA, Sanderson JP, Roberts CJ. Am J Ophthalmol. 2007;143:39–47. doi: 10.1016/j.ajo.2006.09.036. [DOI] [PubMed] [Google Scholar]
- [8].Azeloglu EU, Costa KD. Conf Proc IEEE Eng Med Biol Soc. 2009;2009:7180–7183. doi: 10.1109/IEMBS.2009.5335316. [DOI] [PubMed] [Google Scholar]
- [9].Markowski W. Machine and method for uniaxial mechanical material testing. Google Patents; 1991. [Google Scholar]
- [10].Wollensak G, Spoerl E, Seiler T. J Cataract Refract Surg. 2003;29:1780–1785. doi: 10.1016/s0886-3350(03)00407-3. [DOI] [PubMed] [Google Scholar]
- [11].Choi S, Lee HJ, Cheong Y, Shin JH, Jin KH, Park HK, Park YG. Scanning. 2012;34:247–256. doi: 10.1002/sca.21001. [DOI] [PubMed] [Google Scholar]
- [12].Hollman KW, O’Donnell M, Erpelding TN. Exp Eye Res. 2007;85:890–893. doi: 10.1016/j.exer.2007.09.006. [DOI] [PMC free article] [PubMed] [Google Scholar]
- [13].Mueller S, Sandrin L. Hepat Med. 2010;2:49–67. doi: 10.2147/hmer.s7394. [DOI] [PMC free article] [PubMed] [Google Scholar]
- [14].Tanter M, Bercoff J, Athanasiou A, Deffieux T, Gennisson JL, Montaldo G, Muller M, Tardivon A, Fink M. Ultrasound Med Biol. 2008;34:1373–1386. doi: 10.1016/j.ultrasmedbio.2008.02.002. [DOI] [PubMed] [Google Scholar]
- [15].Protsenko DE, Zemek A, Wong BJ. Lasers Surg Med. 2008;40:202–210. doi: 10.1002/lsm.20611. [DOI] [PMC free article] [PubMed] [Google Scholar]
- [16].Agache PG, Monneur C, Leveque JL, De Rigal J. Arch Dermatol Res. 1980;269:221–232. doi: 10.1007/BF00406415. [DOI] [PubMed] [Google Scholar]
- [17].Shinohara M, Sabra K, Gennisson JL, Fink M, Tanter M. Muscle Nerve. 2010;42:438–441. doi: 10.1002/mus.21723. [DOI] [PubMed] [Google Scholar]
- [18].Lee RT, Richardson SG, Loree HM, Grodzinsky AJ, Gharib SA, Schoen FJ, Pandian N. Arterioscler Thromb. 1992;12:1–5. doi: 10.1161/01.atv.12.1.1. [DOI] [PubMed] [Google Scholar]
- [19].Li QS, Lee GYH, Ong CN, Lim CT. Biochemical and Biophysical Research Communications. 2008;374:609–613. doi: 10.1016/j.bbrc.2008.07.078. [DOI] [PubMed] [Google Scholar]
- [20].Maciaszek JL, Lykotrafitis G. J Biomech. 2011;44:657–661. doi: 10.1016/j.jbiomech.2010.11.008. [DOI] [PubMed] [Google Scholar]
- [21].Mitrofanova SI, Belaya EV, Sapuntsov LE, Khodorov BI. Mech Compos Mater. 1980;15:482–484. [Google Scholar]
- [22].Ophir J, Céspedes I, Ponnekanti H, Yazdi Y, Li X. Ultrasonic Imaging. 1991;13:111–134. doi: 10.1177/016173469101300201. [DOI] [PubMed] [Google Scholar]
- [23].Sarvazyan AP, Rudenko OV, Swanson SD, Fowlkes JB, Emelianov SY. Ultrasound Med Biol. 1998;24:1419–1435. doi: 10.1016/s0301-5629(98)00110-0. [DOI] [PubMed] [Google Scholar]
- [24].Nightingale K, Soo MS, Nightingale R, Trahey G. Ultrasound in Medicine & Biology. 2002;28:227–235. doi: 10.1016/s0301-5629(01)00499-9. [DOI] [PubMed] [Google Scholar]
- [25].Manduca A, Oliphant TE, Dresner MA, Mahowald JL, Kruse SA, Amromin E, Felmlee JP, Greenleaf JF, Ehman RL. Medical Image Analysis. 2001;5:237–254. doi: 10.1016/s1361-8415(00)00039-6. [DOI] [PubMed] [Google Scholar]
- [26].Itoh A, Ueno E, Tohno E, Kamma H, Takahashi H, Shiina T, Yamakawa M, Matsumura T. Radiology. 2006;239:341–350. doi: 10.1148/radiol.2391041676. [DOI] [PubMed] [Google Scholar]
- [27].McKnight AL, Kugel JL, Rossman PJ, Manduca A, Hartmann LC, Ehman RL. American Journal of Roentgenology. 2002;178:1411–1417. doi: 10.2214/ajr.178.6.1781411. [DOI] [PubMed] [Google Scholar]
- [28].Righetti R, Ophir J, Ktonas P. Ultrasound Med Biol. 2002;28:101–113. doi: 10.1016/s0301-5629(01)00495-1. [DOI] [PubMed] [Google Scholar]
- [29].Thitaikumar A, Righetti R, Krouskop TA, Ophir J. Phys Med Biol. 2006;51:5245–5257. doi: 10.1088/0031-9155/51/20/011. [DOI] [PubMed] [Google Scholar]
- [30].Braun J, Guo J, Lützkendorf R, Stadler J, Papazoglou S, Hirsch S, Sack I, Bernarding J. NeuroImage. 2014;90:308–314. doi: 10.1016/j.neuroimage.2013.12.032. [DOI] [PubMed] [Google Scholar]
- [31].Johnson CL, McGarry MD, Van Houten EE, Weaver JB, Paulsen KD, Sutton BP, Georgiadis JG. Magn Reson Med. 2013;70:404–412. doi: 10.1002/mrm.24473. [DOI] [PMC free article] [PubMed] [Google Scholar]
- [32].Rotsch C, Radmacher M. Biophys J. 2000;78:520–535. doi: 10.1016/S0006-3495(00)76614-8. [DOI] [PMC free article] [PubMed] [Google Scholar]
- [33].Costa KD. Dis Markers. 2003;19:139–154. doi: 10.1155/2004/482680. [DOI] [PMC free article] [PubMed] [Google Scholar]
- [34].Kuznetsova TG, Starodubtseva MN, Yegorenkov NI, Chizhik SA, Zhdanov RI. Micron. 2007;38:824–833. doi: 10.1016/j.micron.2007.06.011. [DOI] [PubMed] [Google Scholar]
- [35].Kirmizis D, Logothetidis S. Int J Nanomedicine. 2010;5:137–145. doi: 10.2147/ijn.s5787. [DOI] [PMC free article] [PubMed] [Google Scholar]
- [36].Fung YC. Biomechanics: Mechanical Properties of Living Tissues. Springer; New York: 1993. [Google Scholar]
- [37].Humphrey JD. Proceedings of the Royal Society of London. Series A: Mathematical, Physical and Engineering Sciences. 2003;459:3–46. [Google Scholar]
- [38].Jacques SL, Kirkpatrick SJ. Optics Letters. 1998;23:879–881. doi: 10.1364/ol.23.000879. [DOI] [PubMed] [Google Scholar]
- [39].Liang X, Graf B, Boppart S. Cel. Mol. Bioeng. 2011;4:231–238. doi: 10.1007/s12195-010-0147-6. [DOI] [PMC free article] [PubMed] [Google Scholar]
- [40].Scarcelli G, Yun SH. Nat Photon. 2008;2:39–43. doi: 10.1038/nphoton.2007.250. [DOI] [PMC free article] [PubMed] [Google Scholar]
- [41].Schmitt JM. Selected Topics in Quantum Electronics, IEEE Journal of. 1999;5:1205–1215. [Google Scholar]
- [42].Huang D, Swanson E, Lin C, Schuman J, Stinson W, Chang W, Hee M, Flotte T, Gregory K, Puliafito C, Fujimoto JG. Science. 1991;254:1178–1181. doi: 10.1126/science.1957169. [DOI] [PMC free article] [PubMed] [Google Scholar]
- [43].Fujimoto JG, Pitris C, Boppart SA, Brezinski ME. Neoplasia. 2000;2:9–25. doi: 10.1038/sj.neo.7900071. [DOI] [PMC free article] [PubMed] [Google Scholar]
- [44].Schmitt J. Opt. Express. 1998;3:199–211. doi: 10.1364/oe.3.000199. [DOI] [PubMed] [Google Scholar]
- [45].Liang X, Crecea V, Boppart SA. J Innov Opt Health Sci. 2010;3:221–233. doi: 10.1142/S1793545810001180. [DOI] [PMC free article] [PubMed] [Google Scholar]
- [46].Sun C, Standish B, Yang VXD. Journal of Biomedical Optics. 2011;16:043001–043001. doi: 10.1117/1.3560294. [DOI] [PubMed] [Google Scholar]
- [47].Kennedy BF, Kennedy KM, Sampson DD. Selected Topics in Quantum Electronics, IEEE Journal of. 2014;20:1–17. [Google Scholar]
- [48].Rogowska J, Patel NA, Fujimoto JG, Brezinski ME. Heart. 2004;90:556–562. doi: 10.1136/hrt.2003.016956. [DOI] [PMC free article] [PubMed] [Google Scholar]
- [49].Chan R, Chau A, Karl W, Nadkarni S, Khalil A, Iftimia N, Shishkov M, Tearney G, Kaazempur-Mofrad M, Bouma B. Optics Express. 2004;12:4558–4572. doi: 10.1364/opex.12.004558. [DOI] [PubMed] [Google Scholar]
- [50].Chau A, Chan R, Shishkov M, MacNeill B, Iftimia N, Tearney G, Kamm R, Bouma B, Kaazempur-Mofrad M. Annals of Biomedical Engineering. 2004;32:1494–1503. doi: 10.1114/b:abme.0000049034.75368.4a. [DOI] [PubMed] [Google Scholar]
- [51].Khalil A, Chan R, Chau A, Bouma B, Mofrad MK. Annals of Biomedical Engineering. 2005;33:1631–1639. doi: 10.1007/s10439-005-6766-3. [DOI] [PubMed] [Google Scholar]
- [52].Zhao Y, Chen Z, Saxer C, Xiang S, de Boer JF, Nelson JS. Optics Letters. 2000;25:114–116. doi: 10.1364/ol.25.000114. [DOI] [PubMed] [Google Scholar]
- [53].Kirkpatrick SJ, Wang RK, Duncan DD. Optics Express. 2006;14:11585–11597. doi: 10.1364/oe.14.011585. [DOI] [PubMed] [Google Scholar]
- [54].Wang RK, Nuttall AL. Journal of Biomedical Optics. 2010;15:056005-056005–056009. doi: 10.1117/1.3486543. [DOI] [PMC free article] [PubMed] [Google Scholar]
- [55].Wang RK, Ma Z, Kirkpatrick SJ. Applied Physics Letters. 2006;89:144103. [Google Scholar]
- [56].Liang X, Orescanin M, Toohey K, Insana M, Boppart S. Opt. Lett. 2009;34:2894–2896. doi: 10.1364/OL.34.002894. [DOI] [PMC free article] [PubMed] [Google Scholar]
- [57].Crecea V, Oldenburg AL, Liang X, Ralston TS, Boppart SA. Opt. Express. 2009;17:23114–23122. doi: 10.1364/OE.17.023114. [DOI] [PMC free article] [PubMed] [Google Scholar]
- [58].Li C, Huang Z, Wang RK. Opt. Express. 2011;19:10153–10163. doi: 10.1364/OE.19.010153. [DOI] [PubMed] [Google Scholar]
- [59].Razani M, Mariampillai A, Sun C, Luk TWH, Yang VXD, Kolios MC. Biomed. Opt. Express. 2012;3:972–980. doi: 10.1364/BOE.3.000972. [DOI] [PMC free article] [PubMed] [Google Scholar]
- [60].Qi W, Li R, Ma T, Kirk Shung K, Zhou Q, Chen Z. Appl Phys Lett. 2014;104:123702. doi: 10.1063/1.4869562. [DOI] [PMC free article] [PubMed] [Google Scholar]
- [61].Wang S, Aglyamov S, Karpiouk A, Li J, Emelianov S, Manns F, Larin KV. Biomedical Optics Express. 2013;4:2769–2780. doi: 10.1364/BOE.4.002769. [DOI] [PMC free article] [PubMed] [Google Scholar]
- [62].Alonso-Caneiro D, Karnowski K, Kaluzny BJ, Kowalczyk A, Wojtkowski M. Opt. Express. 2011;19:14188–14199. doi: 10.1364/OE.19.014188. [DOI] [PubMed] [Google Scholar]
- [63].Dorronsoro C, Pascual D, Pérez-Merino P, Kling S, Marcos S. Biomed. Opt. Express. 2012;3:473–487. doi: 10.1364/BOE.3.000473. [DOI] [PMC free article] [PubMed] [Google Scholar]
- [64].Wang S, Larin KV, Li J, Vantipalli S, Manapuram RK, Aglyamov S, Emelianov S, Twa MD. Laser Physics Letters. 2013;10:075605. doi: 10.1088/1612-2011/10/7/075605. [DOI] [PMC free article] [PubMed] [Google Scholar]
- [65].Crecea V, Ahmad A, Boppart SA. J Biomed Opt. 2013;18:121504. doi: 10.1117/1.JBO.18.12.121504. [DOI] [PMC free article] [PubMed] [Google Scholar]
- [66].Ahmad A, Kim J, Sobh NA, Shemonski ND, Boppart SA. Biomed Opt Express. 2014;5:2349–2361. doi: 10.1364/BOE.5.002349. [DOI] [PMC free article] [PubMed] [Google Scholar]
- [67].Nahas A, Bauer M, Roux S, Boccara AC. Biomed Opt Express. 2013;4:2138–2149. doi: 10.1364/BOE.4.002138. [DOI] [PMC free article] [PubMed] [Google Scholar]
- [68].Kennedy KM, Ford C, Kennedy BF, Bush MB, Sampson DD. J Biomed Opt. 2013;18:121508. doi: 10.1117/1.JBO.18.12.121508. [DOI] [PubMed] [Google Scholar]
- [69].Li C, Guan G, Cheng X, Huang Z, Wang RK. Opt. Lett. 2012;37:722–724. doi: 10.1364/OL.37.000722. [DOI] [PubMed] [Google Scholar]
- [70].Adie SG, Liang X, Kennedy BF, John R, Sampson DD, Boppart SA. Opt. Express. 2010;18:25519–25534. doi: 10.1364/OE.18.025519. [DOI] [PMC free article] [PubMed] [Google Scholar]
- [71].Song S, Huang Z, Nguyen T-M, Wong EY, Arnal B, O’Donnell M, Wang RK. Journal of Biomedical Optics. 2013;18:121509–121509. doi: 10.1117/1.JBO.18.12.121509. [DOI] [PMC free article] [PubMed] [Google Scholar]
- [72].Kennedy BF, Liang X, Adie SG, Gerstmann DK, Quirk BC, Boppart SA, Sampson DD. Opt. Express. 2011;19:6623–6634. doi: 10.1364/OE.19.006623. [DOI] [PMC free article] [PubMed] [Google Scholar]
- [73].Li C, Guan G, Reif R, Huang Z, Wang RK. J R Soc Interface. 2012;9:831–841. doi: 10.1098/rsif.2011.0583. [DOI] [PMC free article] [PubMed] [Google Scholar]
- [74].Tanter M, Touboul D, Gennisson JL, Bercoff J, Fink M. IEEE Trans Med Imaging. 2009;28:1881–1893. doi: 10.1109/TMI.2009.2021471. [DOI] [PubMed] [Google Scholar]
- [75].Sinkus R, Lorenzen J, Schrader D, Lorenzen M, Dargatz M, Holz D. Phys Med Biol. 2000;45:1649–1664. doi: 10.1088/0031-9155/45/6/317. [DOI] [PubMed] [Google Scholar]
- [76].Azeloglu EU, Bhattacharya J, Costa KD. J Appl Physiol. 2008;105:652–661. doi: 10.1152/japplphysiol.00958.2007. [DOI] [PMC free article] [PubMed] [Google Scholar]
- [77].Nadkarni SK, Bouma BE, Helg T, Chan R, Halpern E, Chau A, Minsky MS, Motz JT, Houser SL, Tearney GJ. Circulation. 2005;112:885–892. doi: 10.1161/CIRCULATIONAHA.104.520098. [DOI] [PMC free article] [PubMed] [Google Scholar]
- [78].Mohan KD, Oldenburg AL. Optics Express. 2012;20:18887–18897. doi: 10.1364/OE.20.018887. [DOI] [PubMed] [Google Scholar]
- [79].Suheshkumar Singh M, Rajan K, Vasu RM. Journal of Applied Physics. 2011;109:104704. [Google Scholar]
- [80].Brandao MM, Fontes A, Barjas-Castro ML, Barbosa LC, Costa FF, Cesar CL, Saad ST. Eur J Haematol. 2003;70:207–211. doi: 10.1034/j.1600-0609.2003.00027.x. [DOI] [PubMed] [Google Scholar]
- [81].Beer F, Johnston ER, Jr., DeWolf J, Mazurek D. Mechanics of Materials. McGraw-Hill Education; Columbus: 2014. [Google Scholar]
- [82].Özkaya N, Nordin M, Goldsheyder D, Leger D. Fundamentals of Biomechanics: Equilibrium, Motion, and Deformation. Springer; 2012. [Google Scholar]
- [83].Cowin SC, Doty SB. Tissue Mechanics. Springer; 2007. [Google Scholar]
- [84].Ko HJ, Tan W, Stack R, Boppart SA. Tissue Eng. 2006;12:63–73. doi: 10.1089/ten.2006.12.63. [DOI] [PubMed] [Google Scholar]
- [85].Kennedy BF, McLaughlin RA, Kennedy KM, Chin L, Curatolo A, Tien A, Latham B, Saunders CM, Sampson DD. Biomedical Optics Express. 2014;5:2113–2124. doi: 10.1364/BOE.5.002113. [DOI] [PMC free article] [PubMed] [Google Scholar]
- [86].Kennedy BF, Malheiro FG, Chin L, Sampson DD. Journal of Biomedical Optics. 2014;19:076006–076006. doi: 10.1117/1.JBO.19.7.076006. [DOI] [PubMed] [Google Scholar]
- [87].Chin L, Kennedy BF, Kennedy KM, Wijesinghe P, Pinniger GJ, Terrill JR, McLaughlin RA, Sampson DD. Biomedical Optics Express. 2014;5:3090–3102. doi: 10.1364/BOE.5.003090. [DOI] [PMC free article] [PubMed] [Google Scholar]
- [88].Kennedy BF, Hillman TR, McLaughlin RA, Quirk BC, Sampson DD. Opt Express. 2009;17:21762–21772. doi: 10.1364/OE.17.021762. [DOI] [PubMed] [Google Scholar]
- [89].Wang RK, Kirkpatrick S, Hinds M. Applied Physics Letters. 2007;90:164105–164103. [Google Scholar]
- [90].Qi W, Chen R, Chou L, Liu G, Zhang J, Zhou Q, Chen Z. Journal of Biomedical Optics. 2012;17:110505–110505. doi: 10.1117/1.JBO.17.11.110505. [DOI] [PMC free article] [PubMed] [Google Scholar]
- [91].Adie SG, Kennedy BF, Armstrong JJ, Alexandrov SA, Sampson DD. Phys Med Biol. 2009;54:3129–3139. doi: 10.1088/0031-9155/54/10/011. [DOI] [PubMed] [Google Scholar]
- [92].Guan G, Li C, Ling Y, Yang Y, Vorstius JB, Keatch RP, Wang RK, Huang Z. Journal of Biomedical Optics. 2013;18:111417–111417. doi: 10.1117/1.JBO.18.11.111417. [DOI] [PubMed] [Google Scholar]
- [93].Kennedy KM, McLaughlin RA, Kennedy BF, Tien A, Latham B, Saunders CM, Sampson DD. J Biomed Opt. 2013;18:121510. doi: 10.1117/1.JBO.18.12.121510. [DOI] [PubMed] [Google Scholar]
- [94].Kennedy KM, Kennedy BF, McLaughlin RA, Sampson DD. Optics Letters. 2012;37:2310–2312. doi: 10.1364/OL.37.002310. [DOI] [PubMed] [Google Scholar]
- [95].Prasad PR, Bhattacharya S. J Biomed Opt. 2013;18:046007. doi: 10.1117/1.JBO.18.4.046007. [DOI] [PubMed] [Google Scholar]
- [96].Sun C, Standish B, Vuong B, Wen X-Y, Yang V. Journal of Biomedical Optics. 2013;18:121515–121515. doi: 10.1117/1.JBO.18.12.121515. [DOI] [PubMed] [Google Scholar]
- [97].Manapuram RK, Aglyamov S, Menodiado FM, Mashiatulla M, Wang S, Baranov SA, Li J, Emelianov S, Larin KV. Laser Phys. 2012;22:1–6. [Google Scholar]
- [98].Kennedy BF, Wojtkowski M, Szkulmowski M, Kennedy KM, Karnowski K, Sampson DD. Biomed. Opt. Express. 2012;3:3138–3152. doi: 10.1364/BOE.3.003138. [DOI] [PMC free article] [PubMed] [Google Scholar]
- [99].Kennedy BF, Koh SH, McLaughlin RA, Kennedy KM, Munro PRT, Sampson DD. Biomedical Optics Express. 2012;3:1865–1879. doi: 10.1364/BOE.3.001865. [DOI] [PMC free article] [PubMed] [Google Scholar]
- [100].Chin L, Curatolo A, Kennedy BF, Doyle BJ, Munro PRT, McLaughlin RA, Sampson DD. Biomedical Optics Express. 2014;5:2913–2930. doi: 10.1364/BOE.5.002913. [DOI] [PMC free article] [PubMed] [Google Scholar]
- [101].Orescanin M, Toohey KS, Insana MF. J Acoust Soc Am. 2009;125:2928–2936. doi: 10.1121/1.3106129. [DOI] [PMC free article] [PubMed] [Google Scholar]
- [102].Liang X, Oldenburg AL, Crecea V, Chaney EJ, Boppart SA. Opt. Express. 2008;16:11052–11065. doi: 10.1364/oe.16.011052. [DOI] [PMC free article] [PubMed] [Google Scholar]
- [103].Yue X, Wang L, Wang R. International Journal of Biomedical Imaging. 2013;2013:12. doi: 10.1155/2013/781603. [DOI] [PMC free article] [PubMed] [Google Scholar]
- [104].Liang X, Adie SG, John R, Boppart SA. Opt. Express. 2010;18:14183–14190. doi: 10.1364/OE.18.014183. [DOI] [PMC free article] [PubMed] [Google Scholar]
- [105].Amy LO, Stephen AB. Physics in Medicine and Biology. 2010;55:1189. doi: 10.1088/0031-9155/55/4/019. [DOI] [PMC free article] [PubMed] [Google Scholar]
- [106].Oldenburg AL, Gongting W, Spivak D, Tsui F, Wolberg AS, Fischer TH. Selected Topics in Quantum Electronics, IEEE Journal of. 2012;18:1100–1109. doi: 10.1109/JSTQE.2011.2162580. [DOI] [PMC free article] [PubMed] [Google Scholar]
- [107].Qi W, Li R, Ma T, Li J, Kirk Shung K, Zhou Q, Chen Z. Appl Phys Lett. 2013;103:103704. doi: 10.1063/1.4820252. [DOI] [PMC free article] [PubMed] [Google Scholar]
- [108].Carcione JJM. Wave Fields in Real Media: Wave Propagation in Anisotropic, Anelastic, Porous and Electromagnetic Media. Elsevier Science; 2007. [Google Scholar]
- [109].Chapman C. Fundamentals of Seismic Wave Propagation. Cambridge University Press; 2004. [Google Scholar]
- [110].Haddad YM. Viscoelasticity of Engineering Materials. Chapman & Hall; 1995. [Google Scholar]
- [111].Yamakoshi Y, Sato J, Sato T. IEEE Trans Ultrason Ferroelectr Freq Control. 1990;37:45–53. doi: 10.1109/58.46969. [DOI] [PubMed] [Google Scholar]
- [112].Wells PN, Liang HD. J R Soc Interface. 2011;8:1521–1549. doi: 10.1098/rsif.2011.0054. [DOI] [PMC free article] [PubMed] [Google Scholar]
- [113].Wang S, Larin KV. Opt Lett. 2014;39:41–44. doi: 10.1364/OL.39.000041. [DOI] [PMC free article] [PubMed] [Google Scholar]
- [114].Fink M, Tanter M. Physicstoday. 2010;63:28–33. [Google Scholar]
- [115].Song S, Huang Z, Wang RK. Journal of Biomedical Optics. 2013;18:121505–121505. doi: 10.1117/1.JBO.18.12.121505. [DOI] [PubMed] [Google Scholar]
- [116].Wang S, Lopez AL, Morikawa Y, Tao G, Li J, Larina IV, Martin JF, Larin KV. Biomedical Optics Express. 2014;5:1980–1992. doi: 10.1364/BOE.5.001980. [DOI] [PMC free article] [PubMed] [Google Scholar]
- [117].Nguyen T-M, Song S, Arnal B, Huang Z, O?Donnell M, Wang RK. Optics Letters. 2014;39:838–841. doi: 10.1364/OL.39.000838. [DOI] [PMC free article] [PubMed] [Google Scholar]
- [118].Nahas A, Tanter M, Nguyen T-M, Chassot J-M, Fink M, Claude Boccara A. Journal of Biomedical Optics. 2013;18:121514–121514. doi: 10.1117/1.JBO.18.12.121514. [DOI] [PubMed] [Google Scholar]
- [119].Razani M, Luk TWH, Mariampillai A, Siegler P, Kiehl T-R, Kolios MC, Yang VXD. Biomedical Optics Express. 2014;5:895–906. doi: 10.1364/BOE.5.000895. [DOI] [PMC free article] [PubMed] [Google Scholar]
- [120].Nguyen TM, Song S, Arnal B, Wong EY, Huang Z, Wang RK, O’Donnell M. J Biomed Opt. 2014;19:16013. doi: 10.1117/1.JBO.19.1.016013. [DOI] [PMC free article] [PubMed] [Google Scholar]
- [121].Bedford A, Drumheller DS. Introduction to Elastic Wave Propagation. Wiley; 1996. [Google Scholar]
- [122].Li C, Guan G, Huang Z, Johnstone M, Wang RK. Opt. Lett. 2012;37:1625–1627. doi: 10.1364/OL.37.001625. [DOI] [PubMed] [Google Scholar]
- [123].Wang S, Li J, Manapuram RK, Menodiado FM, Ingram DR, Twa MD, Lazar AJ, Lev DC, Pollock RE, Larin KV. Opt. Lett. 2012;37:5184–5186. doi: 10.1364/OL.37.005184. [DOI] [PMC free article] [PubMed] [Google Scholar]
- [124].Liang X, Boppart SA. Biomedical Engineering, IEEE Transactions on. 2010;57:953–959. doi: 10.1109/TBME.2009.2033464. [DOI] [PMC free article] [PubMed] [Google Scholar]
- [125].Li C, Guan G, Li S, Huang Z, Wang RK. Journal of Biomedical Optics. 2012;17:0570021–05700210. doi: 10.1117/1.JBO.17.5.057002. [DOI] [PubMed] [Google Scholar]
- [126].Jiasong L, Shang W, Singh M, Aglyamov S, Emelianov S, Twa MD, Larin KV. Laser Physics Letters. 2014;11:065601. doi: 10.1088/1612-2011/10/7/075605. [DOI] [PMC free article] [PubMed] [Google Scholar]
- [127].Zaitsev VY, Matveev LA, Matveyev AL, Gelikonov GV, Gelikonov VM. Journal of Biomedical Optics. 2013;19:021107–021107. doi: 10.1117/1.JBO.19.2.021107. [DOI] [PubMed] [Google Scholar]
- [128].Zaitsev VY, Matveev LA, V GG, Matveyev AL, Gelikonov GV. Laser Physics Letters. 2013;10:065601. [Google Scholar]
- [129].Shah S, Laiquzzaman M, Bhojwani R, Mantry S, Cunliffe I. Investigative Ophthalmology & Visual Science. 2007;48:3026–3031. doi: 10.1167/iovs.04-0694. [DOI] [PubMed] [Google Scholar]
- [130].Edmund C. Acta Ophthalmol (Copenh) 1988;66:134–140. doi: 10.1111/j.1755-3768.1988.tb04000.x. [DOI] [PubMed] [Google Scholar]
- [131].Spoerl E, Huhle M, Seiler T. Exp Eye Res. 1998;66:97–103. doi: 10.1006/exer.1997.0410. [DOI] [PubMed] [Google Scholar]
- [132].Ford MR, Dupps WJ, Jr., Rollins AM, Roy AS, Hu Z. J Biomed Opt. 2011;16:016005. doi: 10.1117/1.3526701. [DOI] [PMC free article] [PubMed] [Google Scholar]
- [133].Manapuram RK, Aglyamov SR, Monediado FM, Mashiatulla M, Li J, Emelianov SY, Larin KV. J Biomed Opt. 2012;17:100501. doi: 10.1117/1.JBO.17.10.100501. [DOI] [PMC free article] [PubMed] [Google Scholar]
- [134].Li J, Wang S, Manapuram RK, Singh M, Menodiado FM, Aglyamov S, Emelianov S, Twa MD, Larin KV. Journal of Biomedical Optics. 2013;18:121503–121503. doi: 10.1117/1.JBO.18.12.121503. [DOI] [PMC free article] [PubMed] [Google Scholar]
- [135].Twa MD, Li J, Vantipalli S, Singh M, Aglyamov S, Emelianov S, Larin KV. Biomedical Optics Express. 2014;5:1419–1427. doi: 10.1364/BOE.5.001419. [DOI] [PMC free article] [PubMed] [Google Scholar]
- [136].Song S, Huang Z, Nguyen T-M, Wong EY, Arnal B, O’Donnell M, Wang RK. In: Optical Coherence Tomography and Coherence Domain Optical Methods in Biomedicine XVIII. Izatt JA, Fujimoto JG, Tuchin VV, editors. SPIE; San Francisco: 2014. pp. 89340U-89340U–89346. [Google Scholar]
- [137].Wang S, Larin KV. In: Optical Elastography and Tissue Biomechanics. Larin KV, Sampson DD, editors. SPIE; San Francisco: 2014. pp. 894608-894608–894606. [Google Scholar]
- [138].Wang S, Larin KV. Biomedical Optics Express. 2014;5:3807–3821. doi: 10.1364/BOE.5.003807. [DOI] [PMC free article] [PubMed] [Google Scholar]
- [139].Li C, Guan G, Zhang F, Nabi G, Wang RK, Huang Z. Biomedical Optics Express. 2014;5:1403–1418. doi: 10.1364/BOE.5.001403. [DOI] [PMC free article] [PubMed] [Google Scholar]
- [140].Thu-Mai N, Gennisson JL, Couade M, Touboul D, Humbert P, Bercoff J, Fink M, Tanter M. Ultrasonics Symposium (IUS); 2010; pp. 1145–1148. IEEE(2010) [Google Scholar]
- [141].Cheng GC, Loree HM, Kamm RD, Fishbein MC, Lee RT. Circulation. 1993;87:1179–1187. doi: 10.1161/01.cir.87.4.1179. [DOI] [PubMed] [Google Scholar]
- [142].van der Steen AF, de Korte CL, Cespedes EI. Ultraschall Med. 1998;19:196–201. doi: 10.1055/s-2007-1000491. [DOI] [PubMed] [Google Scholar]
- [143].de Korte CL, van der Steen AF, Cepedes EI, Pasterkamp G, Carlier SG, Mastik F, Schoneveld AH, Serruys PW, Bom N. Phys Med Biol. 2000;45:1465–1475. doi: 10.1088/0031-9155/45/6/305. [DOI] [PubMed] [Google Scholar]
- [144].van Soest G, Mastik F, de Jong N, van der Steen AF. Phys Med Biol. 2007;52:2445–2458. doi: 10.1088/0031-9155/52/9/008. [DOI] [PubMed] [Google Scholar]
- [145].Karimi R, Chan R, Houser S, Bouma BB, Kaazempur Mofrad MR. Biomedical Imaging: Nano to Macro; 3rd IEEE International Symposium on(2006); 2006.pp. 602–605. [Google Scholar]
- [146].van Soest G, Bouchard RR, Mastik F, de Jong N, van der Steen AFW. In: Optical Coherence Tomography and Coherence Techniques III. Andersen PE, Chen Z, editors. SPIE; Munich, Germany: 2007. pp. 66270E-66270E–66210. [Google Scholar]
- [147].Escoffier C, de Rigal J, Rochefort A, Vasselet R, Leveque J-L, Agache PG. J Investig Dermatol. 1989;93:353–357. [PubMed] [Google Scholar]
- [148].Enomoto DN, Mekkes JR, Bossuyt PM, Hoekzema R, Bos JD. J Am Acad Dermatol. 1996;35:381–387. doi: 10.1016/s0190-9622(96)90601-5. [DOI] [PubMed] [Google Scholar]
- [149].Hinz T, Hoeller T, Wenzel J, Bieber T, Schmid-Wendtner MH. Dermatology. 2013;226:81–90. doi: 10.1159/000346942. [DOI] [PubMed] [Google Scholar]
- [150].Mogensen M, Thrane L, Jørgensen TM, Andersen PE, Jemec GBE. Journal of Biophotonics. 2009;2:442–451. doi: 10.1002/jbio.200910020. [DOI] [PubMed] [Google Scholar]
- [151].Suresh S, Spatz J, Mills JP, Micoulet A, Dao M, Lim CT, Beil M, Seufferlein T. Acta Biomater. 2005;1:15–30. doi: 10.1016/j.actbio.2004.09.001. [DOI] [PubMed] [Google Scholar]
- [152].Crecea V, Graf BW, Taewoo K, Popescu G, Boppart SA. Selected Topics in Quantum Electronics, IEEE Journal of. 2014;20:25–31. doi: 10.1109/JSTQE.2013.2280501. [DOI] [PMC free article] [PubMed] [Google Scholar]
- [153].Weeber HA, van der Heijde RG. Exp Eye Res. 2007;85:602–607. doi: 10.1016/j.exer.2007.07.012. [DOI] [PubMed] [Google Scholar]
- [154].Atchison DA. Ophthalmic and Physiological Optics. 1995;15:255–272. [PubMed] [Google Scholar]
- [155].Manapuram RK, Baranov SA, Manne VGR, Sudheendran N, Mashiatulla M, Aglyamov S, Emelianov S, Larin KV. Laser Physics Letters. 2011;8:164–168. [Google Scholar]
- [156].Wu C, Han Z, Wang S, Li J, Singh M, Liu C-H, Aglyamov S, Emelianov S, Manns F, Larin KV. IOVS. 2014 doi: 10.1167/iovs.14-15654. under review. [DOI] [PMC free article] [PubMed] [Google Scholar]
- [157].Martin I, Obradovic B, Treppo S, Grodzinsky AJ, Langer R, Freed LE, Vunjak-Novakovic G. Biorheology. 2000;37:141–147. [PubMed] [Google Scholar]
- [158].Robertson C, Lee S-W, Ahn Y-C, Mahon S, Chen Z, Brenner M, George SC. Journal of Biomedical Optics. 2011;16:106011-106011–106018. doi: 10.1117/1.3642006. [DOI] [PMC free article] [PubMed] [Google Scholar]
- [159].Liu C-H, Skryabina MN, Li J, Singh M, Sobol EN, Larin KV. Quantum Electronics. 2014;44:751–756. [Google Scholar]
- [160].Kennedy KM, Es?haghian S, Chin L, McLaughlin RA, Sampson DD, Kennedy BF. Optics Letters. 2014;39:3014–3017. doi: 10.1364/OL.39.003014. [DOI] [PubMed] [Google Scholar]
- [161].Tuchin VV. Handbook of Optical Biomedical Diagnostics. Society of Photo Optical; 2002. [Google Scholar]
- [162].Wu J, Conry M, Gu C, Wang F, Yaqoob Z, Yang C. Opt Lett. 2006;31:1265–1267. doi: 10.1364/ol.31.001265. [DOI] [PubMed] [Google Scholar]