

Abstract
The congenital disorders of glycosylation (CDG), a group of inherited diseases characterized by aberrant glycosylation, encompass a wide range of defects, including glycosyltransferases, glycosidases, nucleotide-sugar transporters as well as proteins involved in maintaining Golgi architecture, pH and vesicular trafficking. Mutations in a previously undescribed protein, TMEM165, were recently shown to cause a new form of CDG, termed TMEM165-CDG. TMEM165-CDG patients exhibit cartilage and bone dysplasia and altered glycosylation of serum glycoproteins. We utilized a morpholino knockdown strategy in zebrafish to investigate the physiologic and pathogenic functions of TMEM165. Inhibition of tmem165 expression in developing zebrafish embryos caused craniofacial abnormalities, largely attributable to fewer chondrocytes. Decreased expression of several markers of cartilage and bone development suggests that Tmem165 deficiency alters both chondrocyte and osteoblast differentiation. Glycomic analysis of tmem165 morphants also revealed altered initiation, processing and extension of N-glycans, paralleling some of the glycosylation changes noted in human patients. Collectively, these findings highlight the utility of zebrafish to elucidate pathogenic mechanisms associated with glycosylation disorders and suggest that the cartilage and bone dysplasia manifested in TMEM165-CDG patients may stem from abnormal development of chondrocytes and osteoblasts.
Keywords: cartilage, congenital disorders of glycosylation, N-glycosylation, zebrafish
Introduction
The congenital disorders of glycosylation (CDG) are inherited diseases characterized by defective protein and lipid glycosylation (Freeze 2006). The protein N-glycosylation diseases are multisystem disorders traditionally divided into two groups. The largest group, type I CDG (CDG-I), results from defects either in the assembly of the lipid-linked oligosaccharide precursor (LLO) Glc3Man9GlcNAc2-P-P-dolichol (G3M9Gn2-P-P-Dol) or its transfer to the nascent polypeptides in the ER. The second group, type II CDG (CDG-II), results from alterations in the processing or remodeling of protein-bound glycan chains. Type II CDG encompasses defects in glycosidases, glycosyltransferases, sugar-nucleotide transporters as well as proteins involved in Golgi trafficking, structure and pH homeostasis (Jaeken and Matthijs 2007). In light of the ability of this latter group to alter the global environment necessary for proper glycosylation, CDG-II results in structural changes within multiple classes of glycans (e.g. N- and O-glycans) (Foulquier 2009; Jaeken et al. 2009).
Mutations in the protein TMEM165 (transmembrane protein 165) were recently shown in two siblings to cause a novel type II CDG (Foulquier et al. 2012). These patients presented with psychomotor retardation, pronounced dwarfism and marked skeletal dysplasias including joint anomalies (Zeevaert et al. 2013). Serum transferrin isoelectric focusing revealed an abnormal pattern consistent with type II CDG, prompting efforts to identify the genetic basis for the disease. Autozygosity mapping and mRNA expression profiling in the two affected siblings uncovered a homozygous mutation within the previously uncharacterized transmembrane protein TMEM165. Sequence analysis of TMEM165 cDNA revealed that this mutation activates a cryptic splice donor site (c.792+182G>A) that leads to the generation of two different transcripts. Glycomic analysis of N-glycans revealed an increase in the relative abundance of undersialylated and undergalactosylated glycans. Sequencing of TMEM165 in a group of unsolved CDG-IIx patients identified three additional patients with mutations in TMEM165: one containing the previously described homozygous mutation (c.792+182G>A) and two unrelated individuals with missense mutations [one homozygous for c.377G>A (p.R126H) and another compound heterozygous for c.376C>T (p.R126C) and c.911G>A (p.G304R)] (Foulquier et al. 2012). The patients harboring missense mutations exhibit a less severe clinical presentation.
The TMEM165 gene encodes a ubiquitously expressed 324 amino acid protein containing 6–7 transmembrane-spanning domains (Foulquier et al. 2012). Highly conserved within eukaryotes, TMEM165 belongs to the UPF0016 family of integral membrane proteins of unknown function. Based on predicted topology and the comparative phylogeny, it is proposed to function in Golgi proton/calcium transport (Rosnoblet et al. 2013). This is supported by studies in yeast, which have suggested that TMEM165 is a member of Golgi-localized Ca2+/H+ antiporters thought to play an important role in the maintenance of the Golgi Ca2+ and pH homeostasis. Despite growing insight into the molecular function of TMEM165 and its yeast ortholog Gdt1, the physiological relevance of this protein during development, particularly within the skeletal system, remains poorly understood.
In an effort to improve our understanding of its physiological function, we employed a morpholino-based approach to reduce tmem165 expression in developing zebrafish. Our results indicate that this protein is essential for proper cartilage development, as tmem165-deficient embryos exhibit alterations in both craniofacial morphology and expression of markers for cartilage and bone maturation. Mass spectrometric analyses of control and morphant embryos demonstrated that tmem165 is necessary for proper initiation and processing of zebrafish N-glycans, a finding consistent with the CDG phenotype seen in human patients. This work not only lends new insight into potential cellular mechanisms by which loss of Tmem165 function affects cartilage and bone development but also establishes zebrafish as an appropriate model system to further study its physiological function.
Results
Zebrafish express a single tmem165
BLAST searches of the zebrafish genome assemblies and EST databases using the human TMEM165 amino acid sequence identified a single homolog sharing 35% identity at nucleotide level. The identified sequence is predicted to encode a protein that is 79% identical to human TMEM165 (Figure 1A). Alignment of these two proteins with the mouse and yeast homologs revealed a high level of conservation within the vertebrate genomes, with particular regions also shared with yeast. These include two hydrophobic domains containing an EXGDK/RT/S internal motif (termed α1 and α2, highlighted in gray, Figure 1A), and the lysosomal internalization motif YNRL (in bold, Figure 1A) (Foulquier et al. 2012). Acidic residues noted within the α1 and α2 motifs are found in several cation binding proteins, including calreticulin (Ivey et al. 1993; Demaegd et al. 2013). Phobius analysis, which predicts transmembrane topology and the presence of signal peptides, suggests that like its human homolog, the BLAST-identified zebrafish Tmem165 is also a protein with a 6–7 transmembrane-spanning domains (Figure 1B). Several point mutations found in human patients are indicated (Figure 1B).
Fig. 1.

In silico analysis of Tmem165. (A) Alignment of human TMEM165 with other proteins of the same family (ClustalW). The following sequences are shown: Homo sapiens: NP_060945.2; Danio rerio: NP_997848.1; Mus musculus: NP 035756.2 Saccharomyces cerevisiae S288c: NP_009746.1. The strictly conserved EXGDK/RT/S motif is highlighted in gray, the lysosomal targeting motif (YNRL) in bold [adapted from Foulquier et al. (Foulquier et al. 2012)]. (B) Predicted topology of human TMEM165. Mutations are listed in boxed regions and lysosomal targeting motifs are shown. This figure is available in black and white in print and in colour at Glycobiology online.
Tmem165 is expressed throughout early zebrafish development
To establish the feasibility of morpholino knockdown of tmem165 in zebrafish embryos, quantitative real-time polymerase chain reaction (PCR) was used to assess its expression during development (Figure 2A). These analyses, ranging from 0 to 8 days post-fertilization (dpf), showed that tmem165 is expressed at relatively constant levels during early stages of development. Further, the presence of transcripts in newly fertilized eggs (represented by the 0 time-point) show that it is also maternally deposited into egg yolks. To characterize the spatial pattern of tmem165 expression, whole-mount in situ hybridizations (ISHs) were performed on embryos 1, 2 and 4 dpf (Figure 2B). In situ analyses suggest that at 1 dpf tmem165 is highly expressed in the embryonic head and heart (see magnified panels, Figure 2B right). Lighter staining was noted in regions of the trunk at this time-point. By 2 dpf, while tmem165 expression was still evident in embryonic heads, its expression was most concentrated in the ventral regions positioned directly anterior to the heart and yolk (see arrowhead Figure 2B). Similarly, in 2-d-old hearts, tmem165 expression also became more restricted, in this case to the midline between the two chambers (see arrowhead right panel, Figure 2B). A high level of expression was maintained throughout the head at 4 dpf. ISH experiments performed with the corresponding sense control probe gave no signal, indicating that staining patterns detected with the tmem165 antisense probe were not the result of nonspecific staining.
Fig. 2.
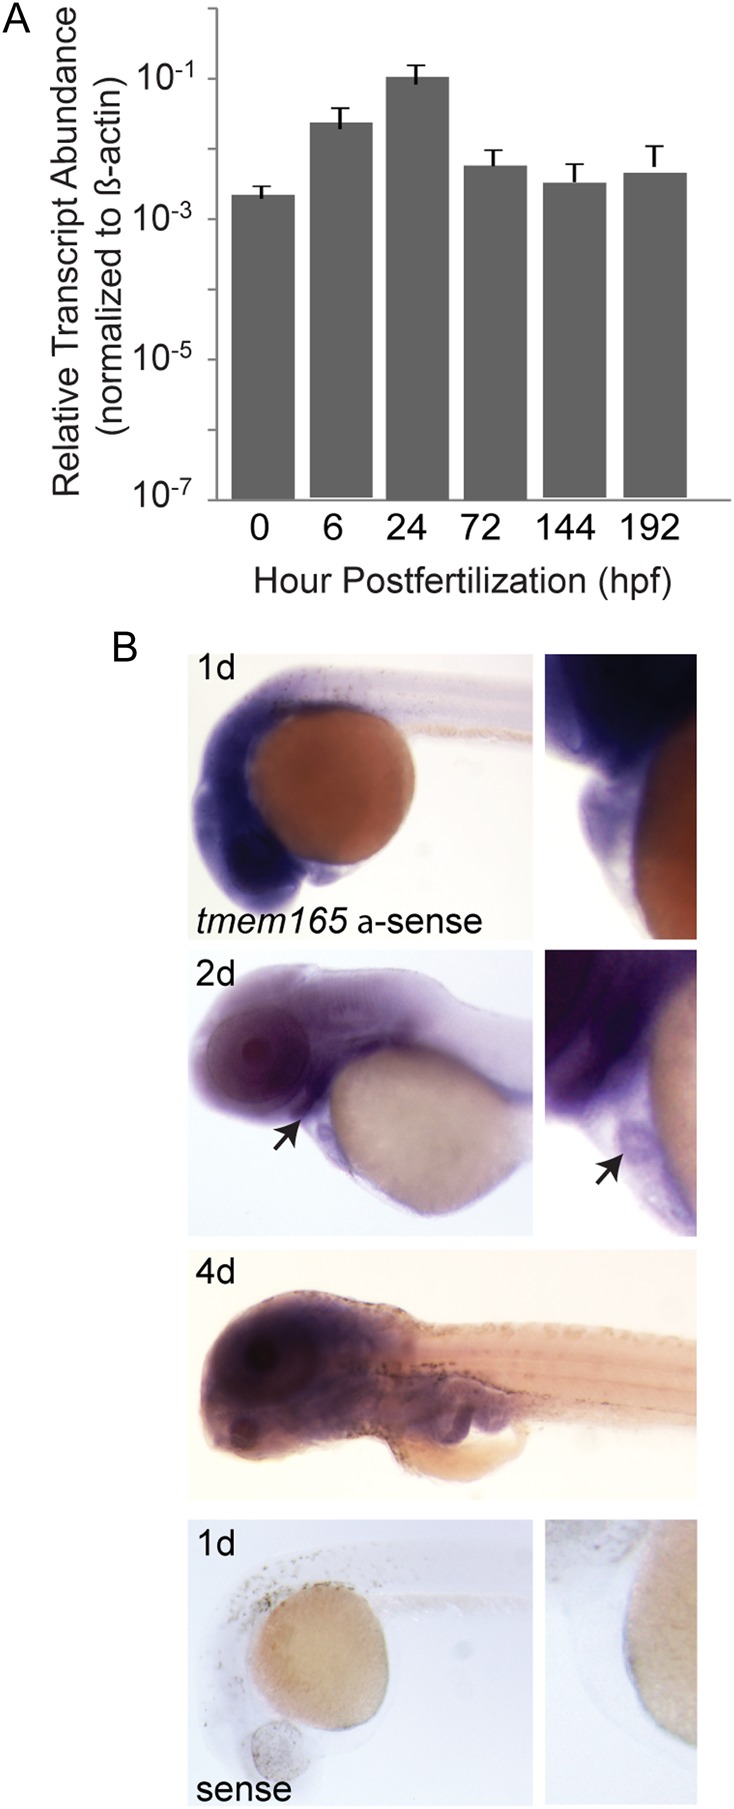
Wild-type expression of tmem165 in zebrafish. (A) Comparison of relative transcript abundance of zebrafish tmem165 from different developmental stages is shown. Data were normalized to the control gene β (β)-actin, and plotted on a log10 scale. 10−7 represents a CT value of 35, which serves as baseline expression. Error bars represent the standard error of the mean (S.E.M.) for three independent biological samples. (B) ISH in early zebrafish development was performed at the indicated stages for wild-type tmem165. tmem165 is expressed throughout the head of 1-d-old embryos, with expression becoming progressively restricted to ventral structures behind the eye by 2 d (see arrow, left panel). Magnified views of each time-point (right panel) demonstrate its presence in the developing heart as well. Similarly, at 2 d, tmem165 appears to become more highly localized to the midline between the two chambers (see arrow, right panel). At 4 dpf, strong staining is maintained in the head. No background staining was detected with the sense probe at 1 d. This figure is available in black and white in print and in colour at Glycobiology online.
Morpholino knockdown of tmem165 leads to craniofacial defects
In order to inhibit expression of tmem165, two different antisense morpholinos (MO) were designed. These included a translation blocking (TB) MO positioned in the 5′UTR and a splice blocking (SB) MO targeting the 5′ splice junction of intron 4 (Figure 3A). The optimal dose for maximal tmem165 inhibition was determined over a range of MO concentrations (0–0.5 µM). For the SB MO, RT–PCR analyses showed that 1.5 ng (0.18 µM) of MO yielded the maximal decrease in WT tmem165 transcript (Figure 3B). In addition to inhibiting production of WT transcript, the SB MO generated two aberrantly spliced messages of lower molecular weight. Sequence analyses of these products demonstrated that they correspond to either partial or complete excision of exon 4, or excision of exons 3 and 4 (Figure 3C). For each of these excision events, the resulting splice product retained an appropriate reading frame. In the absence of a molecular measure of knockdown for the TB MO, we chose the MO dose (0.12 µM) that not only consistently yielded phenotypes similar to those achieved with the SB MO but that was also rescued by co-injection of tmem165 mRNA.
Fig. 3.

Injection of tmem165 directed antisense morpholinos into zebrafish embryos reduces transcript abundance resulting in multiple gross phenotypes. (A) Schematic representation of tmem165 gene. The positions of TB and SB MOs are indicated. Arrows indicate the position of primers used to assess transcript abundance (see the Materials and Methods section). (B) RT–PCR of 4 dpf embryos after injection of indicated concentrations of SB MO. (C) Schematic representation of the altered products that result following injection of the SB MO. (D) Injection of either 1.5 ng of the SB MO or 1 ng of the TB MO resulted in shorter embryos with small misshapen heads. TB morphants are shown. Arrowheads indicated abnormalities in the ventral jaw structures of tmem165 morphants. Co-injection of tmem165 mRNA rescued these phenotypes. (E) Body length measurements of 4 dpf embryos after injection of TB MO indicate a reduction in size that was rescued by co-injection of wild-type mRNA. n = 3 experiments each containing 25 embryos. *P < 0.05, **P < 0.01 and ***P < 0.001 (Student's t test). Error bars represent the S.E.M. of three independent biological samples. This figure is available in black and white in print and in colour at Glycobiology online.
With either morpholino embryos appeared overtly normal for the first 2 d of development. However, by 3 dpf, tmem165 morphants were shorter than their WT clutch mates and had obviously truncated jaws (Figure 3D, arrowheads). Co-injection of tmem165 mRNA rescued these phenotypes in 94% of the embryos assayed, suggesting that they were specific to Tmem165 reduction and not caused by off-target MO effects (Figure 3Dand E). Injection of an equivalent amount of tmem165 mRNA alone yielded embryos that were indistinguishable from uninjected controls. Importantly, no differences were detected between control and morphant embryos following acridine orange staining for apoptosis. In conjunction with the fact that simultaneous suppression of tmem165 and p53 did not alleviate the phenotypes, these data suggest that they do not result from nonspecific apoptosis (data not shown). This is an important consideration as several studies have indicated that one common off-target effect of morpholinos is p53-directed apoptosis (Robu et al. 2007). Because it is difficult to predict whether the alternatively spliced products generated by the SB MO yield functional proteins and because the TB MO consistently yielded more robust phenotypes, the TB MO was used to generate the data presented in the remainder of this study.
Tmem165 morphants exhibit alterations in craniofacial cartilage development
In light of the facts that TMEM165-CDG patients exhibit skeletal malformations and tmem165 morphant jaws were abnormal, 4 dpf morphant craniofacial cartilages were visualized with Alcian Blue, a basic dye that readily binds acidic components of the extracellular matrix. These analyses revealed defects in several morphant structures, including Meckel's cartilage and the ceratohyal and palatoquadrate. In 87% of the animals analyzed, Meckel's cartilage was misshapen and slightly retracted, while the ceratohyal cartilages were inversely positioned relative to each other (Figure 4A). This was particularly evident in lateral images of stained embryos (Figure 4A, lower panels). Measurements of individual elements demonstrated that morphant cartilages were on average 30% shorter than control cartilages (Figure 4B) and that, while the average angle of articulation between the control ceratohyal structures was 79°, morphant ceratohyals articulated to form an average angle of 166°. In addition to the noted structural defects, 71% of the affected tmem165 morphants exhibited a reduction in the intensity of Alcian Blue staining, suggesting changes in the expression of chondroitin sulfate proteoglycans. The loss of staining was particularly prominent in both the Meckel's and ceratohyal cartilages. In 52% of the embryos analyzed, co-injection of tmem165 mRNA significantly improved the size, shape and staining profile of morphant cartilages. Injection of an equivalent concentration of tmem165 mRNA alone did not affect any of these parameters.
Fig. 4.
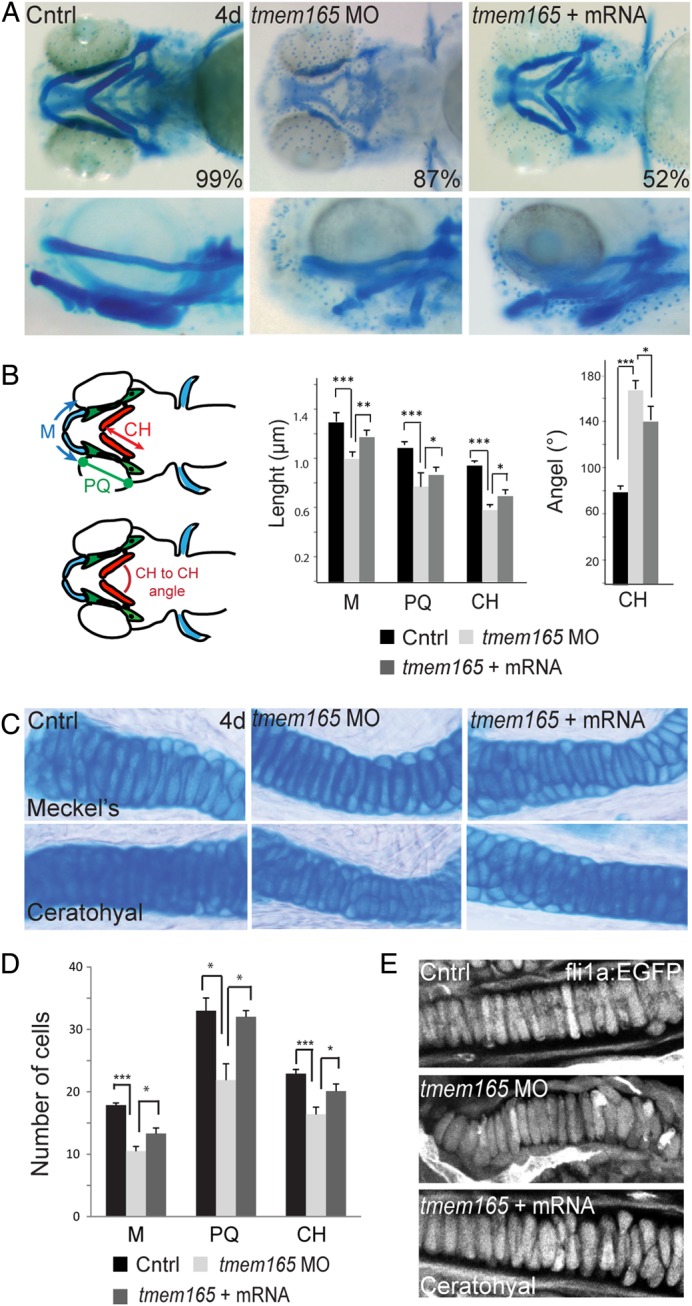
Inhibition of tmem165 expression in zebrafish embryos results in defects in cartilage morphogenesis. (A) Ventral (top panels) and lateral (bottom panels) views of 4 dpf control and tmem165 morphant embryos stained with Alcian Blue revealed altered size and shape of Meckel's cartilage, as well as the palatoquadrate and ceratohyal cartilages. These defects were rescued by co-injection of tmem165 mRNA. Stains were performed on four independent experiments each containing 35 embryos. (B) The length of individual structures was measured, as diagramed (M), (CH) and (PQ) on the fish schematics to the left of the graphs. n = 35 embryos per condition over four experiments. *P < 0.05, **P < 0.01 and ***P < 0.001 (Student's t test). Error bars represent the S.E.M. from four independent biological samples. (C) Alcian Blue-stained embryos were dissected and cartilage structures mounted flat. No significant differences were detected in the morphology of control and morphant chondrocytes. (D) The number of cells within individual structures was scored in flat mounted preparations. Morphant cartilages (including Meckel's, the palatoquadrate and the ceratohyal) all contained fewer cells than control structures. Co-injection tmem165 mRNA restored normal cell numbers within these structures. (E) Using the transgenic line fli1a:EGFP, which labels craniofacial chondrocytes, also showed normal cell morphology in tmem165 morphants. In particular, morphant chondrocytes were normally shaped and fully intercalated. Again, the total number of chondrocytes was reduced. n = 12–15 embryos per condition in three independent experiments. Error bars represent the S.E.M. from three independent biological samples. M, Meckel's cartilage; CH, ceratohyal; PQ, palatoquadrate. This figure is available in black and white in print and in colour at Glycobiology online.
To address whether the cartilage defects were also associated with differences in either cellular morphology or organization, Alcian Blue-stained control and morphant embryos were dissected and flat-mount preparations of cartilage analyzed. Although flat-mounted structures showed no significant differences in chondrocyte morphology, they did reveal that morphant cartilages contain up to 41% fewer cells than control cartilages (Figure 4C and D). This was true for Meckel's, the palatoquadrate and the ceratohyal structures. These findings were independently confirmed in control and morphant embryos generated in the fli1a:EGFP transgenic background (Lawson and Weinstein 2002). The fli1a promoter drives EGFP expression in neural crest-derived craniofacial chondrocytes. Confocal analyses of these animals showed that both control and morphant chondrocytes were fully intercalated and similarly organized (Figure 4E). Again, while co-injection of tmem165 mRNA significantly improved the number of cells within morphant cartilages, injection of mRNA alone had no effect.
Inhibition of tmem165 alters chondrocyte differentiation
To determine whether the cartilage dysmorphias reflected a defect in chondrocyte maturation, ISH was used to assess the expression of several key markers of differentiation. One of the earliest markers of chondrocyte differentiation, type II collagen (col2a1a), was increased in multiple tmem165 morphant cartilages at 3 dpf (Figure 5A). In all structures, except the ceratohyal (see arrows), this predominantly normalized by 4 dpf. Importantly, immunohistochemical stains of type II collagen protein expression were also indistinguishable by 4 dpf (data not shown). In contrast, expression of the intermediate stage marker, aggrecan (acana), was significantly reduced in 3 dpf morphant cartilages. While very little aggrecan was initially detected in either the ceratohyal or Meckel's cartilages, low-level expression was apparent by 4 dpf, suggesting that inhibition of tmem165 may delay certain early chondrogenic processes (Figure 5B). This phenotype was noted in 100% of the embryos analyzed. Importantly, longer experimental developing times did show aggrecan expression in both control and morphant embryos at 4 dpf. However, to best illustrate the differences in their levels—development times were shortened for the embryos presented. These data are consistent with the fact that tmem165 morphants often stained less intensely than control embryos with Alcian Blue dye. Since significant chondrocyte proliferation is thought to overlap with the expression of aggrecan, the reduced number of cells present in Tmem165-deficient cartilages may be associated with its decreased expression (Domowicz et al. 2009).
Fig. 5.

In situ analyses of multiple markers of chondrocyte differentiation reveal an altered maturation profile in tmem165 morphants. (A) Analyses of type II collagen expression (col2a1a) by ISH revealed a slight increase in tmem165 morphant embryos that was normalized by 4 dpf. This is evident in ventral (left panels) and lateral (right panels) views. Arrows denote the ceratohyal structure (CH). (B) Analyses of aggrecan (acana) expression showed a significant decrease in expression at both 3 and 4 dpf. (C and D) Immunohistochemical stains for chondroitin sulfate in sections of 4 dpf fli1a:EGPF embryos revealed significant loss of staining in both the ceratohyal (C) and Meckel's (D) cartilages of morphant embryos compared with control. Chondroitin sulfate staining was largely restored by co-injection with tmem165 mRNA. (E) sox9a expression is increased in morphants at 3 and 4 dpf. Arrows denote the ceratohyal structure (CH). n = 15–20 embryos per condition in three independent experiments. This figure is available in black and white in print and in colour at Glycobiology online.
Alterations in chondroitin sulfate proteoglycan expression (CSPG) were further demonstrated by immunohistochemical stains of cartilage sections from fli1a:EGFP control and morphant embryos (Figure 5C and D). Sections of 4 dpf embryos showed prominent reduction in CSPG staining of the Meckel's and ceratohyal cartilages. Co-injection with tmem165 mRNA restored a normal staining pattern to these elements. Importantly, because the antibody used (CS-56) to track CSPG expression reportedly recognizes long chain length glycosaminoglycans (GAG) of A, C and D-type CSPGs, which differ in their sulfation patterns, the reduced staining noted in tmem165 morphants may be indicative of changes in either core protein expression or GAG chain composition. As such, although in situ analyses and Alcian Blue intensity show reduced CSPG expression, the complete lack of immunohistochemical staining in both Meckel's and the ceratohyal may indicate that tmem165 inhibition affects discrete aspects of GAG synthesis.
Reduced expression of these extracellular matrix proteins was matched by an increase in the expression of the transcription factor Sox9 (Figure 5E). This was particularly evident in the regions corresponding to both Meckel's cartilage and the ceratohyal (see black arrows). Because the noted increase in sox9a expression was sustained at both the 3 and 4 dpf time-points, it is unlikely to be caused by delayed development. Sox9 activity is required for multiple aspects of chondrocyte differentiation, including the expression of type II collagen. However, its presence at later stages of chondrogenesis inhibits progression through the maturation program (Olsen et al. 2000). Collectively, these data suggest that the abnormal morphology noted in tmem165 morphant structures may be linked to disruptions in the chondrogenic maturation program (summarized in Figure 6E).
Fig. 6.

Osteoblast differentiation and behavior is altered in tmem165 morphants. (A) The atypical cartilage and bone marker, type X collagen (col10a1) was significantly reduced in tmem165 morphants. This was evident throughout the heads of animals 3 and 4 dpf. Arrows denote the parsphenoid (ps), the opercle (op), the maxilla (mx) and the dentary (de). (B) In situ analysis of osterix (osx) gene expression in 3 and 4 dpf control and tmem165 morphant embryos revealed a decrease expression throughout the head. This was apparent in both anterior and posterior structures (see boxed regions). Panels to the right represent magnified views of boxed areas. Analyses were performed on three independent experiments each containing 25 embryos. (C) Loss of col10a1 and osx expression was associated with reduced mineralization, as assessed by Alizarin red staining of live embryos 4 dpf. This was most evident around the maxilla, the entopterygoid and the brachiostegal ray in tmem165 morphants. Mineralization of these structures was improved following co-injection of tmem165 mRNA. (D) WT and tmem165 morphants in the sox10:mRFP (chondrocytes); osx:EGFP transgenic line show loss of osx expression is not due to loss of osteoblasts. (E) Schematic of chondrocyte and osteoblast development indicating major matrices markers. Large arrows indicate alterations in tmem165 profile. This figure is available in black and white in print and in colour at Glycobiology online.
Tmem165 morphants exhibit reduced osteoblast differentiation
Having established abnormal chondrogenesis in the morphant embryos, we next determined the effect of Tmem165 deficiency on bone development. In situ analyses of the atypical cartilage and bone marker, type X collagen (col10a1), showed a significant decrease in expression at 3 dpf, which unlike type II collagen did not recover by the 4 dpf time-point (Figure 6A). Although in mammalian systems, type X collagen is typically expressed in hypertrophic chondrocytes, in zebrafish, it is prominent in both osteoblasts and chondrocytes. At 3 and 4 dpf, col10a1 expression primarily marks osteoblasts. While strong col10a1 expression was present in control embryos at these time-points, it was undetectable in the majority of morphant structures. These included the dermal parasphenoid and the opercle bones (see arrows), which develop by intramembranous rather than endochondral ossification. In contrast to these structures, expression of col10a1 was unaffected in the cleithrum, another dermal bone, of tmem165 morphants. Further, at 4 dpf, while col10a1 expression was also now apparent in control maxilla and dentary bones, it was undetectable in the corresponding morphant structures. This was matched by minimal improvement in its posterior expression.
Like col10a1, expression of the osteoblast maturation factor osterix (osx) was also visibly reduced in multiple morphant structures at both time-points (see boxed areas Figure 6B). Importantly, the losses of expression noted at 3 dpf did not recover by 4 dpf, suggesting this is not simply the result of a slight delay in development. Alizarin red staining for mineralized matrix further demonstrated that reduced osx expression was accompanied by a decrease in calcium deposition (Figure 6C). This phenotype was significantly improved by co-injection of tmem165 mRNA. To ask whether the reduction in bone formation was due to a loss of osteoblasts, the tmem165 MO was introduced into the osx:EGFP transgenic line, in which osteoblasts are labeled with EGFP (DeLaurier et al. 2010) (Figure 6D). In both cases, confocal analyses of live 4-d-old control and morphant embryos showed EGFP-positive staining adjacent to sox10:mRFP-labeled Meckel's cartilages. Therefore, reduced col10a1 and osx expression was not due to a complete loss of osteoblasts. These data demonstrate that tmem165 deficiency inhibits normal bone formation, possibly by disrupting normal maturation and behavior of osteoblasts cells (summarized in Figure 6E).
Tmem165 mRNA containing a patient mutation does not rescue altered cartilage morphology of morphant embryos
Several missense mutations in the human TMEM165 protein, including R126H, have been shown to impair protein function by altering its subcellular localization (Demaegd et al. 2013). Importantly, the R126H mutation occurs in an amino acid that is conserved within the zebrafish protein. Therefore, in an effort to link this mutation with the aberrant chondrogenesis described in our zebrafish model, we performed rescue experiments using mRNA bearing the corresponding zebrafish mutation (R106H). For these experiments, two consecutive nucleotide changes, which result in the replacement of Arg with His, were introduced into the zebrafish codon for amino acid 106. Embryos were then co-injected with 1.5 ng of the tmem165 MO and 300 pg of either wild-type or R106H mutant tmem165 mRNA. The resulting embryos were stained with Alcian Blue and the degree of phenotypic rescue assessed. Parameters used to assess rescue included (i) whether Meckel's cartilage protruded beyond the eyes, (ii) whether the inversion of morphant ceratohyal structures was reversed and (iii) whether positive staining was present in posterior structures (including the ceratobranchials) (Figure 7A). Embryos were considered “normal” if all three conditions were met. Using this guideline, 51% of the morphant embryos co-injected with wild-type mRNA appeared phenotypically normal. In contrast, only 3% of the embryos co-injected with R106H mutant mRNA appeared normal (Figure 7B, see Table I for more detailed analyses). Failure of the R106H mutant mRNA to rescue these cartilage defects suggests that, like in human patients, this mutation is pathogenic in zebrafish. These data further support the use of this model to study both the normal and pathogenic aspects of tmem165 function.
Fig. 7.
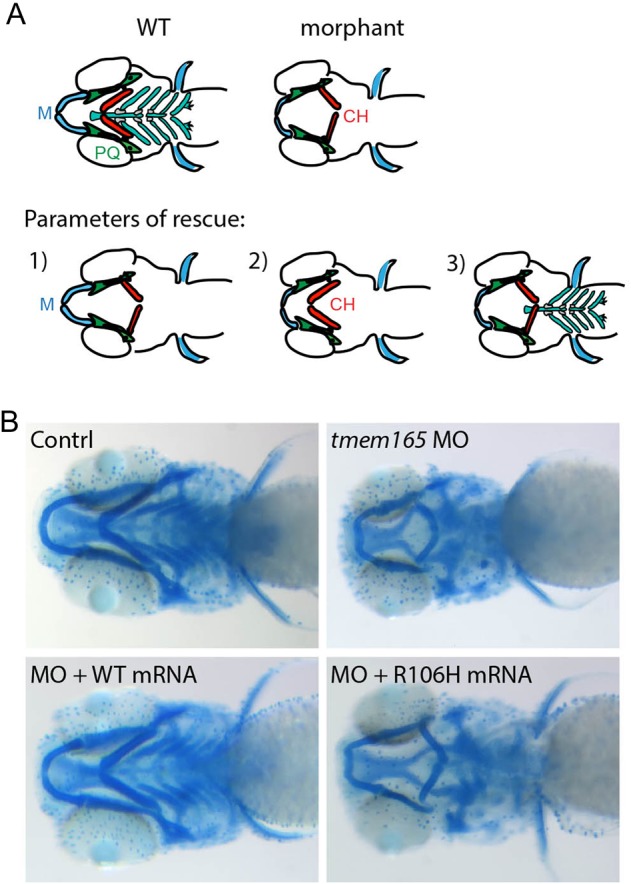
Co-injection of mRNA containing the R106H patient mutation does not rescue morphant craniofacial phenotypes. (A) Schematic of WT and morphant cartilages with key structural changes illustrated. As described in the Results section, the three parameters used to assess phenotypic rescue are denoted. Embryos meeting all three criteria were considered fully rescued. (B) Alcian Blue stains of WT, morphant, morphant + WT mRNA and morphant plus mRNA containing the R106H mutation reveal that while co-injection with WT tmem165 mRNA rescues morphant phenotypes on 55% of the embryos scored, R106H mRNA only rescued 2.5% of the morphants. As denoted 97.5% of the animals look similar to the one depicted. n = 100–125 embryos per condition from three independent experiments. M, Meckel's cartilage; CH, ceratohyal; PQ, palatoquadrate. This figure is available in black and white in print and in colour at Glycobiology online.
Table I.
Analyses of tmem165 morphant rescue.
| 1) Meckels past eyes (%) | 2) CH to CH angle acute (%) | 3) Positive posterior staining (%) | 3 parameters normal (%) | 2 parameters normal (%) | 1 parameter normal (%) | |
|---|---|---|---|---|---|---|
| WT (n = 32) | 100 | 100 | 100 | 100 | NA | NA |
| tmem165 (n = 71) | 3 | 4 | 6 | 3 | 4 | 1 |
| tmem165 + WT (n = 40) | 65 | 54 | 68 | 51 | 16 | 0 |
| tmem165 + R106H (n = 30) | 33 | 3 | 3 | 3 | 3 | 30 |
Tmem165 deficiency in zebrafish results in N-glycosylation defects
Consistent with a role for TMEM165 in maintaining the normal glycosylation potential of the Golgi, previous glycomic studies on both TMEM165-CDG patient serum and HEK cells transfected with siRNA-targeting TMEM165 revealed defects in glycosylation (Foulquier et al. 2012). Originally, only N-glycosylation was thought to be impaired, but isoelectric focusing and LC MS/MS analyses of serum glycoproteins from TMEM165-CDG patients have shown that O-glycosylation can also be affected (Xia et al. 2013; Zeevaert et al. 2013). To further establish zebrafish as a suitable model for TMEM165-CDG, the glycomic impact of tmem165 knockdown was investigated in 4 dpf embryos by mass spectrometry (Figure 8). Two sets of wild-type, tmem165 morphant, and mRNA rescued samples were analyzed, one consisting of ∼400 whole embryos of each type (Figure 8A) and the other consisting of ∼400 manually de-yolked embryos of each type (Figure 8B). The set of predominant N-linked glycans in both samples included high-mannose type (Structures 2–6, Figure 8) and a single core-fucosylated, hybrid glycan with a sialylated, fully extended arm (Structure 10, Figure 8). Although this hybrid glycan and the minimally processed high-mannose glycans (Structures 2–3) were not affected, more extensively trimmed high-mannose glycans (Structures 4–6) exhibited consistent decreases in the tmem165 morphants, whether analyzed with or without yolk. The morphants in both sample sets also exhibited altered abundance of other hybrid glycans. The most truncated hybrid glycan (Structure 9) was decreased in both morphant samples, while a Gal-extended and a sialylated hybrid glycan without core Fuc (Structures 7 and 8) were increased in the intact or de-yolked samples, respectively. Reductions in a broad range of complex glycans, with and without core Fuc, were observed in the embryos with yolk, but these reductions were blunted in the de-yolked morphant samples. Co-injection of wild-type mRNA along with the tmem165 morpholino successfully rescued a subset of glycans to their normal levels (see Structures 4–6 in whole embryo samples and Structures 7 and 9 in de-yolked embryos, for instance). However, co-injection of wild-type mRNA generally resulted in a significant increase in the abundance of the N-linked glycans detected in both sample sets. Total glycan was slightly decreased in morphants but increased in mRNA rescued samples, whether assayed with or without yolk (with yolk: 203, 172, 255 pmol glycan/mg protein for wild-type, morphant and mRNA, respectively; de-yolked, 153, 132, 229 pmol glycan/mg protein for wild-type, morphant and mRNA, respectively). The decrease in total glycoprotein glycan in the tmem165 morphant indicates defective initiation of glycosylation, a function localized to the endoplasmic reticulum. However, detected deficits in trimming and elongation indicate that reduced Tmem165 function is pleotropic, affecting downstream Golgi-localized processing steps as well. Significant changes in the abundance of the major O-linked glycans of intact morphant and wild-type embryos were not detected (data not shown).
Fig. 8.

The N-linked glycome of tmem165 morphant embryos is reduced in complexity. N-linked glycans were released from whole embryo glycoproteins by PNGaseF, permethylated and analyzed by NSI-MS and MSn. (A) Glycans released from intact embryos with yolk attached. (B) Glycans released from de-yolked embryos. Morphant embryos with or without yolk (red bars) exhibited decreased abundance of processed high Mannose glycans, but increased abundance of a subset of hybrid glycans in comparison to wild-type (black bars). Changes in abundance were rescued to wild-type levels or to in excess of wild-type levels by co-injection of wild-type mRNA (gray bars). Glycan numbers are arbitrarily assigned for ease of discussion and graphic representations of glycan structures are consistent with standard nomenclature (Glc, blue circle; GlcNAc, blue square; Man, green circle; Gal, yellow circle; GalNAc, yellow square; Fuc, red triangle; NeuAc, pink diamond; NeuGc, blue diamond). This figure is available in black and white in print and in colour at Glycobiology online.
Discussion
The CDGs, which represent a heterogeneous group of inherited diseases characterized by defective N-glycosylation, currently comprise a family of 50 different subtypes (Jaeken and Matthijs 2007; Foulquier 2009; Jaeken et al. 2009; Schachter and Freeze 2009). This number continues to grow rapidly. Recently, a novel type II CDG was identified that results from mutations in the transmembrane protein TMEM165. Like many CDGs, our understanding of the pathogenetic mechanisms that underlie the clinical manifestations of these disorders remains poorly understood. The present work reports our study of the developmental impact of tmem165 deficiency in zebrafish, which establishes the first animal model for this new CDG subtype. Our analyses of tmem165 morphant embryos demonstrate that tmem165 deficiency in zebrafish results in altered N-linked glycosylation and cartilage defects. Importantly, both the morphological and biochemical phenotypes noted in the zebrafish model mirror those seen in human patients. The implication of our findings in the context of TMEM165's function in bone and cartilage, and the potential relationship between altered glycosylation and the developmental defects, is discussed.
Patients with TMEM165-CDG, caused by the c.792+182G>A mutation, presented with a psychomotor-dysmorphism syndrome comprising postnatal growth deficiency and major spondylo-, epi- and metaphyseal skeletal involvement. Craniofacial abnormalities included midface hypoplasia, large and low-set ears, and high arched palate (Zeevaert et al. 2013). Clearly, the virtual knock-out caused by this deep intronic splice mutation leads to a severe skeletal phenotype. Consistent with these clinical features, Alcian Blue stains of tmem165-deficient zebrafish revealed multiple abnormalities in the morphology of pharyngeal cartilages, including Meckel's cartilage and the palatoquadrate and ceratohyals. Co-injection of the tmem165 MO and in vitro transcribed tmem165 mRNA significantly improved several aspects of these phenotypes, confirming that they were the specific result of Tmem165 reduction and not due to off-target MO effects. High-resolution analyses of multiple affected structures showed that while morphant chondrocytes were morphologically similar to control chondrocytes, morphant cartilages contained up to 41% fewer cells than control cartilages. The fact that the morphant cells were both normally shaped and appropriately organized suggest that the morphological defects were not due to alterations in the early phases of chondrocyte maturation, but rather stemmed from defects in later stages, including the growth of individual structures via local chondrocyte proliferation. This is supported by the fact that type II collagen, one of the earliest markers of cartilage differentiation, is expressed at similar levels in morphant and control cells. In contrast, the expression of the intermediate stage marker, aggrecan, was substantially reduced in morphant cartilages compared with control cartilages. The reduction in the expression of the major cartilage proteoglycan (aggrecan) is a compelling finding, particularly since the window of its expression in other systems has been shown to both overlap with and be required for chondrocyte proliferation. Further, mice and chicks devoid of aggrecan exhibit dwarfism characterized by a reduced number of cells (Rittenhouse et al. 1978; Kimata et al. 1981; Domowicz et al. 2009).
In addition to striking defects in cartilage morphology and maturation, several anomalies were also noted in the development of Tmem165-deficient osteoblasts. Unlike wild-type osteoblasts, which expressed high levels of the osteoblast differentiation markers col10a1 and osx, both markers were drastically reduced in morphant osteoblasts suggesting a defect in cellular maturation. These developmental phenotypes were also associated with a significant reduction in mineralization, as assessed by Alizarin red stains. These findings are compelling, as radiological examinations of three described TMEM165-CDG patients revealed regions of irregular bone shape and low bone density. Patients were therefore designated as having either generalized osteopenia or generalized osteoporosis (Zeevaert et al. 2013). It is currently unclear whether these phenotypes result from the loss of tmem165 expression in developing osteoblasts themselves or whether abnormal osteoblast development is a secondary consequence of disrupted chondrocyte development. Regardless, the fact that loss of TMEM165/tmem165 expression affects aspects of bone development and mineralization in both human patients and zebrafish morphants suggests that the physiologic functions of TMEM165/Tmem165 are highly conserved. These findings further reinforce the validity of this zebrafish model to study the cellular and molecular pathogenesis of TMEM165-CDG.
TMEM165-deficient zebrafish embryos exhibited altered N-linked glycan abundance characterized by decreased total glycoprotein glycosylation, shifts in the relative abundances of high-mannose and hybrid type glycans as well as variable changes in complex glycan elaboration. While these results are in partial agreement with the decreased glycan complexity reported in previous glycomic analyses of TMEM165-CDG patient serum glycoproteins, some features are different (Foulquier et al. 2012; Xia et al. 2013). In particular, altered high-mannose glycan abundance is expected to be more clearly detectable in the analysis of whole embryos rather than of serum glycoproteins, which are primarily the highly processed secretory products of just a few cell types (hepatocytes and endothelial cells). Furthermore, the most abundant complex N-linked glycan structures found in the zebrafish embryo are not the same as those found in human serum. Therefore, the impact of TMEM165 deficiency on the abundance of any particular glycan structure is not as diagnostic as its effect on the activity of glycan processing pathways in evaluating the glycomic relevance of the zebrafish model for the human CDG. Taken together, the shift in the distribution of high-mannose glycans, the increased abundance of hybrid structures and the decreased abundance of complex glycans (although only of partial penetrance), all suggest that TMEM165 depletion affects glycan processing at multiple steps throughout the secretory pathway and points to a conserved function for this protein in maintaining the glycosylation potential along the secretory pathway. Since tmem165 is suggested to play a role in pH and calcium homeostasis, its deficiency could alter glycosylation efficiency by changing the pH within the Golgi. Studies on the V-ATPase complex have shown that vesicular budding and fusion events are both pH and VTPase dependent [reviewed in Guillard et al. (Guillard et al. 2009)]. Further, changes in intracellular calcium levels have been shown to regulate enzymes involved in sialylation (Bruses and Rutishauser 1998). Therefore, it is possible that tmem165 deficiency also impacts Golgi trafficking steps, indirectly affecting glycosylation in a manner similar to the loss of COG complex subunits; in COG-CDG enzyme, mislocalization has been attributed to alterations in retrograde vesicular transport (Wu et al. 2004; Steet and Kornfeld 2006). Despite the differences in the relative abundance of N-glycan structures following tmem165 reduction, it is not currently known whether the chondrogenic phenotypes described directly stem from these glycosylation defects. In particular, the mechanism by which tmem165 deficiency reduces aggrecan expression remains undefined.
In addition to providing a platform to test these important open questions, the development of a zebrafish model to study TMEM165-CDG provides an opportunity to determine whether specific patient mutations are pathogenic in this organism. Unlike wild-type tmem165 mRNA, mRNA bearing the R106H mutation was unable to correct morphant craniofacial phenotypes, indicating that this conserved residue is essential to the physiological function of this protein. These data further support the utility of this new CDG model in elucidating the physiologic and pathogenic function of Tmem165. Further, as the number of identified CDG-TMEM165 patients increase, this model will prove valuable both in assessing the impact of these mutations toward developmental phenotypes, and to dissect the functional significance of other domains or residues within the TMEM165 protein. Such future studies may provide valuable insight into TMEM165's putative role in trafficking and ion transport.
Materials and methods
Fish strains and maintenance
Wild-type zebrafish were obtained from Fish 2 U (Gibsonton, FL) and maintained according to standard protocols. Tg(fli1a:EGFP)y1 (Lawson and Weinstein 2002) and osx:EGFP (DeLaurier et al. 2010) transgenic lines were acquired from ZIRC (Eugene, OR). Embryos were staged according to the criteria established by Kimmel et al. (Kimmel et al. 1995). In some cases, 0.003% 1-phenyl 2-thiourea (PTU) was added to the embryo medium to block pigmentation. All MO-generated phenotypes were tested in multiple backgrounds, including F2U, AB and Tg(fli1a:EGFP). Handling and euthanasia of fish for all experiments were in compliance with the KU Leuven institutional ethical committee and University of Georgia policies. The animal use protocol was approved by the UGA Institutional Animal Care Committee (permit#A2013-8-144).
Antisense morpholinos and mRNA rescue
The expression of tmem165 was inhibited by injection of either 2 nL of a 90 µM solution (1.5 ng, final concentration 0.18 µM) of a splice blocking (SB) MO (5′-GAGAGGTAGAGGAGCGATTTATTTT-3′) or by injection of 2 nL of a 60 µM (1.0 ng; final concentration 0.12 µM) solution of a translation blocking (TB) MO (5′-ATCGGTCTCTCAGCGATGATGACCA-3′) (Gene Tools, Eugene, OR). For the SB morpholino, the optimal concentration was determined following RT–PCR analysis of tmem165 transcript using primers in exons 3 and 5 (5′-AAGAGGAGCTGGAGGAGGTC-3′ and 5′-GATAAAGAGGGCGGAGAAGG-3′). For both the SB and TB morpholinos, the optimal concentration was confirmed by assessing whether tmem165 mRNA rescued the phenotypes. Rescue experiments were performed by sequential injection of either the SB or TB MO, neither of which recognize the in vitro transcribed tmem165 mRNA, and 300 pg of either wild-type or mutant tmem165 mRNA. To facilitate these analyses, the coding region of tmem165 was PCR-amplified from an ImaGene clone containing the full-length sequence (ImaGenes, accession # IRBOp991C0775D). This product was subcloned into the pCS2+ vector via 5′ EcoRI and 3′XhoI restriction sites introduced into the primers. Plasmid was linearized with NotI and mature capped mRNA generated with the SP6 Message Machine RNA synthesis kit (Ambion/Life technologies, Grand Island, NY). A mutant version of the tmem165 coding region containing the patient mutation (Arg126His) was generated via site-directed mutagenesis (QuikChange II Site-Directed Mutagenesis Kit, Stratagene) of the wild-type pCS2+-tmem165 construct. Generation of a His residue in the corresponding zebrafish Arg residue (amino acid 106) involved two consecutive nucleotide changes (317 G>A and 318 G>C). The following primer sets were used to create this mutation: 5′- GGCTATGCGCTACAATCACCTCACTGTTTTGGCGGG-3′ and 5′-CCCGCCAAAACAGTGAGGTGATTGTAGCGCATAGCC-3′
Real-time quantitative PCR
Total RNA was isolated from embryos of different developmental stages using the RNeasy Plus kit (Qiagen). First-strand cDNA synthesis was performed using the First-Strand cDNA Synthesis Kit (VWR international). PCRs were performed using 2× LightCycler® 480 SYBR Green I8 Master (Roche Applied Science). Serial dilutions were used to create standard curves for relative quantification, and the expression of the zebrafish tmem165 (GenBank NM_212683.2) transcript was normalized to β-actin (GenBank NM_131031.1) expression. qPCR reactions were run on three independent biological samples in triplicate. Primer pairs were designed using Primer 3 software. Sequences for primers used in this study are the following: tmem165 (5′-CCTTGGCATCGGTCTCTCAGCG-3′ and 5′-TGGCTAATACTGCCTCTGCGGT-3′) and B-actin (5′-CGAGCAGGAGATGGGAACC-3′ and 5′-CAACGGAAACGCTCATTGC-3′). Data were analyzed using the LightCycler® 480 Software (Roche Applied Science). The relative transcript abundance of tmem165 (normalized to B-actin) was quantitated for each of the three biological samples at each developmental stage using the comparative threshold 10-cycle method described by Livak and Schmittgen (Livak and Schmittgen 2001). Analysis of relative gene expression data using real-time quantitative PCR and the 2(−Delta Delta C(T)) method.
Sanger sequencing of SB MO products
Total RNA was isolated from tmem165 morphants and control embryos using the RNeasy Kit (Qiagen). RNA was then subjected to reverse transcription with the First-Strand cDNA synthesis Kit (GE Healthcare) following the manufacturer's instructions. Primers were designed to amplify the whole tmem165 gene (GenBank accession number NM_212683.2). RT–PCR product bands were extracted from the agarose following the manufacturer's instructions (QIAquick Gel Extraction Kit; Qiagen) and sequenced. For the sequencing of the resulting PCR product, the BigDye Terminator Ready reaction cycle sequencing kit v.3.1 (Applied Biosystems) was used. Analysis of the results was performed on an ABI3100 Avant (Applied Biosystems).
Whole-mount ISH
For whole-mount ISH, embryos were fixed overnight at 4°C in 4% paraformaldehyde (PFA) and subsequently dehydrated through a methanol series. ISH was performed as previously described (Thisse et al. 1993). Antisense probes for col2a1a, col10a1, and osx were generated as previously described (Clement et al. 2008; Li et al. 2009). Plasmids for these probes were kindly provided by Dr. Henry Roehl (University of Sheffield, UK). The sox9a probe was generated as previously described (Flanagan-Steet et al. 2009). For analyses of aggrecan (acana) expression, a unique portion of the coding region was isolated from 3-d-old embryos by RT–PCR. The 3′ primer contained a T3 polymerase site, which was used to generate a DIG-labeled RNA probe generate. To generate a tmem165 probe, an I.M.A.G.E. clone containing the full-length tmem165 mRNA (ImaGenes, accession # IRBOp991C0775D) was purchased; a 901 bp fragment containing the entire coding region was amplified by PCR. This fragment was cloned into the pGEM-T-Easy vector. The antisense tmem165 probe was generated with T3 polymerase from an EcoRI-linearized plasmid; the sense probe was made using SP6 polymerase on a NotI-linearized plasmid. Stained embryos were visualized on an Olympus SZ-16 dissecting scope outfitted with Q-capture software and a Retiga 2000R color camera.
Immunohistochemical analyses
For immunohistochemical analysis, wild-type and morphant fli1a:EGFP embryos were harvested and fixed overnight in 4% PFA at 4°C. For stained sections, embryos were processed through an ascending series of sucrose solutions (7, 15, 30%) and subsequently embedded and frozen in OCT freezing media (Tissue-Tek Corp.). Twenty-five micromolar sections were cut on a Leica 1850 cryostat and stained using a monoclonal mouse antihuman chondroitin sulfate antibody (1/100; clone CS-56, catalog # C8035; Sigma, Saint Louis, MO) or antihuman type II collagen antibody (II-II6BB3, 1/100; Developmental Studies Hybridoma Bank, Iowa City, IA). Fluorophore conjugated secondary antibodies, including an Alexa 647 goat-antimouse IgM (for detection of CS) and an Alexa 568 goat antimouse IgG (for detection of type II collagen), were used at 1/500 (Molecular Probes, Life technologies, Grand Island, NY). TO-PRO-3 647 (Molecular Probes, Grand Island, NY) was used to stain nuclei. In all cases, immunohistochemical stains were visualized using an Olympus FV-100 laser scanning confocal microscope using ideal image parameters as defined by a 40 × W (N.A. 1.15) objective. Processing parameters were as previously described (Flanagan-Steet et al. 2009).
Alcian Blue and Alizarin red staining
Craniofacial cartilage elements were stained with Alcian Blue staining as previously described (Javidan and Schilling 2004). Analysis of craniofacial structures was performed using the measurement parameters outlined in the Results section. To visualize mineralized matrix within craniofacial elements, embryos were stained live with Alizarin red as previously described (Kimmel et al. 2010). To visualize positive staining, animals were embedded in hanging drops of 0.8% low melting point agarose attached to glass coverslips. Coverslips were inverted in organ culture dishes containing embryo medium and positive staining detected using the 543 nm filter set on an Olympus FV-1000 laser scanning confocal microscope.
Acridine orange staining
To detect apoptosis, 24 hpf embryos were incubated in embryo medium containing 5 µg/mL of acridine orange (cat#016621622, Fluka Chemicals) for 30 min, rinsed in multiple changes of embryo medium and analyzed using the 488 filter set on an Olympus SZ-16 fluorescent dissecting scope.
Glycomic analysis
In order to assess the effect of Tmem165 reduction on N- and O-linked glycosylation, batches of ∼400 control or morphant embryos were harvested at 4 dpf. Yolks were manually removed from one batch and the embryos were frozen until processed. Glycoproteins were harvested from the frozen embryos as previously described (Aoki et al. 2007, 2008). Briefly, the frozen embryos were suspended in ice-cold water and disrupted by Dounce homogenization on ice. The homogenate was adjusted to 4:8:3::choloroform:methanol:water by sequential addition of methanol followed by homogenization and chloroform again followed by homogenization before removal from ice. After 18 h of end-over-end agitation (Nutator), the insoluble proteinacious material was collected by centrifugation. Following re-extraction of the pellet three times with 4:8:3 and once with ice-cold 80% acetone (v/v, aqueous), the final pellet was dried under a gentle stream of nitrogen and stored as a fine white powder. Protein content of the powder was determined by BCA assay (Pierce). N-linked glycans were harvested from the protein powder as previously described (Aoki et al. 2007). Generally, 2 mg of protein powder (dry weight) was resuspended and digested with trypsin/chymotrypsin. Glycopeptides were enriched by Sep-Pak C18 cartridge chromatography and subjected to digestion with PNGase F for 18 h at 37°C. Released oligosaccharides were separated from residual peptide by Sep-Pak C18 clean-up and permethylated prior to mass spectrometric analysis (Anumula and Dhume 1998). O-linked glycans were released from protein powder (generally 3 mg starting material) by reductive β-elimination and prepared for permethylation as previously described (Aoki et al. 2008). Permethylated N-linked and O-linked glycans were analyzed by nanospray ionization mass spectrometry using an ion trap instrument (NSI-LTQ Orbi Discoverer, Thermo-Fisher) by dissolving in 1 mM NaOH in 50% methanol and directly infusing into the instrument at a syringe flow rate of 0.40–0.60 µL/min. For fragmentation by CID in MS/MS and MSn modes, 40% collision energy was applied. The total ion mapping (TIM) functionality of the XCalibur software package (version 2.0) was utilized to detect and quantify the prevalence of individual glycans in the total glycan profile. This workflow generated 700 MS/MS spectra for each sample, which were then inspected manually for the presence and structural identity of glycans. Most permethylated glycans were identified as singly, doubly and triply charged species by NSI-MS. TIM peaks for all charge states of a given ion with m/z ≤2000 were summed together for quantification. Glycan quantification was performed relative to a known quantity of an external standard mix (maltotriose and maltotetraose, Supelco) that was permethylated with heavy methyliodide (13CH3I) and spiked into the sample matrix. Graphic representations of glycan structures are consistent with the standardized nomenclature proposed by Varki and Sharon (Varki and Sharon 2009).
Funding
This work was supported by an National Institute of Health R01 awarded to R.S. 1R01GM086524, the Research Foundation (FWO), Flanders (G.0553.08 and G.0505.12), and by grant ERARE11-135 of the ERA-Net for Research Programs on Rare Diseases, Joint Transnational Call 2011 (EURO-CDG). Additional support included the Belgian Science Policy Office Interuniversity Attraction Poles (BELSPO-IAP) program through the project IAP P7/43-BeMGI and a Concerted Research Action GOA/12/015 for the University of Leuven. R.B. was also supported by two FWO Travel Grants (V413113N and V419012N). The authors also gratefully acknowledge the support and access to instrumentation provided through grant P41GM103490 from the National Institute of General Medical Sciences, National Institutes of Health (M.T. and R.S., co-PIs).
Conflict of interest
None declared.
Abbreviations
β, beta; CDG, congenital defects of glycosylation; LLO, lipid-linked oligosaccharide precursor; MO, antisense morpholino; TB, translation blocking; SB, splice blocking; RT–PCR, reverse transcriptase–polymerase chain reaction; CSPG, chondroitin sulfate proteoglycan; EGFP, enhanced green fluorescent protein; GAG, glycosaminoglycan.
Acknowledgements
We would like to thank members of the Steet laboratory, in particular Jennifer Willis and Brian Kwan, for excellent fish husbandry and maintenance.
References
- Anumula KR, Dhume ST. 1998. High resolution and high sensitivity methods for oligosaccharide mapping and characterization by normal phase high performance liquid chromatography following derivatization with highly fluorescent anthranilic acid. Glycobiology. 8:685–694. [DOI] [PubMed] [Google Scholar]
- Aoki K, Perlman M, Lim JM, Cantu R, Wells L, Tiemeyer M. 2007. Dynamic developmental elaboration of N-linked glycan complexity in the Drosophila melanogaster embryo. J Biol Chem. 282:9127–9142. [DOI] [PubMed] [Google Scholar]
- Aoki K, Porterfield M, Lee SS, Dong B, Nguyen K, McGlamry KH, Tiemeyer M. 2008. The diversity of O-linked glycans expressed during Drosophila melanogaster development reflects stage- and tissue-specific requirements for cell signaling. J Biol Chem. 283:30385–30400. [DOI] [PMC free article] [PubMed] [Google Scholar]
- Bruses JL, Rutishauser U. 1998. Regulation of neural cell adhesion molecule polysialylation: evidence for nontranscriptional control and sensitivity to an intracellular pool of calcium. J Cell Biol. 140:1177–1186. [DOI] [PMC free article] [PubMed] [Google Scholar]
- Clement A, Wiweger M, von der Hardt S, Rusch MA, Selleck SB, Chien CB, Roehl HH. 2008. Regulation of zebrafish skeletogenesis by ext2/dackel and papst1/pinscher. PLoS Genet. 4:e1000136. [DOI] [PMC free article] [PubMed] [Google Scholar]
- DeLaurier A, Eames BF, Blanco-Sanchez B, Peng G, He X, Swartz ME, Ullmann B, Westerfield M, Kimmel CB. 2010. Zebrafish sp7:EGFP: a transgenic for studying otic vesicle formation, skeletogenesis, and bone regeneration. Genesis. 48:505–511. [DOI] [PMC free article] [PubMed] [Google Scholar]
- Demaegd D, Foulquier F, Colinet AS, Gremillon L, Legrand D, Mariot P, Peiter E, Van Schaftingen E, Matthijs G, Morsomme P. 2013. Newly characterized Golgi-localized family of proteins is involved in calcium and pH homeostasis in yeast and human cells. Proc Natl Acad Sci USA. 110:6859–6864. [DOI] [PMC free article] [PubMed] [Google Scholar]
- Domowicz MS, Cortes M, Henry JG, Schwartz NB. 2009. Aggrecan modulation of growth plate morphogenesis. Dev Biol. 329:242–257. [DOI] [PMC free article] [PubMed] [Google Scholar]
- Flanagan-Steet H, Sias C, Steet R. 2009. Altered chondrocyte differentiation and extracellular matrix homeostasis in a zebrafish model for mucolipidosis II. Am J Pathol. 175:2063–2075. [DOI] [PMC free article] [PubMed] [Google Scholar]
- Foulquier F. 2009. COG defects, birth and rise! Biochim Biophys Acta. 1792:896–902. [DOI] [PubMed] [Google Scholar]
- Foulquier F, Amyere M, Jaeken J, Zeevaert R, Schollen E, Race V, Bammens R, Morelle W, Rosnoblet C, Legrand D, et al. 2012. TMEM165 deficiency causes a congenital disorder of glycosylation. Am J Hum Genet. 91:15–26. [DOI] [PMC free article] [PubMed] [Google Scholar]
- Freeze HH. 2006. Genetic defects in the human glycome. Nat Rev Genet. 7:537–551. [DOI] [PubMed] [Google Scholar]
- Guillard M, Dimopoulou A, Fischer B, Morava E, Lefeber DJ, Kornak U, Wevers RA. 2009. Vacuolar H+-ATPase meets glycosylation in patients with cutis laxa. Biochim Biophys Acta. 1792:903–914. [DOI] [PubMed] [Google Scholar]
- Ivey DM, Guffanti AA, Zemsky J, Pinner E, Karpel R, Padan E, Schuldiner S, Krulwich TA. 1993. Cloning and characterization of a putative Ca2+/H+ antiporter gene from Escherichia coli upon functional complementation of Na+/H+ antiporter-deficient strains by the overexpressed gene. J Biol Chem. 268:11296–11303. [PubMed] [Google Scholar]
- Jaeken J, Hennet T, Matthijs G, Freeze HH. 2009. CDG nomenclature: time for a change! Biochim Biophys Acta. 1792:825–826. [DOI] [PMC free article] [PubMed] [Google Scholar]
- Jaeken J, Matthijs G. 2007. Congenital disorders of glycosylation: a rapidly expanding disease family. Annu Rev Genomics Hum Genet. 8:261–278. [DOI] [PubMed] [Google Scholar]
- Javidan Y, Schilling TF. 2004. Development of cartilage and bone. Methods Cell Biol. 76:415–436. [DOI] [PubMed] [Google Scholar]
- Kimata K, Barrach HJ, Brown KS, Pennypacker JP. 1981. Absence of proteoglycan core protein in cartilage from the cmd/cmd (cartilage matrix deficiency) mouse. J Biol Chem. 256:6961–6968. [PubMed] [Google Scholar]
- Kimmel CB, Ballard WW, Kimmel SR, Ullmann B, Schilling TF. 1995. Stages of embryonic development of the zebrafish. Dev Dyn. 203:253–310. [DOI] [PubMed] [Google Scholar]
- Kimmel CB, DeLaurier A, Ullmann B, Dowd J, McFadden M. 2010. Modes of developmental outgrowth and shaping of a craniofacial bone in zebrafish. PLoS One. 5:e9475. [DOI] [PMC free article] [PubMed] [Google Scholar]
- Lawson ND, Weinstein BM. 2002. In vivo imaging of embryonic vascular development using transgenic zebrafish. Dev Biol. 248:307–318. [DOI] [PubMed] [Google Scholar]
- Li N, Felber K, Elks P, Croucher P, Roehl HH. 2009. Tracking gene expression during zebrafish osteoblast differentiation. Dev Dyn. 238:459–466. [DOI] [PubMed] [Google Scholar]
- Livak KJ, Schmittgen TD. 2001. Analysis of relative gene expression data using real-time quantitative PCR and the 2(−Delta Delta C(T)) Method. Methods. 25:402–408. [DOI] [PubMed] [Google Scholar]
- Olsen BR, Reginato AM, Wang W. 2000. Bone development. Annu Rev Cell Dev Biol. 16:191–220. [DOI] [PubMed] [Google Scholar]
- Rittenhouse E, Dunn LC, Cookingham J, Calo C, Spiegelman M, Dooher GB, Bennett D. 1978. Cartilage matrix deficiency (cmd): a new autosomal recessive lethal mutation in the mouse. J Embryol Exp Morphol. 43:71–84. [PubMed] [Google Scholar]
- Robu ME, Larson JD, Nasevicius A, Beiraghi S, Brenner C, Farber SA, Ekker SC. 2007. p53 activation by knockdown technologies. PLoS Genet. 3:e78. [DOI] [PMC free article] [PubMed] [Google Scholar]
- Rosnoblet C, Legrand D, Demaegd D, Hacine-Gherbi H, de Bettignies G, Bammens R, Borrego C, Duvet S, Morsomme P, Matthijs G, et al. 2013. Impact of disease-causing mutations on TMEM165 subcellular localization, a recently identified protein involved in CDG-II. Hum Mol Genet. 22:2914–2928. [DOI] [PubMed] [Google Scholar]
- Schachter H, Freeze HH. 2009. Glycosylation diseases: quo vadis? Biochim Biophys Acta. 1792:925–930. [DOI] [PMC free article] [PubMed] [Google Scholar]
- Steet R, Kornfeld S. 2006. COG-7-deficient Human Fibroblasts Exhibit Altered Recycling of Golgi Proteins. Mol Biol Cell. 17:2312–2321. [DOI] [PMC free article] [PubMed] [Google Scholar]
- Thisse C, Thisse B, Schilling TF, Postlethwait JH. 1993. Structure of the zebrafish snail1 gene and its expression in wild-type, spadetail and no tail mutant embryos. Development. 119:1203–1215. [DOI] [PubMed] [Google Scholar]
- Varki A, Sharon N. 2009. Historical background and overview. In: Varki A, Cummings RD, Esko JD, Freeze HH, Stanley P, Bertozzi CR, Hart GW, Etzler ME, editors. Essentials of Glycobiology. Cold Spring Harbor: (NY: ): Cold Spring Harbor Laboratory Press. [PubMed] [Google Scholar]
- Wu X, Steet RA, Bohorov O, Bakker J, Newell J, Krieger M, Spaapen L, Kornfeld S, Freeze HH. 2004. Mutation of the COG complex subunit gene COG7 causes a lethal congenital disorder. Nat Med. 10:518–523. [DOI] [PubMed] [Google Scholar]
- Xia B, Zhang W, Li X, Jiang R, Harper T, Liu R, Cummings RD, He M. 2013. Serum N-glycan and O-glycan analysis by mass spectrometry for diagnosis of congenital disorders of glycosylation. Anal Biochem. 442:178–185. [DOI] [PubMed] [Google Scholar]
- Zeevaert R, de Zegher F, Sturiale L, Garozzo D, Smet M, Moens M, Matthijs G, Jaeken J. 2013. Bone dysplasia as a key feature in three patients with a novel congenital disorder of glycosylation (CDG) type ii due to a deep intronic splice mutation in TMEM165. JIMD Rep. 8:145–152. [DOI] [PMC free article] [PubMed] [Google Scholar]