Abstract
Background
Incidence rates of testicular cancer in Northern European and North American countries have been widely reported, whereas rates in other populations, such as Eastern Europe, Central/South America, Asia, and Africa, have been less frequently evaluated. We examined testicular cancer incidence rates overall and by histologic type by calendar time and birth cohort for selected global populations 1973-2007.
Methods
Age-standardized incidence rates over succeeding 5-year periods were calculated from volumes 4-9 of Cancer Incidence in Five Continents electronic database (CI5plus) and the newly-released CI5X (volume 10) database. Annual percent change over the 35-year period was calculated using weighted least squares regression. Age-period-cohort analyses were performed and observed rates and fitted rate ratios presented by birth cohort.
Results
Incidence rates of testicular cancer increased between 1973-1977 and 2003-2007 in most populations evaluated worldwide. Of note, incidence rates in Eastern European countries rose rapidly and approached rates in Northern European countries. Rates in Central and South America also increased and are now intermediate to the high rates among men of European ancestry and low rates among men of Asian or African descent. Some heterogeneity in the trends in seminoma and nonseminoma were observed in Denmark, the United Kingdom and among US whites, particularly in recent generations, with rapid and uniform increases in the incidence of both histologic types in Slovakia.
Conclusion
Reasons for the rising incidence rates among European and American populations remain unexplained; however, changing distributions in the prevalence of risk factors for testicular cancer cannot be ruled out.
Keywords: international trends, testicular cancer incidence, birth cohort, seminoma
Introduction
Accounting for approximately 1% of all male cancers, testicular cancer is a rare malignancy worldwide (Ferlay et al. 2012). In developed countries, however, it is the most commonly diagnosed cancer among men aged 15 to 44 years. Previous reports have noted large differences in incidence among racial/ethnic groups, and increases in incidence over the last half-century (Chia et al. 2010; Purdue et al. 2005; Znaor et al, 2014). The highest incidence rates during 1998-2002 were in Northern European countries, such as Norway which had an age-adjusted (world standard) rate of 12.2 per 100,000 men. In contrast, rates were low (less than 0.7 per 100,000) in most Asian and African countries (Chia et al. 2010).
Testicular germ cell tumors (TGCT) account for the vast majority (98%) of testicular cancers and are histologically grouped as seminomas, nonseminomas, and spermatocytic seminomas. Histologically, the most common TGCTs among young adult males are seminomas and nonseminomas (Fritz et al. 2000). In the United States (US), seminomas account for approximately 55% of all TGCTs, with a median age at diagnosis between 35 and 39 years (Shah et al. 2007). Approximately 44% of all TGCT are nonseminomas, which include embryonal carcinomas, teratomas, choriocarcinoma, yolk sak tumors, and mixed germ cell tumors, with a median age at diagnosis between 25 and 29 years of age. The remaining 1% of TGCTs are spermatocytic seminomas which have a median age at diagnosis of 54 years and are etiologically dissimilar to other TGCTs.
Testicular cancer rates in Northern European and North American countries have been rising over time with increases across successive birth cohorts reported for many of these countries (Bray et al. 2006; Sincic et al. 2012). In contrast, rates in other countries have been evaluated less frequently. As a follow-up to previous evaluations (Chia et al. 2010; Purdue et al. 2005), we examined international trends in testicular cancer incidence overall and by histologic type for the 35-year period from 1973 through 2007. This extends our prior evaluations by including additional registries in Eastern Europe, Central/South America, and Asia with at least 15 years of data, and an age-period-cohort analyses to assess the temporal heterogeneity in seminoma versus nonseminoma in selected populations.
Materials and Methods
All data used in the analysis were obtained from online resources including the CI5plus database (Ferlay et al. 2013) and the CI5X database (Forman et al. 2013). The CI5 series is published every five years to provide information on cancer site, sex, age, age-specific populations, age-adjusted incidence rates, and histologic type (if available) collected from several hundred cancer registries across the Americas, Africa, Asia, Europe, and Australia/Oceania. While the most recent data for the five-year period 2003-2007 (Volume 10) became available in the CI5X electronic database, data from the previous six volumes were extracted from CI5plus, which covered five-year periods of 1973–1977 (Volume 4), 1978–1982 (Volume 5), 1983–1987 (Volume 6), 1988–1992 (Volume 7), 1993–1997 (Volume 8), and 1998–2002 (Volume 9).
International trends in testicular cancer incidence were tabulated and plotted for the period 1973-1977 through 2003-2007 for the following regions: Northern Europe, Western Europe, Eastern and Southern Europe, North America, Central and South America, and Asia/Oceania. Registries with at least 15 consecutive years (3 volumes) of data were included, and one registry from each country was chosen. The registries selected for the current study were the same as those included in previous analyses to the extent possible (Chia et al. 2010; Purdue et al. 2005). Additional registries in Eastern Europe, Central/South America, and African areas with at least 15 years of data were also included. Rates were age-adjusted to the world standard population using 5-year age groups (Doll et al. 1966; Segi et al. 1957). To measure the change in age-adjusted rates over time, the annual percent change (APC) was calculated using weighted least squares regression of the natural log-transformed rates based on each 5-year period. Trends in incidence were plotted on a semi-log scale to facilitate comparison of temporal trends and magnitude across registries and regions (Devesa et al. 1995). Data were plotted at the midpoint of each 5-year time interval.
Age-standardized incidence rates by histology were obtained from the CI5plus detailed database and the CI5X database. For analyses based on the CI5X database, tumors were categorized as seminoma, nonseminoma (including embryonal carcinoma, teratoma, and choriocarcinoma), and other/unspecified/spermatocytic seminoma. Because the values for the specified histologic types could be influenced by the proportion of ‘unspecified’ cases, the percent unspecified from each registry was also reported. Spermatocytic seminomas were not separately identified in the CI5plus database so they are included in the seminoma category for analyses of trends over time. Further, to ensure adequate sample sizes in the analyses of trend by histology, data from the following registries within each country were combined: Manitoba, Nova Scotia, and Saskatchewan in Canada, the prefectures of Miyagi, Nagasaki, and Osaka in Japan, and Scotland and the following regions of England: Merseyside and Cheshire, North Western, Oxford, South and Western Regions, Birmingham and West Midlands, and East of England, in the United Kingdom.
To initially evaluate differences by histologic type, age-adjusted testicular cancer incidence rates for seminoma and nonseminoma for 10 countries were plotted by calendar period. We then analyzed and compared incidence trends by birth cohort in four countries to compare the heterogeneity of generation-specific trends, hypothesizing that similar temporal patterns in the cohort dimension suggests a relative consistency in their respective etiologies. For the birth cohort analyses, we selected one registry from each of the following regions: Northern Europe, Western Europe, Eastern Europe and North America, with the largest number of cases across the most volumes (registries included: Denmark, the United Kingdom, Slovakia, and US whites, respectively). Birth cohorts were obtained by subtracting the midpoints of 5-year age groups from the corresponding 1-year periods, and observed trends in incidence rates versus birth cohort by age were plotted using a semi-log scale. Assuming incidence rates were constant within age classes and periods of diagnosis, an age-period-cohort model was fit (Clayton & Schifflers 1987a; Clayton & Schifflers 1987b). We assumed the number of new cases followed a Poisson random variable with the logarithm of the person-years at risk specified as an offset: [log(λ(a, p)) = αa + βp + γc] where λ refers to the rate, αa, βp and γc are functions of respectively the age variable a, the period p and the birth cohort c. The cohort effects were estimated using the full age-period-cohort model with incidence rate ratios presented relative to the reference cohort, midpoint 1955. The non-identifiability inherent in age-period-cohort analyses – knowledge of the values of any two of age, period and cohort implies knowledge of the third, making one of the factors redundant – was managed by constraining the linear component of the period effect to have zero slope (for both histologic types) in presenting the cohort effects. As the solution presented is entirely dependent on our choice of equal allocation of the overall time trend (drift), caution should be applied when interpreting the results.
Data management and analyses were performed using SAS statistical software (v9.3, SAS Institute Inc., Cary, NC). Figures were plotted using SigmaPlot (v11.0, SY Software Inc., San Jose, CA). The age-period-cohort model analysis and presentation was performed using APCfit in Stata (StataCorp. 2011. Stata Statistical Software: Release 12. College Station, TX: StataCorp LP).
Results
Testicular cancer incidence rates were highest in European and North American countries and lowest in Asian and African countries (Table 1). The highest incidence rate occurred in Norway (10.5 per 100,000 man-years), followed by that of Denmark (10.1 per 100,000 man-years) and the lowest rate was seen in Uganda (0.3 per 100,000 man-years). The rates in Central and South America were intermediate to the high rates observed in European/North American countries and the low rates observed in Asian/African countries, with one exception: the rates in Valdivia, Chile reported in CI5 volumes 9 and 10 were notably higher (1998-2002: 8.8 per 100,000 man-years; 2003-2007: 13.7 per 100,000 man-years, not reported in Tables) than rates reported from other registries in the same geographic region (e.g. Bahia Blanca, Argentina (4.5 per 100-000 man-years) or Cali, Columbia (2.8 per 100-000 man-years). Because data for Valdivia, Chile were only available in the two most recent volumes, they were not included in trend analyses.
Table 1.
Testicular cancer incidence rates per 100,000 man-years (1973-1977 and 2003-2007).
| Population | 1973-1977 | 2003-2007 | APC | ||||
|---|---|---|---|---|---|---|---|
|
|
|
||||||
| Cases | Rate* | 95% CI | Cases | Rate* | 95% CI | ||
| Northern (Nordic) Europe | |||||||
| Norway | 448 | 4.5 | (4.0, 4.9) | 1286 | 10.5 | (10.0, 11.1) | 2.9%† |
| Sweden | 668 | 3.1 | (2.9, 3.4) | 1407 | 6.2 | (5.9, 6.5) | 2.4%† |
| Finland | 205 | 1.6 | (1.4, 1.9) | 578 | 4.5 | (4.1, 4.9) | 3.7%† |
| Denmark | 936 | 7.0 | (6.6, 7.5) | 1456 | 10.1 | (9.5, 10.6) | 0.9%† |
| Iceland | 17 | 3.1 | (1.6, 4.6) | 49 | 6.0 | (4.3, 7.7) | 2.4%† |
| Western Europe | |||||||
| Ireland | - | - | - | 787 | 6.6 | (6.1, 7.1) | 2.0%† |
| United Kingdom, (South) Thames§ | 451 | 3.3 | (3.0, 3.6) | 1769 | 5.2 | (5.0, 5.5) | 1.9%† |
| Germany, Saarland | 87 | 3.2 | (2.5, 3.9) | 225 | 7.8 | (6.7, 8.9) | 2.5%† |
| Switzerland, Vaud | - | - | - | 146 | 8.0 | (6.7, 9.3) | 0.5% |
| France, Bas-Rhin | 48 | 3.4 | (2.4, 4.3) | 252 | 8.4 | (7.3, 9.4) | 2.8%† |
| Spain, Navarra | 16 | 1.3 | (0.6, 1.9) | 70 | 4.1 | (3.1, 5.1) | 3.8%† |
| Eastern Europe | |||||||
| Estonia | 48 | 1.3 | (0.9, 1.7) | 97 | 2.8 | (2.2, 3.3) | 2.8%† |
| Poland, Cracow | - | - | - | 87 | 5.1 | (4.0, 6.2) | 2.9%† |
| Czech Republic | - | - | - | 2227 | 7.5 | (7.2, 7.9) | 2.8%† |
| Slovakia | 277 | 2.3 | (2.0, 2.6) | 1161 | 7.5 | (7.1, 8.0) | 4.2%† |
| Slovenia | 97 | 2.0 | (1.6, 2.3) | 487 | 8.6 | (7.8, 9.4) | 4.9%† |
| Italy, Lombardy, Varese | - | - | - | 172 | 7.6 | (6.4, 8.9) | 3.1%† |
| North America | |||||||
| Canada, Ontario | - | - | - | 1630 | 4.8 | (4.6, 5.0) | 1.6%† |
| US: SEER-9 White | 1091 | 4.0 | (3.7, 4.2) | 3635 | 6.4 | (6.1, 6.6) | 1.4%† |
| US: SEER-9 Black | 21 | 0.8 | (0.4, 1.1) | 101 | 1.1 | (0.9, 1.3) | 1.9%† |
| Central/South America | |||||||
| Costa Rica | - | - | - | 409 | 3.4 | (3.1, 3.7) | 2.4%† |
| Colombia, Cali | 26 | 1.5 | (0.9, 2.2) | 146 | 2.8 | (2.3, 3.2) | 2.6%† |
| Ecuador, Quito | - | - | - | 199 | 4.9 | (4.2, 5.6) | 2.8%† |
| Brazil, Goiania | - | - | - | 54 | 1.7 | (1.3, 2.2) | 2.4%† |
| Argentina, Bahia Blanca | - | - | - | 33 | 4.5 | (2.9, 6.0) | 2.0% |
| Asia/Oceania | |||||||
| Israel: Jews | 140 | 1.8 | (1.5, 2.2) | 631 | 4.6 | (4.3, 5.0) | 3.1%† |
| India, Mumbai | 92 | 0.9 | (0.6, 1.2) | 257 | 0.6 | (0.6, 0.7) | -1.1%† |
| China, Hong Kong | 114 | 1.3 | (1.1, 1.6) | 256 | 1.5 | (1.3, 1.7) | 2.2% |
| Japan, Osaka Prefecture | 212 | 0.9 | (0.8, 1.0) | 313 | 1.3 | (1.1, 1.4) | 0.3% |
| Singapore: Chinese | 32 | 0.8 | (0.5, 1.1) | 93 | 1.3 | (1.0, 1.6) | 1.1% |
| Australia, New South Wales | 386 | 3.0 | 1105 | 6.1 | (5.7, 6.5) | 2.6%† | |
| New Zealand | - | - | - | 733 | 6.8 | (6.3, 7.3) | 1.0%† |
| Africa | |||||||
| Uganda, Kyadondo County | - | - | - | 12 | 0.3 | (0.1, 0.5) | - |
NOTE: Prior to Volume 6 (1983-1987), rates for New Zealand were split into Maori and non-Maori populations.
Rate per 100,000 man-years, age-adjusted to the world standard population.
Annual Percent Change (APC), p-value <0.05
Through Volume 8, the United Kingdom, England (South) Thames data included only the South Thames region, covering approximately 6.8 million persons; in Volumes 9 and 10, this registry was expanded to include the entire Thames region, including more than 14 million people.
Incidence rates increased world-wide in almost every country evaluated (Table 1, Figure 1). The APC in testicular cancer incidence over the past 35 years (1973-2007) is plotted in Figure 1 against the age-adjusted rate in the most recent time period (2003-2007). The incidence rates in 8 out of 11 countries/registries evaluated in Northern and Western Europe were increasing at least 2% per year, with rapid increases in Navarra, Spain (APC=3.8%, p-value < 0.05) and Finland (APC=3.7%, p-value < 0.05). In Norway, the country with the highest incidence of testicular cancer, the rate was also increasing rapidly (APC=2.9%, p-value < 0.05), whereas in Denmark the rate was increasing but not as rapidly (APC=0.9%, p-value < 0.05). Of note, the incidence rates increased strikingly in Slovenia (APC=4.9%, p-value < 0.05) and Slovakia (APC=4.2%, p-value < 0.05), with rates in the most recent period that are comparable to rates in Northern and Western European countries/registries. The rates of increase in the incidence of testicular cancer in the US and Canada were smaller (APC: 1.4-1.9%), while in Central/South American countries/registries the APCs ranged from 2.0% to 2.8%. Increases in the incidence rates of Asian and African populations were less pronounced (APC: 0.3-2.2%) with the exception of Israeli Jewish men (APC = 3.1%, p-value <0.05). India, Mumbai, in contrast, was the only registry where rates decreased significantly over time (APC = -1.1%, p-value < 0.05).
Figure 1.
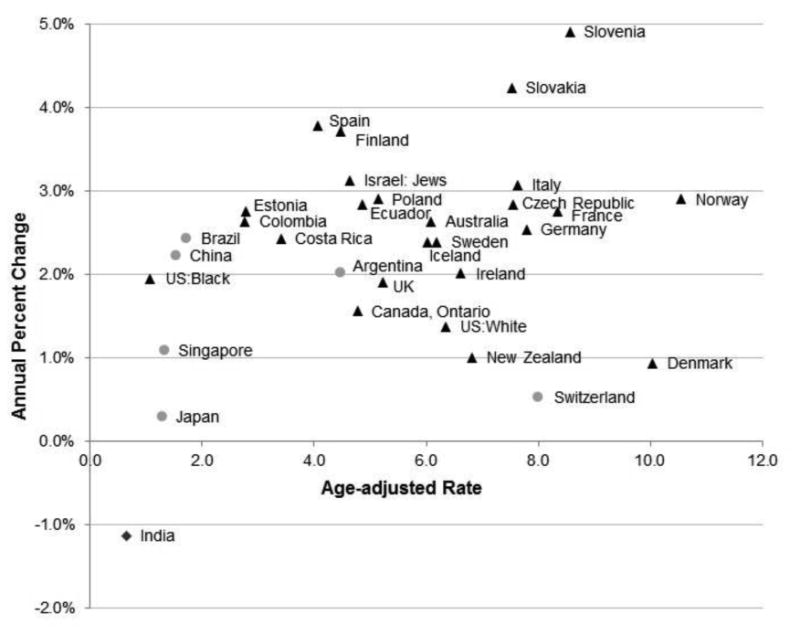
Annual Percent Change (APC) in age-adjusted incidence rate from 1973-1977 through 2003-2007 plotted by the age-adjusted rate in 2003-2007. Triangles represent populations in which the APC increased (p-value < 0.05), circles represent populations in which the APC remained constant (p-value ≥ 0.05), and the diamond represents the population in which the APC decreased across the time period evaluated (p-value < 0.05).
Figure 2 depicts temporal trends in testicular cancer incidence rates. Rates increased most rapidly in the Eastern and Southern European countries with intermediate rates in the early time period and rates that approached the rates in Northern and Western European countries by the most recent time period. Rates in Canada, Ontario and US whites plateaued; rates in the US black population continued to be considerably lower that the rates of US whites. Rates in Central and South America also increased to become intermediate to the high rates among men of European ancestry and low rates among men of Asian or African descent. Rates in China, Japan, and Singapore were relatively low and did not increase consistently; while rates in India declined.
Figure 2.
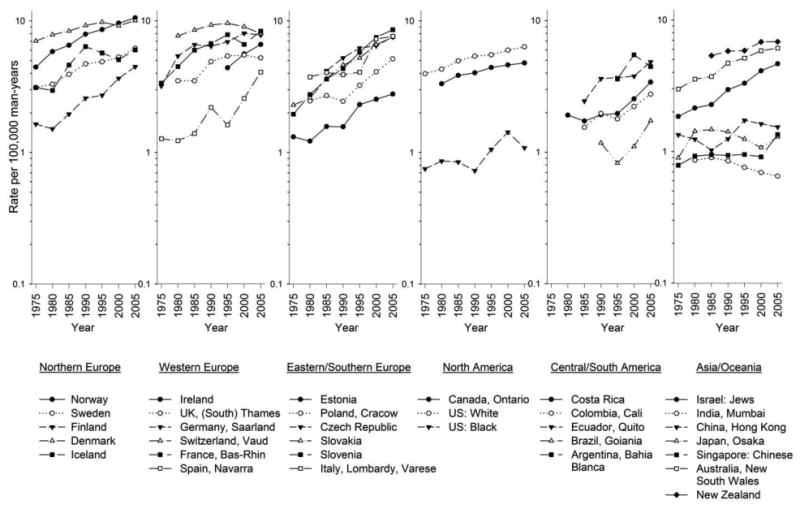
Trends in age-adjusted testicular cancer rates by continent and registry/country (1973-1977 through 2003-2007). Rates are per 100,000 man-years and adjusted to the World Standard population.
We further evaluated trends in testicular cancer incidence by combining data across registries within a country (results not shown). The incidence rates and trends were not substantially different as compared with the rates reported from the largest registry (data not shown). The one exception was the rate in the most recent time period of France, Bas-Rhin (8.4 per 100,000 man-years) which was somewhat higher than the rate combining all registries in France (6.7 per 100,000 man-years).
During the most recent time period seminoma accounted for just over half of all testicular cancers in the majority of registries evaluated (Figure 3). The proportion of testicular cancer of type unspecified was less than 1%. The proportion of seminoma and nonseminoma did not differ substantially across registries and there was no association between histologic types with the overall rate of testicular cancer.
Figure 3.
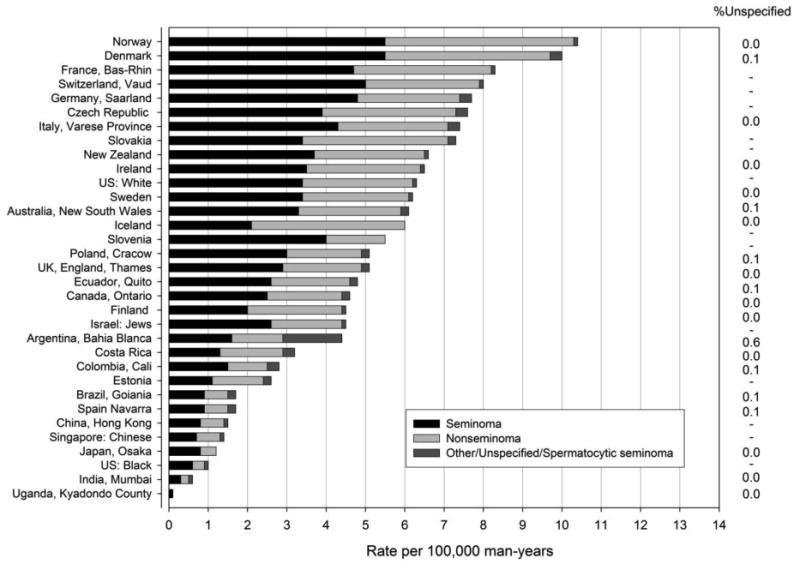
Incidence rates of testicular cancer by histologic type (per 100,000 man-years) age-adjusted to the world standard population for selected populations during 2003-2007.
Although seminomas and nonseminomas have different clinical characteristics, their incidence patterns are similar in most countries (Figure 4). The rate for seminoma was higher than nonseminoma across the time period for most of the countries evaluated. Three notable exceptions include Slovakia, where nonseminoma rates exceeded those of seminoma, Costa Rica where nonseminoma rates have exceeded rates of seminoma in the most recent time periods, and Estonia, where nonseminoma rates exceeded those of seminoma in volume 9 but appear to be relatively equal in volume 10.
Figure 4.
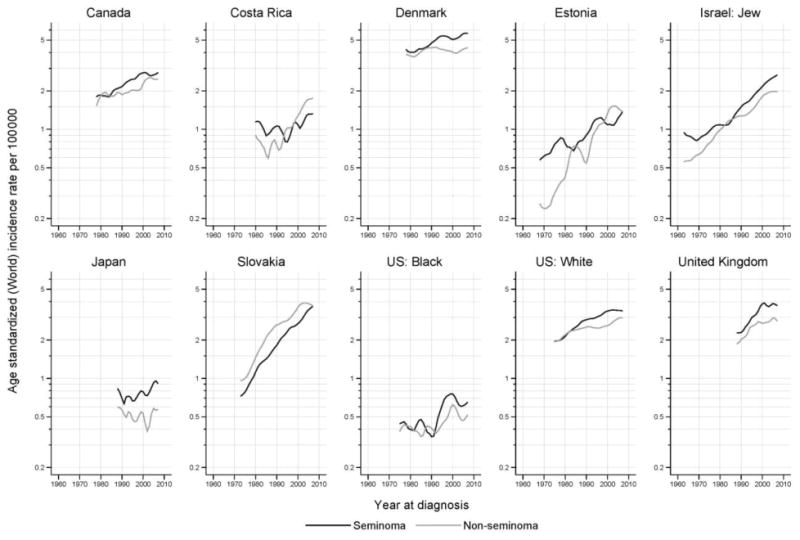
Trends in age-adjusted testicular cancer rates by calendar period for seminoma and nonseminoma, 1973-2007. Rates are per 100,000 man-years, adjusted to the world standard population.
Figure 5 shows the trends in testicular cancer rates plotted versus birth year by 5-year age group stratified by seminoma and nonseminoma for selected countries. Trends in the incidence of testicular cancer by subtype in Denmark, and to a lesser extent in US whites, have remained relatively constant in successive postwar birth cohorts, particularly for nonseminoma. In comparison, rates of both seminoma and nonseminoma appear to be increasing slightly in recent birth cohorts in the United Kingdom. Of note are the striking birth cohort increases in seminoma and nonseminoma in successive generations in Slovakia.
Figure 5.
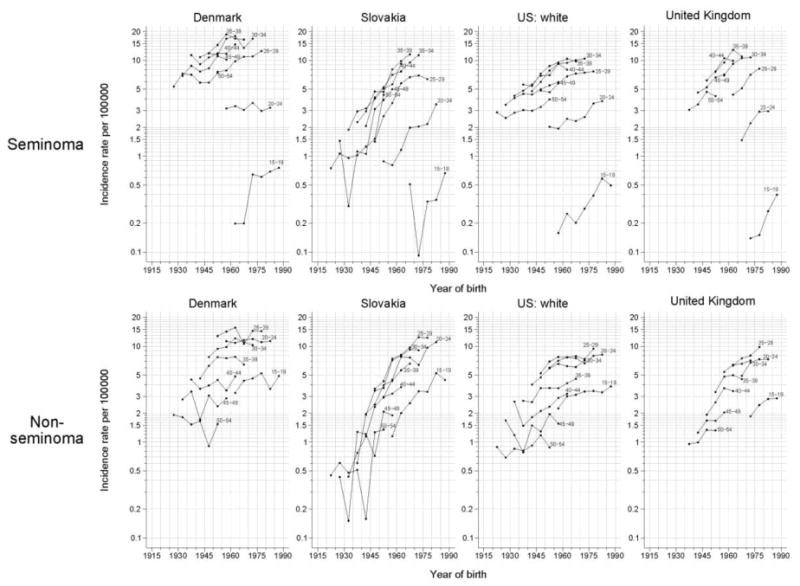
Testicular cancer incidence rates per 100,000 man-years by year of birth for seminoma (top) and nonseminoma (bottom) from four selected countries. Rates are displayed on a semilog scale. For each graph, rates in the 5-year age-groups 15-19, 20-24, …, 50-54 years are plotted.
As expected, the modelled age at peak incidence of nonseminoma was approximately 10 years earlier than it was for seminoma (Figure 6). Some heterogeneity in the modeled rate ratios are seen, with increases more rapid for seminoma than nonseminoma in Denmark, the United Kingdom and among US whites, particularly in recent generations. In contrast, the uniformly increasing rate ratios in Slovakia match the corresponding observed trends of Figure 5, with the model parameters rather similar for seminoma and nonseminoma.
Figure 6.
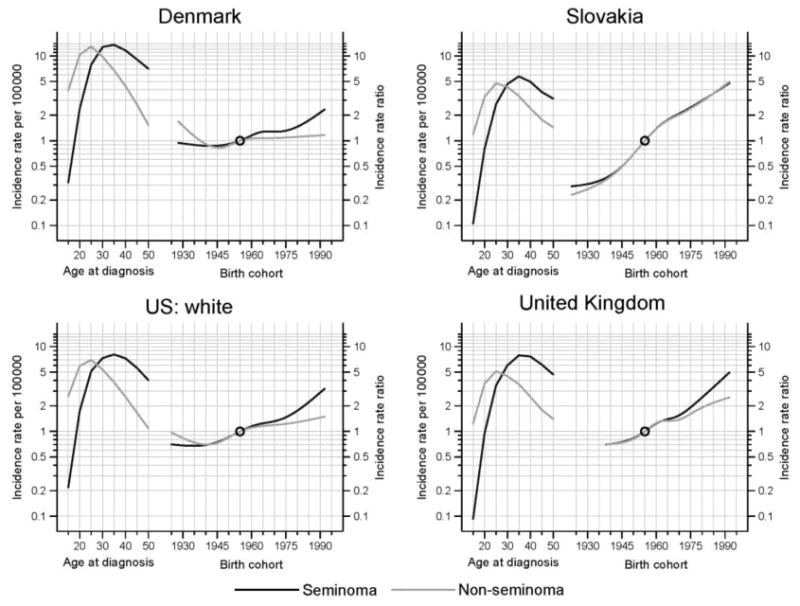
Histology-specific testicular cancer incidence: longitudinal rates per 100,000 man-years (left) and incidence rate ratios by birth cohort (right) in four selected countries. Rates are adjusted to the world standard population. Incidence rate ratios are relative to the reference cohort, midpoint 1955.
Discussion
Large global variation in testicular cancer rates continues to exist, as shown by our analysis of data from CI5. Testicular cancer remains a disease primarily of men of European descent. Incidence rates have been high in Northern European countries for some time, but our analysis found that testicular cancer rates in some Eastern European countries increased rapidly and approached rates in Northern/Western Europe. Further, the current analysis revealed that testicular cancer rates are increasing worldwide, including evidence for recent increases in Central/South America.
The geographic variation in testicular cancer rates suggests that populations differ in the genetic and/or environmental factors that influence risk. It has been suggested that approximately 25% of TGCT susceptibility is due to genetic effects (Turnbull & Rahman 2011). Additional evidence in favor of a role for inherited susceptibility comes from familial studies which have found that brothers have an eight-fold increased risk and sons a four-fold increased risk compared with men with no affected relatives (Dong & Hemminki 2001). However, the increased familial risks also may reflect shared environmental exposures among genetically susceptible populations. Rising incidence rates in populations of European ancestry suggest that Westernization/industrialization and/or environmental exposures associated with Westernization could be shared risk factors in addition to European ancestry. This may be especially true for Central and South American countries where there has been considerable immigration from European nations other than Spain and Portugal (e.g. Chile, Argentina, and Brazil). No specific environmental exposure, however, has been implicated to date.
Even in the high-rate region of Northern Europe, incidence rates varied between countries in the same geographic area, ranging from very high rates in Denmark and Norway to lower rates in Sweden and particularly, Finland. As demonstrated by the APCs, the more rapid increase in Finland and the minimal increase in Denmark may indicate that the gap in incidence will soon be closed. Rates in Estonia, a nation in close geographic proximity to Finland are also increasing. Differences in genetic background likely explain only a very small proportion of the differences in incidence rates by country in this region, and migrant studies provide support that both the environment and genetics play an important role. For example, men from low-rate Finland migrating to higher-rate Sweden have a lower risk of testicular cancer regardless of their age at immigration, while testicular cancer among their sons tends to approach the incidence of Swedish men (Ekbom et al. 2003). In contrast men from high-rate Denmark who migrate to lower-rate Sweden maintain a higher risk, while testicular cancer risk in their sons is dependent on both parents, with risk remaining high if both parents are Danish, and risk declining to the rate in Sweden if only one parent is Danish (Hemminki & Li 2002).
Histopathological studies demonstrate that both seminomas and nonseminomas arise from fetal primordial germ cells (gonocytes) and develop through the precursor, carcinoma in situ (CIS). Based on these observations, it is widely suggested that in utero exposures are important in the etiology of testicular cancer. However, risk factor data also support that post-natal exposures may also be important (McGlynn & Trabert 2012). In the current study, the rates and patterns in trends by seminoma and nonseminoma were, for the most part, similar across the countries evaluated and by birth cohort. There was some suggestion, however, that there was a more pronounced birth cohort effect on rates of seminoma than nonseminoma in Denmark and among US whites. The striking birth cohort effects in Slovakia were consistent for both seminomas and nonseminomas, suggesting a rapid increase in the prevalence of risk factors over the last 100 years.
Strengths of this study include the use of CI5 data based on large, well-established registries throughout the world and rigorous data quality standards that are applied across all volumes. The data are limited, however, in that complete nationwide cancer registry data are not available for many countries. When possible we selected large registries from countries with more than one registry but it remains possible that the individual registry used does not reflect nationwide patterns in testicular cancer incidence. However, our evaluation combining overall rates across registries argues that rates of testicular cancer in the largest registry seem to adequately reflect nationwide rates. Further, in analyses by histologic type we combined across registries in Canada, Japan and the United Kingdom to ensure adequate numbers for age-period-cohort plots. As with any registry-based data on a rare tumor, trends reported from smaller registries should be interpreted with caution as they are based on small numbers and are prone to random variation.
In conclusion, this analysis of international cancer registry data suggests that testicular cancer incidence continued to increase in many countries worldwide over the past several decades. Notable increases were observed for Eastern European countries, including Slovenia and Slovakia, as well as countries/registries in Central and South America. In contrast, rates in Asian populations remain low in comparison to European-descended populations and have been relatively stable over time. Rates increased significantly among US blacks, although the rates remain considerably lower than those among US whites; rates in Africa were also very low. In only one population, that of India (Mumbai) rates declined. The dramatic increases observed in some countries suggest that changes in environmental risk factors are behind the trends, although, genetic susceptibility is likely to explain some of the racial/ethnic differences rates.
Acknowledgments
The authors would like to thank Mathieu Laversanne, IARC, for age-period-cohort analysis and associated graphics.
References
- Bray F, Richiardi L, Ekbom A, Pukkala E, Cuninkova M, Møller H. Trends in testicular cancer incidence and mortality in 22 European countries: continuing increases in incidence and declines in mortality. Int J Cancer. 2006;118:3099–111. doi: 10.1002/ijc.21747. [DOI] [PubMed] [Google Scholar]
- Chia VM, Quraishi SM, Devesa SS, Purdue MP, Cook MB, McGlynn KA. International trends in the incidence of testicular cancer, 1973-2002. Cancer Epidemiol Biomarkers Prev. 2010;19:1151–1159. doi: 10.1158/1055-9965.EPI-10-0031. [DOI] [PMC free article] [PubMed] [Google Scholar]
- Clayton D, Schifflers E. Models for temporal variation in cancer rates. I: Age-period and age-cohort models. Stat Med. 1987a;6:449–67. doi: 10.1002/sim.4780060405. [DOI] [PubMed] [Google Scholar]
- Clayton D, Schifflers E. Models for temporal variation in cancer rates. II: Age-cohort models. Stat Med. 1987b;6:469–81. doi: 10.1002/sim.4780060406. [DOI] [PubMed] [Google Scholar]
- Devesa SS, Donaldson J, Fears T. Graphical presentation of trends in rates. Am J Epidemiol. 1995;141:300–304. doi: 10.1093/aje/141.4.300. [DOI] [PubMed] [Google Scholar]
- Doll R, Payne P, Waterhouse J. Cancer incidence in five continents: a technical report. Berlin: Springer-Verlag; 1966. [Google Scholar]
- Dong C, Hemminki K. Modification of cancer risks in offspring by sibling and parental cancers from 2,112,616 nuclear families. International Journal of Cancer. 2001;92:144–150. [PubMed] [Google Scholar]
- Ekbom A, Richiardi L, Akre O, Montogmery SM, Sparen P. Age at immigration and duration of stay in relation to risk for testicular cacner among Finnish immigrants to Sweden. Journal of the National Cancer Institute. 2003;95:1238–1240. doi: 10.1093/jnci/djg012. [DOI] [PubMed] [Google Scholar]
- Ferlay J, Bray F, Steliarova-Foucher E, Forman D. Cancer incidence in five continents, CI5plus: IARC CancerBase. No. 9. Lyon, France: International Agency for Research on Cancer; 2013. [accesssed on 03/28/2014]. Internet. Available from: http://ci5.iarc.fr. [Google Scholar]
- Ferlay J, Soerjomataram I, Ervik M, Dikshit R, Eser S, Mathers C, Rebelo M, Parkin DM, Forman D, Bray F. GLOBOCAN 2012 v1.0, Cancer Incidence and Mortality Worldwide: IARC CancerBase. No. 11. Lyon, France: International Agency for Research on Cancer; 2012. [accessed on 03/28/2014]. Internet. Available from: http://globocan.iarc.fr. [Google Scholar]
- Forman D, Bray F, Brewster DH, Gombe Mbalawa C, Kohler B, Piñeros M, Steliarova-Foucher E, Swaminathan R, Ferlay J, editors. Cancer Incidence in Five Continents, Vol X (electronic version) Lyon: IARC; 2013. [last accessed on 03/28/2014]. http://ci5.iarc.fr. [DOI] [PubMed] [Google Scholar]
- Fritz A, Percy C, Jack A, Shanmugaratnam K, Sobin L, Parkin D, Whelaln S, editors. International classification of disease for oncology (ICD-O) 3rd. World Health Organization; 2000. [Google Scholar]
- Hemminki K, Li X. Cancer risks in Nordic immigrants and their offspring in Sweden. European Journal of Cancer. 2002;38:2428–2434. doi: 10.1016/s0959-8049(02)00496-3. [DOI] [PubMed] [Google Scholar]
- McGlynn KA, Trabert B. Adolescent and adult risk factors for testicular germ cell tumors. Nature Reviews Urology. 2012;9:339–349. doi: 10.1038/nrurol.2012.61. [DOI] [PMC free article] [PubMed] [Google Scholar]
- Purdue MP, Devesa SS, Sigurdson AJ, McGlynn KA. International patterns and trends in testis cancer incidence. International Journal of Cancer. 2005;115:822–827. doi: 10.1002/ijc.20931. [DOI] [PubMed] [Google Scholar]
- Segi M, Fujisaku S, Kurihara M. Geographical observation on cancer mortality by selected sites on the basis of standardised death rate. Gann. 1957;48:219–225. [PubMed] [Google Scholar]
- Shah MN, Devesa SS, Zhu K, McGlynn KA. Trends in testicular germ cell tumours by ethnic group in the United States. International Journal of Androglogy. 2007;30:206–213. doi: 10.1111/j.1365-2605.2007.00795.x. [DOI] [PubMed] [Google Scholar]
- Sincic N, Kulis T, Znaor A, Bray F. Time trends in testicular cancer in Croatia 1983-2007: rapid increases in incidence, no declines in mortality. Cancer Epidemiol. 2012;36:11–5. doi: 10.1016/j.canep.2011.09.010. [DOI] [PubMed] [Google Scholar]
- Turnbull C, Rahman N. Genome-wide association studies provide new insights into the genetic basis of testicular germ-cell tumour. International Journal of Andrology. 2011;34:e86–e96. doi: 10.1111/j.1365-2605.2011.01162.x. [DOI] [PubMed] [Google Scholar]
- Znaor A, Lortet-Tieulent J, Jemal A, Bray F. International variations and trends in testicular cancer incidence and mortality. Eur Urol. 2014;65:1095–106. doi: 10.1016/j.eururo.2013.11.004. [DOI] [PubMed] [Google Scholar]


