

Abstract
One of the most serious complications faced by inflammatory bowel disease (IBD) is the potential development of colorectal cancer (CRC). There is a compelling need to enhance the accuracy of cancer screening of IBD patients. MicroRNAs (miRNAs) are small non-protein-coding RNAs that play important roles in CRC oncogenesis. In this study, we report differential miRNA expression in IBD patients with associated CRC, from non-neoplastic tissue to dysplasia and eventually cancer. In addition, we identify and examine the role of dysregulated miRNAs in the TP53 pathway. In our CD patients, six miRNAs were up-regulated from non-neoplastic tissue to dysplasia, but down-regulated from dysplasia to cancer (miR-122, miR-181a, miR-146b-5p, let-7e, miR-17, miR-143) (p<0.001). Six differentially expressed miRNAs affected the TP53 pathway (miR-122, miR-214, miR-372, miR-15b, let-7e, miR-17) (p<0.001). Using two human colon cancer cell lines (HT-29 and HCT-116), E2F1, an upstream regulator of TP53, was down-regulated in both cell lines transfected with let-7e (p<0.05) as well as in HCT-116 cells transfected with miR-17 (p<0.05). Additionally, cyclin G, a cell-cycle regulator miR-122 target was down-regulated in both cell lines (p<0.05). Unique differentially expressed miRNAs were observed in CD-associated CRC progression. Six of these miRNAs had a tumorigenic effect on the TP53 pathway; the effect of three of which was studied using cell lines.
Keywords: IBD, Crohn disease, ulcerative colitis, cancer, dysplasia, microRNA
INTRODUCTION
Inflammatory bowel diseases (IBD) are a group of autoimmune disorders that affect the gastrointestinal tract. This group includes Crohn disease (CD) and ulcerative colitis (UC). The worldwide incidence rate for UC varies between 0.5–24.5 out of 100,000 persons; for CD, between 0.1–16; and for IBD, the prevalence rate is as high as 396 per 100,000 persons worldwide (Lakatos, 2006). In America, IBD affects an estimated 1.4 million, with slightly more women than men affected (Hugot et al., 1999; Loftus, Jr. and Sandborn, 2002). Thus, IBD represents a significant health problem.
The increased risk of developing CRC is one of the most serious long-term complications faced by patients with UC and Crohn colitis. UC, in particular, carries a high risk for malignant transformation, with UC patients being up to 30 times more likely to develop colorectal cancer (CRC) and three times more likely to die from CRC compared with the general population (Gillen et al., 1994; Greenstein, 2000; Rhodes and Campbell, 2002a). Risk factors for IBD-associated (IBD-a) CRC in UC patients include: disease duration greater than 8 years, pancolitis, biopsy-proven colonic dysplasia, and the presence of primary sclerosing cholangitis affecting the liver (Bernstein et al., 2001; Broome et al., 1995; Gillen et al., 1994). There is also an increased risk of IBD-a colon carcinoma for patients with CD (Greenstein et al., 1981; Weedon et al., 1973; Gyde et al., 1980; Bernstein et al., 2001). Feagin et al. (Feagins et al., 2009) reported that individuals with Crohn colitis are believed to have a 4.5-fold higher relative risk of developing CRC than the general population.
Little is known about the underlying genetic changes that occur as IBD progresses from benign mucosa to dysplasia and eventually to invasive CRC. A partial explanation for this progression may be a genetic basis for the increased risk of CRC in IBD patients (Kraus and Arber, 2009). It is possible that the high levels of inflammatory substrates produced may contribute to the development and progression of CRC (Kraus and Arber, 2009). In addition, the pathogenesis of IBD-a CRC has been poorly described as compared to sporadic CRC. Interestingly, different mechanisms are suggested for each (i.e., TP53; MIM# 191170) mutations occurring late in sporadic CRC, while appearing early in the course of IBD-a CRC (Riddell et al., 1983).
MicroRNAs (miRNAs) are small (20-22 nucleotide) non-protein-coding RNAs that appear to play important roles in oncogenesis (Yang et al., 2009). They regulate gene expression at the post-transcriptional level by binding to specific messenger-RNAs (mRNAs) and leading to their degradation or repressed protein production (Wu et al., 2008). Changes in the expression profiles of miRNAs have been observed in a variety of human tumors. Currently, there is evidence that miRNAs act as oncogenic miRNAs or tumor suppressors in human CRC (Yang et al., 2009). miRNA expression abnormalities have been found to be associated with TP53 dysregulation, an important tumor suppressor whose activity is often lost during CRC (Yang et al., 2009).
Our aim was to study the effects of miRNA in IBD-a neoplasia, the pathways they affect, and their possible tumorigenic impact. To our knowledge, ours is the first report on the differential expression of miRNAs in IBD-a CRC-progression, from non-neoplastic tissue to dysplasia and to invasive cancer. This was done in a carefully selected group of IBD patients who are likely to be the only immunotherapy-naive cancer patients thus far examined and who had all three tissue types (non-neoplasia, dysplasia, and cancer) simultaneously available within the same resected colon specimen of each patient. Our report differs from others (Bruwer et al., 2002; Holzmann et al., 1998; Sato and MacHinami, 1999), in that we have carefully examined the tumorigenic effect of differentially expressed miRNAs on the TP53 pathway using human colon cancer cell lines.
MATERIALS AND METHODS
Patients
Our study was approved by the University of Louisville Institutional Review Board (IRB), and written informed consent was obtained from all subjects. Patients were derived from the University of Louisville medical and surgical digestive disease practice and included those who were diagnosed with IBD. Diagnoses were confirmed by using conventional radiologic, endoscopic, and/or histopathologic criteria. Six patients (4 CD patients, 2 UC patients) who did not receive immunosuppressive therapy and who were operated on for IBD-a CRC were the focus of this study.
Extraction and quantification of RNA
Eighteen formalin-fixed paraffin-embedded (FFPE) blocks of each tissue type (IBD-affected non-neoplastic tissue, dysplasia, cancer) were collected for all patients. Isolated cell populations of each cell type (Figs. 1a–1f) were obtained using laser capture microdissection (LCM) (Arcturus PixCell II System™, Arcturus, Sunnyvale, CA) with the assistance of a specialist gastrointestinal pathologist with an interest in inflammatory bowel disease. Specific cell populations were each collected on a cap separately and prepared for RNA isolation. Cells were treated and lysed, and RNA was collected and isolated (Arcturus Paradise kit™, Sunnyvale, CA) for total RNA extraction.
Figure 1.
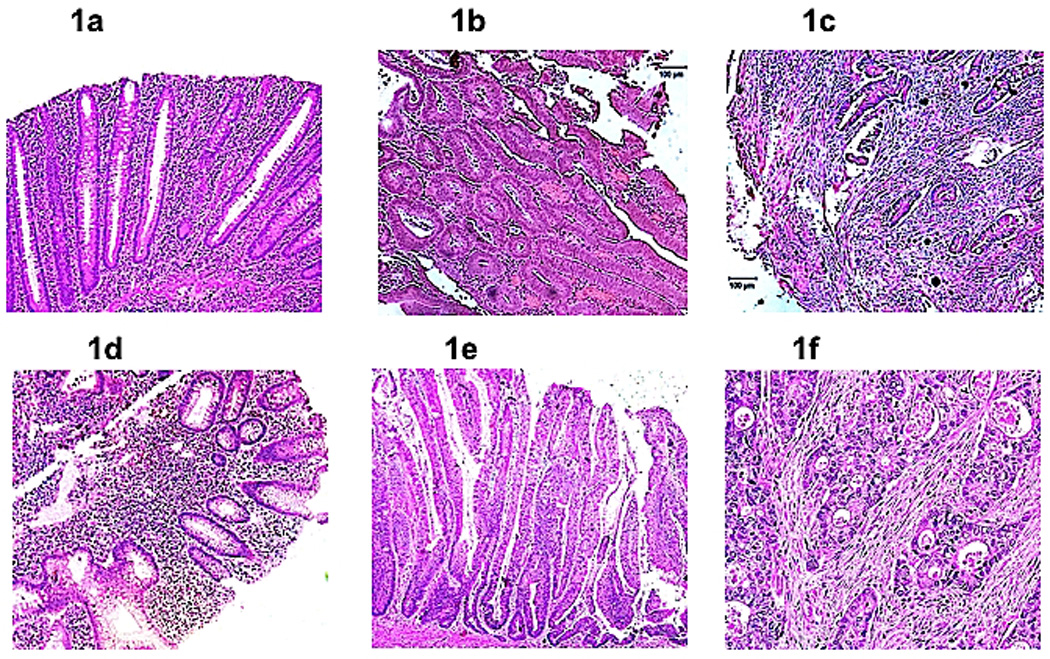
(a). Non-neoplastic Crohn disease. Section showing chronically inflamed colonic mucosa without architectural change (magnification, 100×). The cytological features of dysplasia are absent. (b). Crohn disease-associated (CD-a) dysplasia. Section of dysplasia in Crohn disease showing a tubulovillous adenoma-like dysplasia lesion (magnification, 100×). (c). Crohn disease-associated (CD-a) cancer. Invasive carcinoma in a Crohn disease patient showing infiltrating carcinoma glands set in tumor desmoplasia (magnification, 100×). (d). Non-neoplastic ulcerative colitis. Section showing chronically inflamed colonic mucosa without architectural change (magnification, 100×). The cytological features of dysplasia are absent. (e). Ulcerative colitis-associated (UC-a) dysplasia. High magnification view of part of a villous adenoma-like dysplastic lesion in a patient with ulcerative colitis (magnification, 200×). Note the full thickness stratification of nuclei with nuclei occupying the luminal portions on many of these colonic epithelial cells. (f). Ulcerative colitis-associated (UC-a) colorectal cancer. Infiltrating moderately differentiated adenocarcinoma characterized by neoplastic glands showing an infiltration pattern set in tumor desmoplasia (magnification, 200×).
Total RNA was quantified (Nanodrop N-1000, Agilent Biosystems™, Santa Clara, CA), and RNA quality control was maintained through measurements of RNA purity by UV spectrophotometry and assessment of RNA quality and integrity. First-strand cDNA synthesis was performed using a Reaction Ready first-strand cDNA synthesis kit (SA Biosciences™, Frederick, MD), which requires 100 ng of total RNA, according to the manufacturer's protocol. The template cDNA was then combined with target gene specific or β-actin control RT2 PCR primer sets, RT2 Real-Time SYBR Green/Rox Master Mix (SA Biosciences™, Frederick, MD), and double-distilled water. A final reaction volume of 25 μL was added to each well in the RT-PCR plates.
Human Cancer Arrays were obtained from SuperArray Biosciences® (SA biosciences™, Frederick, MD). The Cancer miRNA RT2 profiles the expression of 88 miRNA sequences whose levels correlate well with the diagnosis, staging or progression, and prognosis of various cancers or tumors (Supp. Table S1). These plates, after being loaded with the cDNA, were run on a 7300 real-time PCR system (Applied Biosystems™, Foster City, CA), following the manufacturer's protocol (SA biosciences Website (Help Manual), 2011). All of the samples were run in triplicate. Array data were validated with dissociation melting curves for each miRNA. U6 was utilized as the endogenous control for normalization, per plate, in our IBD patient analyses. U6 was the most uniformly and constitutively expressed in all tissue types (non-neoplastic, dysplastic, and cancerous). Others have validated the stability of U6 for normalization (Galiveti et al., 2010).
MicroRNA validation
After detection of statistically significant miRNAs found to be dysregulated in IBD-a cancer progression, such dysregulation was validated using miRNA Taqman assays from Applied BiosystemsTM (Carlsbad, CA) (Ingenuity Pathway Analysis Website (Help Manual), 2011)
Pathway analysis
Pathway analysis was performed (Ingenuity Pathway Analysis™, IPA 8.0, Redwood city, CA) to better understand the significance of miRNA expression fold changes and dysregulation. The ingenuity pathway analysis can identify pathways potentially involved, and every “potential” function would eventually need to be confirmed through further investigation.
Colon cancer cell line studies
In order to identify the effect of the over-expression of validated miRNAs on TP53 dysregulation in-vitro, we utilized two human colon cancer cell lines (HT-29 and HCT-116). HT-29 (human colon adenocarcinoma) and HCT-116 (human colorectal carcinoma) cells were cultured in McCoy's modified medium with 10% FBS, streptomycin, and penicillin. Cells were transfected with the pre-miRNAs for the three most dysregulated miRNAs found in CD-a CRC progression as well as a negative control (all from Ambion) using the SilentFect lipofection reagent (Bio-Rad, Hercules, CA). Each transfection was performed in triplicate, and cells were then cultured for 72hrs. RNA was extracted from half of the cells in each transfection replicate using the RNEasy Qiagen kit (Valencia, CA). The remaining cells were treated with 1× chromatin extraction buffer, and cellular protein quantified with a Bradford protein assay. We validated the transfection by RT-PCR using TaqMan® assays and the delta-delta Ct method. We used let-7b for normalization in the transfection cell line studies (HT-29 and HCT-116) since this miRNA had no expression change in our samples. Target mRNA expression analysis in transfected cells was performed using qPCR with SYBR dye and primers designed using qPrimerDepot's primer database (http://primerdepot.nci.nih.gov/). Results were normalized to GUSB (beta-glucuronidase enzyme, a housekeeping gene).
Cell Cycle Length, Growth and Morphology following MicroRNA Transfection
HT-29 and HCT-116 cells were transfected with the pre-miRNAs for the three most dysregulated miRNAs along with a negative control. At 48 hrs, cells were pulsed with 1mM of BrdU for 6 hours. Then, using the BD Pharmigen BrdU Flow Kit, the transfected cells were fixed, permeabilized, DNase treated, stained with BrdU antibody, and stained with 7-ADD for total DNA before flow cytometric analysis. Flow cells were gated to include the majority of the “live cells”. Region gates were then used for the quantitative cell cycle analysis of populations that had been stained for incorporated BrdU and total DNA levels. The cell cycle positions and active DNA synthetic activities of cells were determined by analyzing the correlated expression of total DNA and incorporated BrdU levels. Cell-cycle length was measured in both cell lines over 48, 72, and 96 hrs following transfection. Cells were microscopically examined following transfection with the miRNAs of interest and compared to transfection with the negative control.
MicroRNA Transfection and Cell Death Pathways
RNA from transfected cell lines have been studied using custom plates that measure the expression of 88 mRNAs related to apoptosis (Apoptosis plate, SA biosciences™).
Protein studies
TP53 protein level, a potential surrogate marker for apoptosis and a common end-target for the three dysregulated microRNAs of interest (let-7e, miR-17, and miR-122), was assayed using the Protein Ligation Assay (PLA) technique (Life Technologies™, Foster City, CA) following the manufacturer’s protocol (Swartzman et al. 2010).
Statistical analyses
Sample size justification
The cohort is a convenience sample based on the availability of patients at the time of study initiation. This includes all of the patients seen in the clinic who developed cancer, reducing the selection bias. We have used the mixed-model approach as our statistical method in analyzing this group of patients (Digglr PJ, 2002). This method is the same for small or large sample size cohorts because it is an observational study within the same patients. Also, inter-subject variability is minimized in our group because the same subject is used as its own control and biological samples are done in triplicates. Our small sample size and the rarity of the disease studied (IBD-cancer) are not uncommon problems and the use of this statistical method in such a scenario has been previously justified (van der Lee et al., 2008).
Generalizing the sample size formula of Jung to allow for F-statistics, reparameterized Hotelling T2, given the repeated measures context of this study, provides ad hoc justification of drawing inferences from this sample size under the additional context of false discovery rate control (Jung, 2005). The method assumes that the total sample size is small, and the rescaled Ct values are approximately normally distributed. The study has 80% power to detect a maximum of five differentially expressed probes within each time comparison, with a false discovery rate of 10%.
Variable thresholding
Raw threshold count (Ct) data (cycle threshold data obtained from RT-PCR) were imported into the R statistical package for processing (Team RdC, 2005). In order to minimize the number of unread probe expression values or missing values, variable thresholds were applied to each plate as opposed to a fixed experiment-wide threshold. Variable thresholding was used since the fluorescence for each sample across different samples varied due to possible degradation from formalin fixation. Fixed thresholding results in a single threshold were applied to all plates. This increases the number of non-read probe expression values from a location shift of an entire plate’s expression values due to technical error. Variable thresholding not only determines an optimal threshold on a plate-by-plate basis to ensure that a threshold is placed at the minimum of the growth phase of the Ct curve, but also captures some variability due to the experimental setting. To account for the effect of the variable thresholds, a new Ct value was constructed by scaling the raw Ct values by the variable threshold, Yi/jQj where Yij is the raw Ct for the ith miRNA probe on the jth plate and Qj is the variable threshold for the jth plate.
Analysis of our data using the fixed and variable thresholds yielded identical results since miRNA expression is computed by determining differences in expression rather than absolute values (Delta delta Ct method). The purpose of variable thresholding is to reduce the number of imputed or arbitrarily computer-assigned expression Ct values due to low expression. Variable thresholding resulted in a 67% decrease in missing values over the fixed thresholding technique and we believe provides for a more accurate analysis. The remaining missing values were then imputed using the following strategy: if the mean value of non-missing values across the three replicates was statistically different from a value of 35 with p ≤ 0.05 using a t-test, then the mean value of non-missing replicates was used for imputation; otherwise, the imputation value was 35. Ct values greater than 35 were replaced with 35+0 before imputation.
Data normalization
miRNA expression data were then normalized using a two-step process prior to determining differential expression Following the method of Mestdagh et al. (Mestdagh et al., 2009), plates were first normalized using the mean value of all probes expressed (Ct<35) concordantly across technical and biological replicates as opposed to using only a set of housekeeping non-coding RNAs. This method is characterized by high expression stability and has been shown to reduce technical variation as measured through the coefficient of variation of expression values. Application of quantile normalization across all samples resulted in further improvement in the reduction of the coefficient of variation (Pradervand et al., 2009).
Determination of differential expression
Differential expression was determined using the following repeated measures mixed effects model for the ith miRNA probe across all patients:
where µ is the overall mean, Gg is the fixed group effect for g = {CD, UC} groups, Tt is the tissue type for t = {IBD-affected non-neoplasia, dysplasia, cancer}, GTgt is the group by time interaction effect, Sjr is the random within subject, within replicate effect for r = 1,2,3 replicates for the jth plate/patient, and ε is the error term.
The best fit covariance matrix, across all probes, for the model was ARH (1) with heterogeneous variances across time using the AIC (Akaike Information Criterion) criterion (Akaike, 1974). The ARH (autoregressive heterogeneity) (1) covariance model is structured so that the correlation between repeated measurements declines exponentially with time, and each time can have a unique variance (Akaike, 1974). Differences were examined at the group level, between disease groups (UC vs. CD) and between tissue types (non-neoplastic, dysplasia, cancer). To account for multiplicity, the procedure of Benjamini and Hochberg was applied to the raw p-values (Akaike, 1974). Only p-values that met a false discovery rate threshold of 10% after accounting for multiplicity are reported.
Cell line studies
In our colon cancer cell line studies, significance values for messenger RNA (mRNA) fold changes and cell growth changes over 48, 72, and 96 hrs were obtained using a Mann-Whitney U-test. p<0.05 was considered significant.
RESULTS
Combined IBD patient data
In our CD and UC patients, 5 miRNAs were differentially expressed in CRC progression from non-neoplasia to dysplasia to cancer. These were miR-193b, miR-373, let-7e, miR-15b, and miR-372 (p<0.001). All of these miRNAs were significantly down-regulated in the progression from non-neoplastic tissue to dysplasia and from dysplasia to cancer (p<0.001, p-value) (Table 1a and Supp. Figure S1).
Table 1.
| a: Differentially Expressed MicroRNAs for all patients (Ulcerative colitis and Crohn’s disease) | ||||
|---|---|---|---|---|
| Dysregulated microRNA |
p-value* | Fold Change Non-neoplasia to Dysplasia |
Fold Change Non-neoplasia to Cancer |
Fold Change Dysplasia to Cancer |
| miR-193b | 0.0016 | −1.29 | −1.98 | −1.54 |
| miR-373 | 0.0009 | −1.28 | −2.00 | −1.56 |
| let-7e | 0.0001 | −1.16 | −1.87 | −1.61 |
| miR-15b | 0.0012 | −1.17 | −1.89 | −1.62 |
| miR-372 | 0.0018 | −1.20 | −1.96 | −1.63 |
| b: Differentially Expressed MicroRNAs (DEMs) for Crohn’s disease patients | ||||
|---|---|---|---|---|
| Dysregulated microRNA |
p-value* | Fold Change Non-neoplasia to Dysplasia |
Fold Change Non-neoplasia to Cancer |
Fold Change Dysplasia to Cancer |
| miR-122 | 0.0009 | +2.05 | −1.68 | −3.85 |
| miR-181a | 0.0011 | +2.25 | −1.69 | −3.80 |
| miR-146b-5p | 0.0031 | +2.00 | −1.65 | −3.31 |
| let-7e | 0.0003 | +2.29 | −1.52 | −3.49 |
| miR-17 | 0.0052 | +2.22 | −1.61 | −3.56 |
| miR-143 | 0.0024 | +2.03 | −1.74 | −3.53 |
Global p-value calculated for any difference in miRNA dysregulation in the cohort. This p-value was calculated at a False Discovery Rate (FDR) <10%
CD patient data
In the four CD patients, six miRNAs were differentially expressed across all sample types (IBD-affected non-neoplastic tissue, dysplasia, cancer): miR-122, miR-181a, miR-146b-5p, let-7e, miR-17, and miR-143 (Global p<0.001) (Table 1b, Figure 2a). In the progression from non-neoplastic tissue to dysplasia, miR-181a, miR-146b-5p, let-7e, and miR-17 were up-regulated (p<0.05) (Figure 2b), however, let-7e, miR-17, and miR-143 were down-regulated in the progression from dysplasia to cancer (p<0.001) (Figure 2c). RNA quality and quantity was adequate for all patient samples. We confirmed the up-regulation of let-7e and miR-17 from non-neoplastic tissue to dysplasia.
Figure 2.
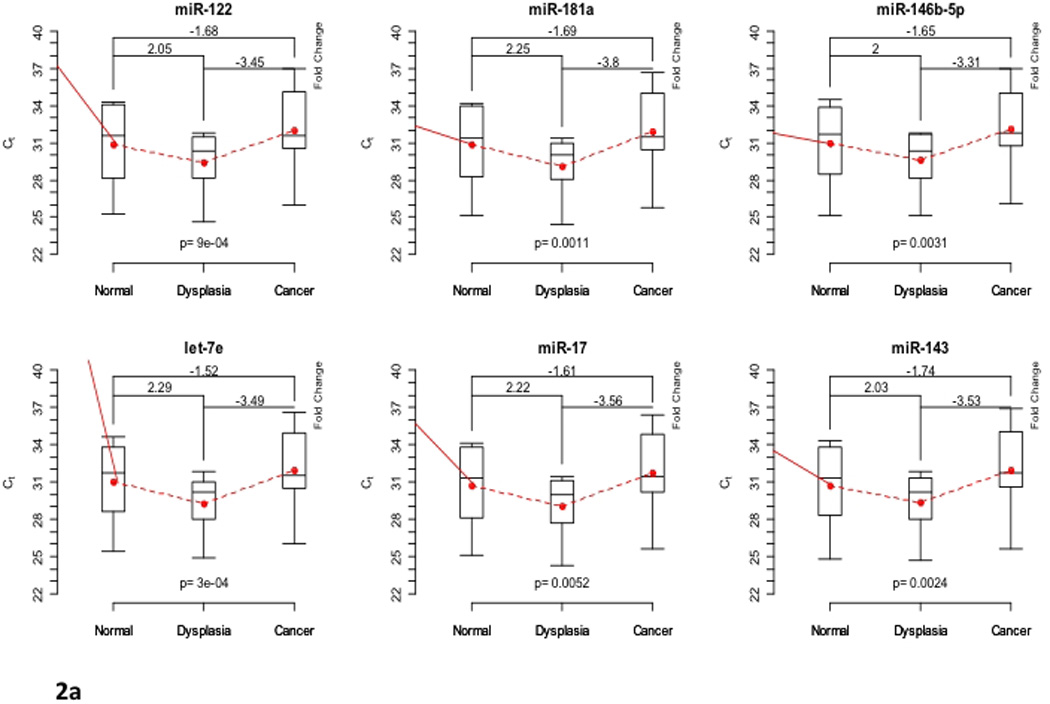

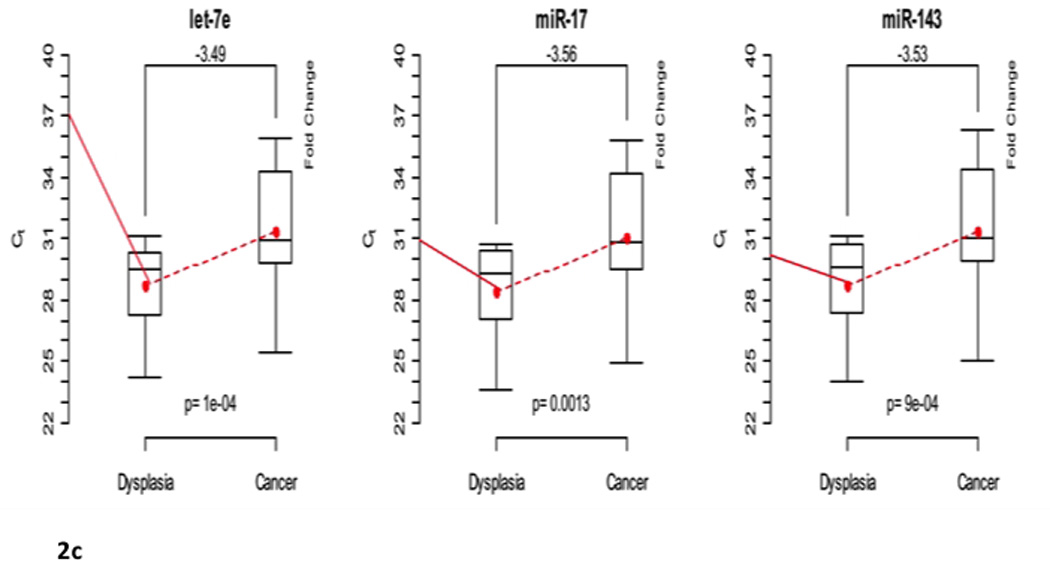
(a). Differentially expressed microRNAs in Crohn disease (CD) patients. Box plots showing the minimum and maximum (ends of the whiskers), the median (band near the middle of the box) and interquartile ranges for four patients. The bottom and top of the box plots represent the 25th and 75th percentile (lower and upper quartiles, respectively); three replicates were used for each sample. Dotted line shows the mean trend over stage across all patients and replicates with corresponding fold changes of raw data expression values. A higher cycle threshold (Ct) value implies a lower miRNA expression; thus, negative fold changes imply down-regulation. The fold changes from non-neoplastic tissue to dysplasia, dysplasia to cancer, and from non-neoplastic tissue to cancer are shown on top of the box plots, respectively. (b). Differentially expressed microRNAs in non-neoplastic tissue to dysplasia in Crohn disease patients. Box plots showing the minimum and maximum (ends of the whiskers), the median (band near the middle of the box) and interquartile ranges for four patients. The bottom and top of the box plots represent the 25th and 75th percentile (lower and upper quartiles, respectively); three replicates were used for each sample. Dotted line shows the mean trend over stage across all patients and replicates with corresponding fold changes of raw data expression values. A higher cycle threshold (Ct) value implies a lower miRNA expression; thus, negative fold changes imply down-regulation. The fold changes from non-neoplastic tissue to dysplasia are shown on top of the box plots, respectively. (c). Differentially expressed microRNAs in dysplasia to cancer in Crohn disease patients. Box plots showing the minimum and maximum (ends of the whiskers), the median (band near the middle of the box) and interquartile ranges for four patients. The bottom and top of the box plots represent the 25th and 75th percentile (lower and upper quartiles, respectively); three replicates were used for each sample. Dotted line shows the mean trend over stage across all patients and replicates with corresponding fold changes of raw data expression values. A higher cycle threshold (Ct) value implies a lower miRNA expression; thus, negative fold changes imply down-regulation. The fold changes from non-neoplastic tissue to dysplasia, dysplasia to cancer, and from non-neoplastic tissue to cancer are shown on top of the box plots, respectively. The fold changes from dysplasia to cancer are shown on top of the box plots, respectively.
Pathway analysis of miRNA data
Using pathway analysis (Ingenuity) to study the effect of dysregulated miRNAs on pathways, we were able to determine that many of the dysregulated miRNAs (let-7e, miR-15b, miR-17, miR-122, miR-214, miR-372) were involved with regulation of transcription factors associated with the TP53 pathway (Table 2, Figure 3a).
Table 2.
Dysregulated miRNAs and effect on p53 pathway
| Targeted Transcription Factors in p53 Pathway |
Net Effect on the p53 Tumor Suppressor Pathway | |||||||
|---|---|---|---|---|---|---|---|---|
| MicroRNA | Change in CRC progression | Target 1 | Target 2 | Target 3 | Target 4 | Net Effect 1 | Net Effect 2 | Net Effect 3 |
| miR-372 | Down-regulation in CRC progression in ALL IBD patients |
P21Cip1 | Not applicable | Promotion of cell cycle progression |
Inhibition of cell cycle arrest |
Not applicable | ||
| miR-17 | Up-regulation from non-neoplasia to dysplasia in CD |
PCAF | SIRT | P63 | E2F1 | Inhibition of cell cycle progression |
Inhibition of cell cycle arrest |
Inhibition of apoptosis |
| let-7e | Up-regulation from non-neoplasia to dysplasia in CD |
E2F1 | Not applicable | Inhibition of apoptosis | Not applicable | |||
| miR-122 | Up-regulation from non-neoplasia to dysplasia in CD |
GSK-3B | Beta- catenin |
Cyclin G | N/A | Inhibition of cell cycle arrest |
Not applicable | |
| miR-214 | Up-regulation in UC cancer vs. CD cancer |
PTEN | Not applicable | Inhibition of tumor suppression |
Not applicable | |||
| miR-15b | Down-regulation in CD cancer vs. UC cancer |
BCL2 | Not applicable | Promotion of cell survival | Not applicable | |||
The above listed microRNAs are found to be significantly dysregulated (p<0.001) and with FDR <0.10
Figure 3.
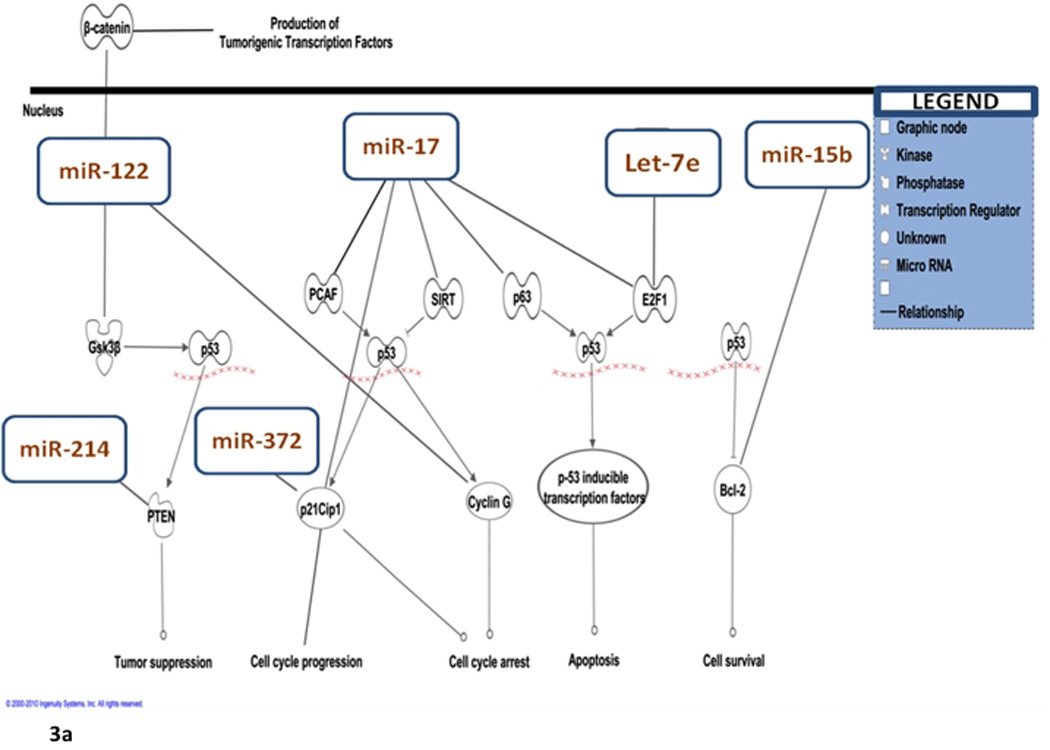

(a). Differentially expressed microRNAs in relation to theTP53 pathway with permission from Ingenuity Pathway Analysis™, IPA 8.0, Redwood city, CA. (b).The tumorigenic effect of up-regulated miR-17 and let-7e on the TP53 pathway.
Pathway analysis: CD-progression from non-neoplasia to dysplasia
We identified unique miRNAs that are differentially expressed in CD-associated CRC-progression. In CD patients, while let-7e and miR-17 were up-regulated in the progression from non-neoplastic tissue to dysplasia, it was down-regulated in the progression from dysplasia to cancer. The let-7 family is comprised of 14 isomers, many of which are dysregulated in CRC (Yang et al., 2009). In colon cancer cell lines, transfection with let-7 precursor results in decreased RAS (MIM# 190020) and MYC (MIM# 190080) protein expression (Yang et al., 2009). After employing pathway analysis to study the effects on the TP53 pathway, let-7e is predicted to interact with casein-kinase1 (CSNK1A1; MIM# 600505) and E2F transcription factor-1 (E2F1; MIM# 189971) within the TP53 pathway. In the progression from non-neoplasia to dysplasia, up-regulation of let-7e would lead to decreased levels of CK1 and E2F1 and as an end result, would lead to decreased apoptosis and decreased cell-cycle arrest (Figure 3b).
According to pathway analysis, miR-17 is predicted to interact with the following transcription factors in the TP53 pathway: K(lysine) acetyl-transferase 2B (PCAF or KAT2B; MIM# 602303), sirtuin (silent mating type information regulation 2 homolog) 1 (SIRT1; MIM# 604479), cyclin-dependent kinase inhibitor 1A (CDKN1A; MIM# 116899), tumor protein p63 (P63; MIM# 603273), and E2F1. miR-17 up-regulation would therefore eventually lead to down-regulation of these transcription factors, thus promoting tumorigenesis through inhibition of apoptosis and cell-cycle arrest (Figure 3b). The net molecular effect of up-regulated let-7e and miR-17 fits nicely with the clinically observed neoplastic progression to dysplasia. This supports our hypothesis regarding the role of inflammation in carcinogenesis in inflammatory bowel disease. Down-regulation, however, from dysplasia to cancer as seen for let-7e and miR-17 could be a possible salvage mechanism by which affected cells attempt to reverse tumorigenesis. A previous gene expression study we performed using fresh-frozen tissue in UC-associated colorectal cancer also showed different patterns of expression from non-neoplasia to dysplasia as compared to dysplasia to cancer (Colliver et al., 2006). Furthermore, in that analysis, comparison with genes differentially expressed in sporadic CRC showed only 9% to be differentially expressed in ulcerative colitis-associated colorectal cancer. This is to highlight the fact that IBD-a CRC progression might behave unexpectedly and changes can be very different from sporadic CRC.
We also found miRNA-146b-5p and miR-181a in our analysis to be specifically up-regulated in the progression from non-neoplasia to dysplasia in CD patients. miR-181a has been described to be over-expressed in TP53 null cells (Yang et al., 2009).
Pathway analysis: CD-progression from dysplasia to cancer
In CD progression from dysplasia to cancer, three miRNAs were down-regulated: miR-17, let-7e, and miR-143. Let-7e and miR-17 down-regulation in the progression from dysplasia to cancer would lead to maintenance of TP53 function and less tumorigenesis (Figure 3a). This could be a possible salvaging mechanism through feedback employed by dysplastic cells to prevent further tumor progression.
Determination of the tumorigenic effect of miRNA dysregulation on the TP53 signaling pathway
Cell-cycle length, growth and morphology following the transfections
There was no change in cell-cycle length following transfection with the let-7e, miR-17, or miR-122 (Supp. Tables S2 & S3). We completed growth curves for both HT-29 and HCT-116 following transfection with let-7e, miR-17, miR-122, and a negative control at 48, 72, and 96 hrs. Cell growth increased significantly in both cell lines following all transfections at 48 hrs (p<0.05) (Supp. Figures S2 & S3). No change in the cell morphology was observed (Supp. Figures S4 & S5).
miRNA affect cell death pathways in these cells such as apoptosis
RNA from transfected cell lines have been studied using custom plates that measure the expression of 88 mRNAs related to apoptosis (Apoptosis plate, SA biosciences™). No alterations in gene expression in cell death pathways were observed as compared to negative control transfections.
mRNA target studies following the transfection of colon cancer cell lines
In our colon cancer studies, E2F1, an upstream regulator of TP53, was down-regulated in both HT-29 and HCT-116 cells transfected with let-7e, as well as HCT-116 cells transfected with miR-17. Additionally, CCNG1 (MIM# 601578), a cell cycle regulator and miR-122 target, was significantly down-regulated in both cell lines (Table 3).
Table 3.
Target mRNA expression in miRNA transfected colon cancer cell lines
| Transfected MicroRNA |
Average Fold Change of 3 different transfections when compared to Negative Control in HT-29 cell line |
Average Fold Change of 3 different transfections when compared to Negative Control in HCT-116 cell line |
Target mRNA |
Fold Change in HT-29 Cells (p-value)* |
Fold Change in HCT-116 Cells (p-value)* |
|---|---|---|---|---|---|
| Let-7e | 490× | 560× | E2F1 | 0.82 (0.0248) | 0.63 (0.0248) |
| miR-17 | 57× | 86× | SIRT1 | 1.10 (0.138) | 0.88 (0.138) |
| PCAF | 1.12 (0.063) | 1.38 (0.0248) | |||
| TP53 | 1.12 (0.138) | 1.06 (0.256) | |||
| E2F1 | 0.72 (0.049) | 0.89 (0.138) | |||
| miR-122 | 180× | 220× | CCNG1 | 0.72 (0.0248) | 0.55 (0.0248) |
p-value calculated using the Mann-Whitney U-test, p<0.05 is significant (Italicized). Fold Change <1 is a down-regulation while fold change >1 is an up-regulation
p53 protein studies in transfected colon cancer cell lines
p53 protein was down-regulated by 2.5 and 2.2 folds following transfection of HT-29 sporadic colon cancer cell line with let-7e and miR-122 respectively (as compared to negative control transfection). No change in p53 expression levels was noted following miR-17 transfection. Following the transfection of HCT-116 colon cancer cell line with miR-17, let-7e, and miR-122, p53 protein levels were down-regulated by 3 folds following miR-122 transfection (as compared to negative control transfection).
DISCUSSION
IBD-CRC: CRC surveillance and the current challenges
IBD-CRC development is an increasingly significant health concern in the Western world with the incidence of both UC and CD being on the rise (Judge et al., 2002; Rhodes and Campbell, 2002b). CD patients with small bowel involvement are at higher risk for small intestinal cancer (Ekbom et al., 1990), while patients with Crohn colitis have a 5.6 relative risk of developing CRC (Ekbom et al., 1990). Similarly, UC patients are up to 30-fold more likely to develop CRC and are three times more likely than the general population to die from it (Viscido et al., 2001). The risk for UC-associated cancer is increased with both disease duration and the extent of disease (Colliver et al., 2006).
There are conflicting data as to whether patients with IBD-a CRC have a worse prognosis as compared to patients with sporadic CRC. Patients whose CRC is diagnosed after they have developed symptoms (such as abdominal pain or bleeding) appear to have a worse prognosis than those detected during surveillance (Choi et al., 1993). There is evidence that cancers tend to be detected at earlier stages with surveillance as well as indirect evidence that surveillance is effective at reducing the risk of death from IBD-a CRC and is cost-effective (Collins et al., 2006). Clinically, IBD-dysplasia is often difficult to diagnose because of the chronic regeneration and repair associated with chronic inflammation, as well as the fact that IBD-a CRC-formation can occur in areas of flat dysplasia or as dysplasia-associated lesions (DALMs). It may be difficult to distinguish such lesions from surrounding inflamed colonic mucosa endoscopically. In addition, there are other limitations of surveillance including: inter-pathologist variability, variations in endoscopy and biopsy techniques, and patient compliance. The optimal surveillance modality remains controversial (Colliver et al., 2006).
miRNAs and sporadic CRC
Due to the limitations of current surveillance strategies based on histologic detection of dysplasia, newer techniques involving the detection of alterations in mucosal antigens and genetic abnormalities have been investigated (Burmer et al., 1992; Lofberg et al., 1992). Recently, differentially expressed miRNAs have been proposed to aid in the diagnosis of solid tumors, to help determine patient prognosis, and even pose novel molecular targets for cancer treatment. Currently, over 100 miRNAs are implicated in the development of sporadic CRC. Michael et al. (Burmer et al., 1992; Michael et al., 2003) identified miR-143 and miR-145 as potential factors in colon tumorigenesis, while Akao et al. (Akao et al., 2006) reported down-regulation of the let-7 miRNA family in CRC and in colon cancer cell lines. On the other hand, some miRNAs could be up-regulated in CRC tumors (Wu et al., 2008). Using RT-PCR and microarray analysis, Xi et al. (Xi et al., 2006) demonstrated elevated levels of miR-31, miR-96, miR-135b, and miR-183 in CRC. They also have found that cells exhibiting miRNA up-regulation also harbored oncogenic mutations of either KRAS (MIM# 190070, also known as rat sarcoma viral oncogene homolog) or BRAF (MIM# 164757, also known as B-Raf proto-oncogene serine/threonine-protein kinase) (Xi et al., 2006). To our knowledge, studies focusing on miRNA dysregulation in sporadic CRC have not examined miRNA dysregulation in IBD-a CRC.
miRNAs and IBD-a CRC
In our study, let-7e, miR-17, and miR-122 were highly dysregulated in IBD-a neoplasia. These findings support the current literature describing dysregulation of many of the let-7 family members in CRC (Yang et al., 2009). In colon cancer cell lines, transfection with let-7 precursor causes reduced cell growth and decreased RAS and MYC protein expression (Yang et al., 2009). Let-7e, miR-17, and miR-122 target specific transcription factors in the TP53 pathway that leads to tumorigenesis. Using two colon cancer cell lines transfected with these miRNAs, we were able to show their respective mRNA targets to be significantly down-regulated.
To the best of our knowledge, our study is the first to identify differential expression of miRNAs in IBD patients who developed invasive CRCs. We were able to identify these alterations in miRNA expression in specific isolated cell populations using laser capture microdissection. We also verified the tumorigenic effect of differentially expressed miRNAs on the TP53 pathway using human colon cancer cell lines. The significance of the miRNAs found in our study lies not only in their function with cancer progression, but also with their differential levels of expression.
Although small in number, our patients were carefully selected. A major problem with IBD is the need for potent and wide use of immunosuppressive therapy to control symptoms. Such therapy affects gene expression and would likely affect miRNA expression as well. Prior reports on IBD malignancy seldom specify details regarding patient therapy. We believe that these are probably the only immunotherapy-naive cancer patients so examined. Information thereby gained from them is likely unique, despite the small sample. Biologic variability is minimized as progression from non-neoplastic tissue to dysplasia to cancer was studied within the same IBD patients who were clinically well defined and who had clinical follow-up for more than 10 years.
In conclusion, our future studies will be designed to identify specific miRNA biomarkers that can be used in this patient population to develop a minimally invasive, low cost, screening tool for IBD-a CRC. We believe that understanding the mechanisms by which chronic inflammation contributes to the genetic and epigenetic changes involved in the regulation of critical cell cycle checkpoints and DNA repair will enable the development of improved diagnostic modalities and therapeutic interventions. In addition, continued investigations need to determine the role that these miRNAs might have on new potential targets for diagnosis, prognosis, and therapy of IBD-a CRCs.
Supplementary Material
ACKNOWLEDGMENTS
Funding: This publication is made possible in part by the John W. and Caroline Price Family Trust, a gift from Ms. Sara Shallenberger Brown, and NIH/NIEHS grant 1P30ES014443-01A1 to The Center for Environmental Genomics and Integrative Biology (CEGIB). Dr. Shesh Rai was partly supported by the Wendell Cherry Chair –James Graham Brown Cancer Center, University of Louisville.
Footnotes
Supporting Information for this preprint is available from the Human Mutation editorial office upon request (humu@wiley.com)
Author Contributions
Study concept and design: SG, ZK, MRE
Acquisition of data: CW, EC, BK, HR, AD
Analysis and interpretation of data: ZK, MRE, CB, SNR, REP
Drafting of the manuscript: ZK, SG, NC, MRE, CB
Statistical analysis: CB, SNR
Critical revision of the manuscript for intellectual content: ZK, SG
Study supervision: SG
Conflict of Interests Disclosure
None of the authors have any financial or other conflicts of interest to disclose. In addition, all authors have seen and approved the final version of this manuscript for submission.
REFERENCES
- Akaike H. A new look at the statistical model identification. IEEE Transactions on Automatic Control. 1974;19:716–723. [Google Scholar]
- Akao Y, Nakagawa Y, Naoe T. let-7 microRNA functions as a potential growth suppressor in human colon cancer cells. Biol Pharm Bull. 2006;29:903–906. doi: 10.1248/bpb.29.903. [DOI] [PubMed] [Google Scholar]
- Bernstein CN, Blanchard JF, Kliewer E, Wajda A. Cancer risk in patients with inflammatory bowel disease: a population-based study. Cancer. 2001;91:854–862. doi: 10.1002/1097-0142(20010215)91:4<854::aid-cncr1073>3.0.co;2-z. [DOI] [PubMed] [Google Scholar]
- Broome U, Lofberg R, Veress B, Eriksson LS. Primary sclerosing cholangitis andulcerative colitis: evidence for increased neoplastic potential. Hepatology. 1995;22:1404–1408. doi: 10.1002/hep.1840220511. [DOI] [PubMed] [Google Scholar]
- Bruwer M, Schmid KW, Senninger N, Schurmann G. Immunohistochemical expression of P53 and oncogenes in ulcerative colitis-associated colorectal carcinoma. World J Surg. 2002;26:390–396. doi: 10.1007/s00268-001-0237-7. [DOI] [PubMed] [Google Scholar]
- Burmer GC, Rabinovitch PS, Haggitt RC, Crispin DA, Brentnall TA, Kolli VR, Stevens AC, Rubin CE. Neoplastic progression in ulcerative colitis: histology, DNA content, and loss of a p53 allele. Gastroenterology. 1992;103:1602–1610. doi: 10.1016/0016-5085(92)91184-6. [DOI] [PubMed] [Google Scholar]
- Choi PM, Nugent FW, Schoetz DJ, Jr, Silverman ML, Haggitt RC. Colonoscopic surveillance reduces mortality from colorectal cancer in ulcerative colitis. Gastroenterology. 1993;105:418–424. doi: 10.1016/0016-5085(93)90715-o. [DOI] [PubMed] [Google Scholar]
- Collins PD, Mpofu C, Watson AJ, Rhodes JM. Strategies for detecting colon cancerand/or dysplasia in patients with inflammatory bowel disease. Cochrane Database Syst Rev. 2006:CD000279. doi: 10.1002/14651858.CD000279.pub3. [DOI] [PubMed] [Google Scholar]
- Colliver DW, Crawford NP, Eichenberger MR, Zacharius W, Petras RE, Stromberg AJ, Galandiuk S. Molecular profiling of ulcerative colitis-associated neoplastic progression. Exp Mol Pathol. 2006;80:1–10. doi: 10.1016/j.yexmp.2005.09.008. [DOI] [PubMed] [Google Scholar]
- Digglr PJ, Heagerty P, Liang KY, Zeger SL. Analysis of Longitudinal Data. 2nd edition. Oxford Press; 2002. [Google Scholar]
- Ekbom A, Helmick C, Zack M, Adami HO. Increased risk of large-bowel cancer in Crohn's disease with colonic involvement. Lancet. 1990;336:357–359. doi: 10.1016/0140-6736(90)91889-i. [DOI] [PubMed] [Google Scholar]
- Feagins LA, Souza RF, Spechler SJ. Carcinogenesis in IBD: potential targets for the prevention of colorectal cancer. Nat Rev Gastroenterol Hepatol. 2009;6:297–305. doi: 10.1038/nrgastro.2009.44. [DOI] [PubMed] [Google Scholar]
- Galiveti CR, Rozhdestvensky TS, Brosius J, Lehrach H, Konthur Z. Application of housekeeping npcRNAs for quantitative expression analysis of human transcriptome by real-time PCR. RNA. 2010;16:450–461. doi: 10.1261/rna.1755810. [DOI] [PMC free article] [PubMed] [Google Scholar]
- Gillen CD, Walmsley RS, Prior P, Andrews HA, Allan RN. Ulcerative colitis and Crohn's disease: a comparison of the colorectal cancer risk in extensive colitis. Gut. 1994;35:1590–1592. doi: 10.1136/gut.35.11.1590. [DOI] [PMC free article] [PubMed] [Google Scholar]
- Greenstein AJ. Cancer in inflammatory bowel disease. Mt Sinai J Med. 2000;67:227–240. [PubMed] [Google Scholar]
- Greenstein AJ, Sachar DB, Smith H, Janowitz HD, Aufses AH., Jr A comparison of cancer risk in Crohn's disease and ulcerative colitis. Cancer. 1981;48:2742–2745. doi: 10.1002/1097-0142(19811215)48:12<2742::aid-cncr2820481231>3.0.co;2-p. [DOI] [PubMed] [Google Scholar]
- Gyde SN, Prior P, Macartney JC, Thompson H, Waterhouse JA, Allan RN. Malignancy in Crohn's disease. Gut. 1980;21:1024–1029. doi: 10.1136/gut.21.12.1024. [DOI] [PMC free article] [PubMed] [Google Scholar]
- Holzmann K, Klump B, Borchard F, Hsieh CJ, Kuhn A, Gaco V, Gregor M, Porschen R. Comparative analysis of histology, DNA content, p53 and Ki-ras mutations in colectomy specimens with long-standing ulcerative colitis. Int J Cancer. 1998;76:1–6. doi: 10.1002/(sici)1097-0215(19980330)76:1<1::aid-ijc1>3.0.co;2-4. [DOI] [PubMed] [Google Scholar]
- Hugot JP, Zouali H, Lesage S, Thomas G. Etiology of the inflammatory bowel diseases. Int J Colorectal Dis. 1999;14:2–9. doi: 10.1007/s003840050175. [DOI] [PubMed] [Google Scholar]
- Ingenuity Pathway Analysis Website (Help Manual) [Accessed on March, 2010];
- Judge TA, Lewis JD, Lichtenstein GR. Colonic dysplasia and cancer in inflammatory bowel disease. Gastrointest Endosc Clin N Am. 2002;12:495–523. doi: 10.1016/s1052-5157(02)00014-4. [DOI] [PubMed] [Google Scholar]
- Jung SH. Sample size for FDR-control in microarray data analysis. Bioinformatics. 2005;21:3097–3104. doi: 10.1093/bioinformatics/bti456. [DOI] [PubMed] [Google Scholar]
- Kraus S, Arber N. Inflammation and colorectal cancer. Curr Opin Pharmacol. 2009;9:405–410. doi: 10.1016/j.coph.2009.06.006. [DOI] [PubMed] [Google Scholar]
- Lakatos PL. Recent trends in the epidemiology of inflammatory bowel diseases: up or down? World J Gastroenterol. 2006;12:6102–6108. doi: 10.3748/wjg.v12.i38.6102. [DOI] [PMC free article] [PubMed] [Google Scholar]
- Lofberg R, Brostrom O, Karlen P, Ost A, Tribukait B. DNA aneuploidy in ulcerative colitis: reproducibility, topographic distribution, and relation to dysplasia. Gastroenterology. 1992;102:1149–1154. [PubMed] [Google Scholar]
- Loftus EV, Jr, Sandborn WJ. Epidemiology of inflammatory bowel disease. Gastroenterol Clin North Am. 2002;31:1–20. doi: 10.1016/s0889-8553(01)00002-4. [DOI] [PubMed] [Google Scholar]
- Mestdagh P, Van VP, De WA, Muth D, Westermann F, Speleman F, Vandesompele J. A novel and universal method for microRNA RT-qPCR data normalization. Genome Biol. 2009;10:R64. doi: 10.1186/gb-2009-10-6-r64. [DOI] [PMC free article] [PubMed] [Google Scholar]
- Michael MZ, O'Connor SM, van Holst Pellekaan NG, Young GP, James RJ. Reduced accumulation of specific microRNAs in colorectal neoplasia. Mol Cancer Res. 2003;1:882–891. [PubMed] [Google Scholar]
- Pradervand S, Weber J, Thomas J, Bueno M, Wirapati P, Lefort K, Dotto GP, Harshman K. Impact of normalization on miRNA microarray expression profiling. RNA. 2009;15:493–501. doi: 10.1261/rna.1295509. [DOI] [PMC free article] [PubMed] [Google Scholar]
- Rhodes JM, Campbell BJ. Inflammation and colorectal cancer: IBD-associated and sporadic cancer compared. Trends Mol Med. 2002a;8:10–16. doi: 10.1016/s1471-4914(01)02194-3. [DOI] [PubMed] [Google Scholar]
- Rhodes JM, Campbell BJ. Inflammation and colorectal cancer: IBD-associated and sporadic cancer compared. Trends Mol Med. 2002b;8:10–16. doi: 10.1016/s1471-4914(01)02194-3. [DOI] [PubMed] [Google Scholar]
- Riddell RH, Goldman H, Ransohoff DF, Appelman HD, Fenoglio CM, Haggitt RC, Ahren C, Correa P, Hamilton SR, Morson BC. Dysplasia in inflammatory bowel disease: standardized classification with provisional clinical applications. Hum Pathol. 1983;14:931–968. doi: 10.1016/s0046-8177(83)80175-0. [DOI] [PubMed] [Google Scholar]
- SA biosciences™ Website (Help Manual) [Accessed on January, 2010]; www.sabiosciences.com.
- Sato A, MacHinami R. p53 immunohistochemistry of ulcerative colitis-associated with dysplasia and carcinoma. Pathol Int. 1999;49:858–868. doi: 10.1046/j.1440-1827.1999.00965.x. [DOI] [PubMed] [Google Scholar]
- Swartzman E, Shannon M, Lieu P, Chen SM, Mooney C, Wei E, Kuykendall J, Tan R, Settineri T, Egry L, Ruff D. Expanding applications of protein analysis using proximity ligation and qPCR. Methods. 2010;50(4):S23–S26. doi: 10.1016/j.ymeth.2010.01.024. [DOI] [PubMed] [Google Scholar]
- Team RdC . In: R: A language and environment for statistical computing. Computing RFfS, editor. Vienna: 2005. [Google Scholar]
- van der Lee JH, Wesseling J, Tanck MW, Offringa M. Efficient ways exist to obtain the optimal sample size in clinical trials in rare diseases. J Clin Epidemiol. 2008;61:324–330. doi: 10.1016/j.jclinepi.2007.07.008. [DOI] [PubMed] [Google Scholar]
- Viscido A, Bagnardi V, Sturniolo GC, Annese V, Frieri G, D'Arienzo A, Papi C, Riegler G, Corrao G, Caprilli R. Survival and causes of death in Italian patients with ulcerative colitis. A GISC nationwide study. Dig Liver Dis. 2001;33:686–692. doi: 10.1016/s1590-8658(01)80046-3. [DOI] [PubMed] [Google Scholar]
- Warren Wd, Restrepo Je, Respess Jc, Muller Wh. The importance of hemodynamic studies in management of portal hypertension. Ann Surg. 1963;158:387–404. doi: 10.1097/00000658-196309000-00008. [DOI] [PMC free article] [PubMed] [Google Scholar]
- Weedon DD, Shorter RG, Ilstrup DM, Huizenga KA, Taylor WF. Crohn's disease and cancer. N Engl J Med. 1973;289:1099–1103. doi: 10.1056/NEJM197311222892101. [DOI] [PubMed] [Google Scholar]
- Wu M, Jolicoeur N, Li Z, Zhang L, Fortin Y, L'Abbe D, Yu Z, Shen SH. Genetic variations of microRNAs in human cancer and their effects on the expression of miRNAs. Carcinogenesis. 2008;29:1710–1716. doi: 10.1093/carcin/bgn073. [DOI] [PubMed] [Google Scholar]
- Xi Y, Shalgi R, Fodstad O, Pilpel Y, Ju J. Differentially regulated micro-RNAs and actively translated messenger RNA transcripts by tumor suppressor p53 in colon cancer. Clin Cancer Res. 2006;12:2014–2024. doi: 10.1158/1078-0432.CCR-05-1853. [DOI] [PubMed] [Google Scholar]
- Yang L, Belaguli N, Berger DH. MicroRNA and colorectal cancer. World J Surg. 2009;33:638–646. doi: 10.1007/s00268-008-9865-5. [DOI] [PubMed] [Google Scholar]
Associated Data
This section collects any data citations, data availability statements, or supplementary materials included in this article.