

Abstract
In vivo detection of transplanted stem cells is requisite for improving stem cell-based treatments by developing a thorough understanding of their therapeutic mechanisms. MRI tracking of magnetically labeled cells is non-invasive and is suitable for longitudinal studies. Molday ION Rhodamine-B™ (MIRB) is a new superparamagnetic iron oxide (SPIO) contrast agent specifically formulated for cell labeling and is readily internalized by non-phagocytic cells. This investigation characterizes mesenchymal stem cell (MSC) labeling and MR imaging properties of this new SPIO agent. Effects of MIRB on MSC viability and differentiation as well as cellular loading properties were assessed for MSC labeled with MIRB at concentrations from 5 to 100 μg Fe/ml. Labeled MSC were evaluated, in vitro, on a clinical 1.5 T MRI. Optimal scanning sequences and imaging parameters were determined based on contrast-to-noise ratio and contrast modulation. Relaxation rates (1/T2*) for gradient-echo sequences were approximated and an idealized limit of detection was established. MIRB labeling did not affect MSC viability or the ability to differentiate into either bone or fat. Labeling efficiency was found to be approximately 95% for labeling concentrations at or above 20 μg Fe/ml. Average MIRB per MSC ranged from 0.7 pg Fe for labeling MIRB concentration of 5 μg Fe/ml and asymptotically approached a value of 20–25 pg Fe/MSC as labeling concentration increased to 100 μg Fe/ml. MRI analysis of MIRB MSC revealed long echo time, gradient echo sequences to provide the most sensitivity. Limit of detection for gradient echo sequences was determined to be less than 1000 MSC, with approximately 15 pg Fe/MSC (labeled at 20μg Fe/ml). These investigations have laid the groundwork and established feasibility for the use of this contrast agent for in vivo MRI detection of MSC. Properties evaluated in this study will be used as a reference for tracking labeled MSC for in vivo studies.
Keywords: super paramagnetic iron oxide, mesenchymal stem cells, MRI, Molday ION Rh-B, nonhuman primate
1. INTRODUCTION
Paralleling the growth in applications for stem cell therapy is the increased demand for the development and refinement of methods for their post-transplant in vivo detection (1–6). MR imaging has emerged as one of the leading modalities for the tracking of transplanted stem cells (4,7–15). The advantages of MRI are that it is non-invasive, does not deposit ionizing energy and is suitable for longitudinal studies (15–17). In order to distinguish specific cells using MRI, those cells must be labeled with a magnetic contrast agent. Currently, the most thoroughly characterized agent, Feridex (Bayer HealthCare Pharmaceuticals Inc., Wayne, NJ, USA), an FDA approved super paramagnetic iron oxide (SPIO) contrast agent for liver imaging, is no longer available (7,15,18–23). Molday ION Rhodamine-B ™ (MIRB) from Biopal (Worcester, MA, USA) is a new SPIO contrast agent specifically formulated for cell labeling applications. MIRB has magnetic core and hydrodynamic sizes of roughly 8 and 35 nm, respectively, a Zeta value of −31 mV (available from: http://www.biopal.com/Molday%20ION.htm), is conjugated to Rhodamine-B (Rh-B) (2 flourophores per particle) and can be visualized by both MRI and fluorescence microscopy. The Rh-B excitation wavelength is 555 nm and the emission wavelength is 565–620 nm.
In this investigation, we qualitatively and quantitatively characterized the labeling and loading properties of MIRB on nonhuman primate (NHP) mesenchymal stem cells (MSC), including average internalized Fe/MSC at various labeling concentrations as well as the effect of intracellular MIRB on the viability, proliferative capacity and functionality of MSC. We performed a comprehensive evaluation of the in vitro MR properties of MIRB labeled MSC describing relaxivity measurements, determination of an optimized imaging sequence and idealized limits of detection on a clinical 1.5 T Siemens Symphony MRI unit. These studies lay the groundwork and provide proof of principle for future applications of a new SPIO contrast agent for cell labeling and in vivo MRI detection.
2. METHODS
2.1. Cell culture
MSC isolation and expansion was achieved by collecting mononuclear cells from the interface of heparinized bone marrow aspirate from the iliac crest of cynomolgus monkey (Macaca fascicularis) using 1.077 g/ml Ficoll Paque Plus. Cells were plated at a density of 5 × 10⁷ cells per 185 cm2 Nunclon Delta Solo flask (VWR, West Chester, PA, USA) in MSC culture media consisting of minimum essential medium alpha media (Invitrogen) (24) supplemented with 20% fetal bovine serum (Hyclone, Logan, UT, USA), 1% penicillin–streptomycin (Invitrogen, Carlsbad, CA, USA) and 1% L-glutamine (Mediatech, Manassas, VA, USA). The cells were kept in culture at 37°C, 5% CO2 with two media changes weekly. Once cells reached 70% confluency, adherent MSC were harvested using 0.25% Trypsin-EDTA (Invitrogen) (37°C for 5 min). The subsequent passages were plated at a concentration of 1 × 10⁶ cells per 185 cm2 Nunclon Delta Solo flask to obtain passage 3 (P3), which has been previously demonstrated to be negative for leukocyte markers and positive for MSC associated antigens, capable of differentiating to fat and bone and obtainable in large numbers (25).
2.2. Cell labeling
MSC (P3), grown to 70–80% confluency, were incubated overnight (~ 20 h at 37°C, 5% CO2) in 20 ml culture media with MIRB added at each of the following concentrations (in μg Fe/ml): 0, 5, 10, 20, 30, 40, 50, 60, 80 and 100. After incubation, the MIRB-culture media solution was removed by aspiration and MSC were washed twice with PBS to remove extracellular MIRB. MIRB-labeled MSC were then harvested with trypsin to remove adherent cells and manually counted on a hemacytometer. Counted MSC were centrifuged (10 min at 1500 rpm, 23°C) and re-suspended in PBS at various concentrations for use in either phantom sample preparation or for MSC loading and viability studies. Control cells were processed identically to MIRB MSC, except that MIRB was not added to culture media during overnight incubation.
2.3. MIRB MSC loading characterization
Loading properties of MIRB for NHP MSC were evaluated qualitatively, for intracellular MIRB localization and distribution, as well as quantitatively, for labeling efficiency and average MIRB (in pg Fe) per MSC. These properties were evaluated at each of the labeling concentrations of MIRB described above.
2.3.1. Intracellular distribution
For qualitative loading property evaluation, light and fluorescence microscopy were employed. MIRB MSC samples were cultured on cover slips and stained with Prussian Blue (Prussian Blue kit from Biopal) to evaluate for intracellular Fe presence and distribution with light microscopy.
In order to further assess intracellular distribution as well as to evaluate effect of cell harvesting with trypsin on intracellular concentration, both adherent and harvested suspensions of MIRB MSC were then evaluated under fluorescence, accomplished with a Zeiss Axiovert 200 inverted microscope. Fluorescent images were compared directly with the same images acquired with light microscopy to confirm intracellular distribution and localization.
2.3.2. Labeling efficiency
Labeling efficiency, expressed as percentage of MIRB labeled MSC, was assessed by flow cytometry. Cells were evaluated for presence of Rh-B, which indicated MIRB presence within the cell.
2.3.3. Fe uptake quantification
Average cellular MIRB uptake was determined via a colorimetric Fe assay (26,27). Labeled MSC were counted and re-suspended in 200 μl PBS. A 200 μl HCl (10 M) aliquot was then added to cell suspensions. Solution was left for overnight (8–12 h) incubation to lyse cells and to reduce iron to Fe3+. A 400 μl aliquot of ferrocyanide was then added and allowed to sit, protected from light, overnight (8–12 h). Solution was pipetted as quadruplicates in volumes of 200 μl into a clear 96-well plate. Absorbance was read with a Spectramax spectrometer at 700 nm. Sample absorbance values were corrected for non-MIRB absorbance by subtracting absorbance value of unlabeled MSC. Average total iron per well was then determined from absorbance by mapping onto standard Fe vs absorbance curve generated by measuring absorbance at 700 nm for solutions similarly prepared with known amounts of MIRB. Total Fe per MSC was calculated by dividing total Fe per well by counted MSC per well. Data from six labeling experiments were averaged to establish a MIRB MSC loading curve.
2.4. MIRB MSC viability and differentiation and proliferative capacity
To verify that MIRB labeling does not adversely affect MSC viability or functional and proliferative capacities, labeled and control cells from the same preparation were evaluated for cell surface antigens and viability (via flow cytometry), proliferative capacity (as fold expansion), gene expression (Taqman™ PCR) and ability to differentiate into fat and bone (22,25).
2.4.1. Flow cytometry analyses
MSC were treated with 0.25% trypsin–EDTA, harvested and washed with flow cytometry buffer (FCB) consisting of 1% BSA and 0.1% sodium azide (Sigma, St Louis, MO, USA) in phosphate buffered saline (Invitrogen). Approximately 105 cells were incubated at 4°C for 20 min with fluorophore conjugated monoclonal antibodies specific for CD29, 7AAD (Beckman Coulter, Fullerton, CA, USA), CD45, HLA Class I (BD PharMingen, San Diego, CA, USA) and CD31 (Ebioscience, San Diego, CA, USA). The appropriate conjugated isotype controls were used for comparison. Afterwards, the cells were washed with FCB and re-suspended in FCB containing 1% neutral buffered formalin (VWR, West Chester, PA, USA). Cells were evaluated on a Cytomics FC500 (Beckman Coulter, Miami, FL, USA). Viability was assessed as percentage of MSC negative for 7AAD.
2.4.2. Phenotype
MSC labeled at both 10 and 20 μg Fe/ml were compared, via flow cytometry, for the presence of cell surface markers characteristic of MSC, CD 29 and Class I MHC as well as the absence of cell surface markers typical of lymphocytic and heamatopoetic cells, CD 45 and CD 31.
2.4.3. Proliferative capacity
Proliferative capacity was assessed as relative fold expansion for MSC labeled with MIRB vs control unlabeled MSC. Both labeled and control cells were counted and plated. After a culture period of 4 days, cells were harvested and recounted to determine fold expansion.
2.4.4. Gene expression
To assess the effect of MIRB on MSC functional capacity, gene expression profiles of labeled and control MSC were compared for HGF, Galectin, IL-6, IL-10, VEGF and TGF-β (Taqman™ PCR), which have been identified as important mediators of MSC immunomodulatory functions (25).
2.4.5. Mitogen suppression
An important immunomodulatory aspect of MSC function is their capacity to suppress the proliferation of T cells in response to nonspecific mitogen stimulation (28). To assess the effect of MIRB labeling on the suppression capacity of MSC, peripheral blood mononuclear cells (PBMC) were isolated from heparinized blood by gradient centrifugation using Ficoll Paque Plus (GE Healthcare, Uppsala, Sweden). Cell counts and viability were assessed using trypan blue dye exclusion. Control or MIRB labeled allogeneic MSC (5 × 10⁴), were added to a U-bottomed 96-well plate (Corning, New York, USA) and allowed to adhere for 24 h prior to addition of the responder PBMC. The mitogen, phytohemagglutin (PHA) (Sigma), was added at a final concentration of 100 μg/ ml. Responding PBMC (1 × 10⁵/well) and MSC were cultured in 0.2 ml of culture media, consisting of RPMI 1640 (Invitrogen) supplemented with 15% heat-inactivated normal human AB serum (Valley Biomedical, Winchester, VA, USA), 1% penicillin–streptomycin, 1% non-essential amino acids, 1% sodium pyruvate, 1% vitamins (Invitrogen), 1% L-glutamine and 2 mM HEPES (Mediatech). Cultures were incubated at 37°C, 5% CO2 for 3 days and T cell proliferation to the mitogen was determined by addition of [3H] thymidine (GE Healthcare) to wells at 1 μCi/ well for the last 18 h of culture. The cells were harvested over fiberglass filters (Perkin Elmer, Waltham, MA, USA) using a Mach III 96 well cell harvester (Tomtec, Hamden, CT, USA) and radioactivity incorporated into DNA was measured by a liquid scintillation counter (1205 BetaPlate, Wallac, Turku, Finland). Data was expressed as mean counts per minute (cpm) of quadruplicate cultures.
2.4.6. Adipogenic and osteogenic differentiation of MSC
Differentiation into both fat and bone was evaluated for MSC labeled at MIRB concentrations of 10 and 20 μg Fe/ml and compared with unlabeled control cells. Following the manufacturer’s instructions (Human Mesenchymal Stem Cell Functional Identification Kit, R&D Systems, Minneapolis, MN, USA), MSC were plated at 2000 cells/cm2 in 24-well tissue culture-treated plates in the presence of the adipogenic and osteogenic supplements provided by the company. After 14 days in culture, with two adipogenic media changes per week, the MSC formed adipocytes. The plates were fixed with 10% formalin and stained with Oil Red O (Sigma). For osteogenic differentiation, the cells were incubated for 21 days, with two osteogenic media changes per week. After the culture period, the plates were fixed and stained with 1% Alizarin Red solution. Cells were photographed under a Zeiss Axiovert 200 inverted microscope.
2.5. In Vitro MRI evaluation
Images evaluated in this study were acquired on a clinical 1.5 T Siemens Symphony MRI unit. To assess the imaging properties of MIRB labeled MSC, phantoms were constructed with various configurations of MIRB MSC. T2 and T2* weighted sequences, previously employed for the detection of SPIO labeled cells (1,9,11,15,29–31), were applied and compared for power of detection defined by CNR and MOC calculations. T2* relaxation rates were evaluated as a function of cell number and cell labeling conditions for gradient echo (GE) sequences. Finally, an idealized limit of detection was established.
2.5.1. Phantom design
For in vitro MRI evaluation of MIRB MSC, phantom models containing MSC pellets embedded in agar were used. Phantoms were constructed as groups of 5 ml sample tubes (VWR Kimax® 51 borosilicate glass culture tubes) containing MIRB MSC pellets of various counts and labeled at different MIRB concentrations. MIRB MSC were centrifuged into a pellet and sandwiched between two layers of 0.5% agar. Sample tubes were then placed in a water matrix to reduce interface susceptibility artifacts (32,33). Phantom groups were used to evaluate MRI sequences for sensitivity, CNR and limit of detection for MIRB MSC configurations at various (a) MIRB MSC pellet counts and (b) MIRB labeling concentrations. Table 1 is a descriptive list of the phantom configurations employed in this study.
Table 1.
Phantom sets used to evaluate MRI properties of MIRB labeled MSC
| Phantom | No. of samples | Configuration | MSC/pellet (MSC/ml) | MIRB labeling conditions |
|---|---|---|---|---|
| 1 | 12 | MSC pellet in 0.5% agar | 1 × 10⁵ and 5 × 10⁴ | 0, 10 20, 30, 40, 50 |
| 2 | 7 | MSC pellet in 0.5% agar | 5 × 10⁵, 2.5 × 10⁵, 1.25 × 10⁵, 6.25 × 10⁴, 3.75 × 10⁴, 2.5 × 10⁴ | 20 |
| 3 | 21 | MSC distributed in 0.5% agar suspension | 5 × 10⁵, 3 × 10⁵, 1 × 10⁵, 5 × 10⁴, 1 × 10⁴, 5 × 10³, 0 | 0, 10, 20 |
| 4 | 10 | MSC pellet in 0.5% agar | 1 × 10⁴, 5 × 10³, 2 × 10³, 1 × 10³ | 10, 20 |
2.5.2. Imaging sequences
To each phantom set, T2*-weighted gradient echo (FLASH GE), T2-weighted fast spin echo (FSE) and T2*-weighted balanced steady-state free precession (bSSFP) sequences were applied. Important parameters, such as flip angle (FA), repetition (TR) and echo times (TE), and bandwidth (BW) were varied to assess MRI sensitivity to MIRB labeled MSC as a qualitative function of these variables. Details for the sequences and parameters considered in this investigation are shown in Table 2.
Table 2.
MRI sequences and parameters used for imaging MIRB labeled MSC phantoms
| Parameter | GE | FSE | SE | bSSFP |
|---|---|---|---|---|
| FOV | 200 × 200 | 200 × 20.0 | 200 × 200 | 200 × 200 |
| Matrix | 256 × 256 | 256 × 256 | 256 × 256 | 256 × 256 |
| Slice thickness/gap | 3/0% | 3/0% | 3/0% | 3/0% |
| TR | 500 | 3000 | 3000 | 12 |
| TE | 5–60 | 10–250 | 10–250 | 6 |
| BW | 130–200 | 130–200 | 130–200 | 130–170 |
| FA | 10–90 | — | — | 10–90 |
2.6. Image evaluation and analysis
2.6.1. CNR
Contrast-to-noise ratio, defined as CNR = (Ib − Ix)/σN where Ib, Ix and σN represent the intensities of background agar and sample MSC and the standard deviation of noise, respectively, was evaluated as a measure of image quality. Signal intensities used were average pixel intensity for a 7 mm region of interest (ROI) defined around each sample as measured with Segment (34). Noise was taken as signal intensity measured from the ROI defining the air surrounding the sample. The signal from these ROIs can safely be considered ‘noise’ as no real signal should be originating from void space (32). CNR was evaluated as a function of imaging sequence and parameters, MIRB MSC pellet size (count) and MIRB labeling concentration.
2.6.2. Modulation of contrast
To further assess strength of detection for each sequence, modulation of contrast, MOC = (Ib − Ix)/(Ib + Ix), for sample vs agar blank (background) was calculated. Modulation of contrast calculations are included as they may be a better indicator of the visual detection power of an artifact, whereas CNR is also a measure of image quality (35). Data from ROI as defined above were used in MOC calculations.
2.6.3. Relaxivity measurements
T2* properties of MIRB labeled MSC were evaluated for various MIRB MSC configurations and concentrations. T2* trends were approximated by measuring average signal intensities of selected ROIs at various echo times for GE sequences. Intensity values were then plotted vs echo times and the resulting function was fit into a mono-exponential decay curve as predicted by the Bloch equation [I(t) = I0 exp(−t/T2*)] (32,36). T2* approximations were calculated as the negative reciprocal of the decay constants from the exponential regressions.
T2* maps were also constructed as a pixel-by-pixel fitting algorithm performed by the software package for the Siemens MRI unit console (Software Version: syngo MR A30 4VA30A). Several GE sequences acquired at different TE were combined into a single series on the MRI console. The software applies an analysis algorithm to fit the data, pixel by pixel, into the Bloch equations and outputs an image which displays the T2* intensities (in milliseconds) at each pixel.
2.6.4. Limit of detection
The idealized limit of detection was determined with optimized scanning parameters, determined from CNR and MOC measurements, on pellets of cell counts ranging from 10 000 to 1000 MSC suspended in agar (Phantom Group 4). Phantom ‘biopsy’ and evaluation by Rh-B fluorescence microscopy was performed after imaging to confirm the presence and number of imaged MSC.
3. RESULTS
3.1. Cell labeling and loading characterization
3.1.1. Intracellular MIRB eistribution
After a 20 h incubation, internalized MIRB was observed to localize cytoplasmically within perinuclear endosomes of the MSC. This localization pattern was apparent under both light and fluorescence microscopy and was observed for all labeling conditions considered. Figure 1 shows light microscopy images, enhanced with Prussian Blue staining for Fe visualization, and fluorescent microscope images of Rh-B within MSC cytoplasm.
Figure 1.

Light (top row) and flourescence (bottom row) microscopy images of control unlabeled MSC (left column) and MIRB labeled MSC (right column). Cells are stained with Prussian Blue for Fe prescence (400× magnification).
3.1.2. Labeling efficiency
Labeling efficiency, as percentage of Rh-B positive cells via flow cytometery, ranged from 65.9% for cells labeled at 5 μg Fe/ml to over 95% for cells labeled at MIRB concentrations at or above 20 μg Fe/ml. Flow cytometry data for Rh-B presence in MSC labeled at MIRB concentrations up to 100 μg Fe/ml is shown in Fig. 2.
Figure 2.
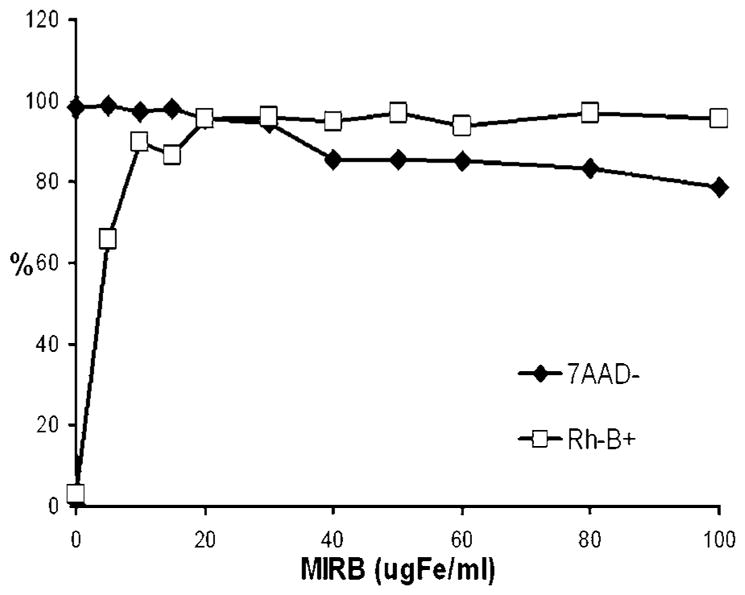
Flow cytometry data for viability (7AAD-) and labeling efficiency (Rh-B+) as a function of MIRB labeling concentration.
3.1.3. MIRB uptake
Average internalized MIRB, in picograms Fe per MSC, is shown in Fig. 3. Average Fe/MSC calculation was a direct function of cell count which was performed manually on a hemocytometer. Error introduced by manual cell counting, estimated at 10–15% (37). represents the dominant error and the limit accuracy for intracellular Fe approximations. Data from the six assays demonstrate a saturation phenomena as a function of increasing labeling concentration of MIRB. The plateau occurs at a labeling concentration between 20 and 30 μg Fe/ml and results in an average uptake of approximately 15–20 pg Fe/MSC.
Figure 3.

Average internalized FE per MSC as a function of MIRB labeling concentration with asymptotic curve fit. Error bars represent 15% approximated error from cell counting.
3.2. MSC Viability and Functional Capacity
3.2.1. Viability and proliferative capacity
For labeling of MSC at MIRB concentrations of up to 30 μg Fe/ml, viability (95–99%) was not significantly different compared with unlabeled MSC (98–100%). For higher labeling concentrations, above 30, viability monotonically decreased, reaching a value of 78.8% at MIRB labeling concentrations of 100 μg Fe/ml (Fig. 2).
Proliferative capacity, assessed as fold expansion, for MSC labeled at both 10 and 20 μg Fe/ml was not significantly different from unlabeled control MSC ( p >0.4).
3.2.2. Gene expression
Gene expression levels for IL-6, galectin-1, HGF, IL-10, TGF-β and VEGF were assessed in MIRB labeled and control MSC from three different animals. The highest variability between donors was seen for HGF, but we did not observe noticeable differences between control and labeled cells for a single donor. IL-10 (not shown) was expressed at negligible levels in all samples. Flow data for viability and PCR gene expression is shown as Fig. 4.
Figure 4.

(top) Gene expression data for control (C) and MIRB labeled (L) MSC from three experiments. (bottom) Representative flow cytometry data for labeling efficiency, viability and phenotype for control (grey stripes bar) and MIRB labeled (black bar) MSC.
3.2.3. Mitogen suppression
Compared with unlabeled control MSC, MIRB MSC, labeled at 20 μg Fe/ml, exhibited a comparable ability to inhibit PBMC proliferation in response to PHA stimulation. Figure 5 shows relative proliferation rates of PBMC for no MSC, control MSC and MIRB MSC in response to PHA stimulation.
Figure 5.
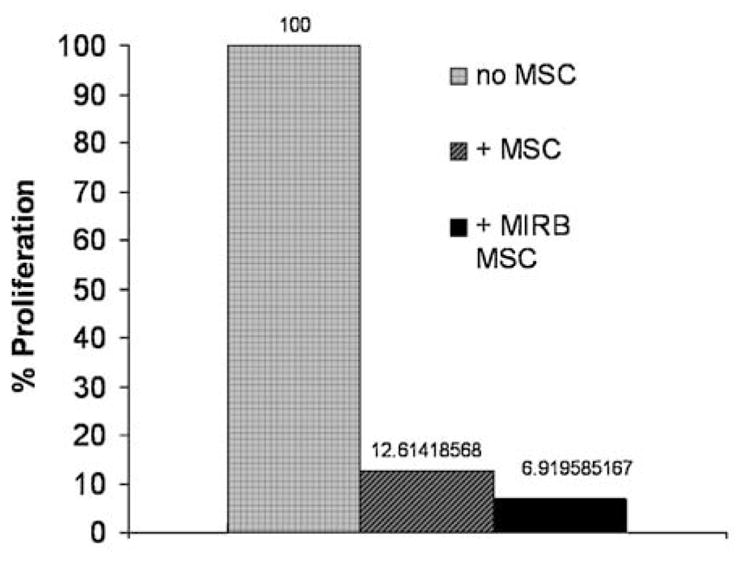
Relative proliferation rates for PHA stimulated PBMC with the addition of no MSC, control MSC or MIRB labeled (20 μg Fe/ml) MSC (n =1 experiment).
3.2.4. Phenotype
Phenotype, as assessed by the presence of cell surface markers identified as characteristic of MSC and the absence of the surface markers associated with lymphocytic and hematopoietic cells (via flow cytometry), was assessed at MIRB labeling concentrations of both 10 (n = 2) and 20 (n = 2) μg Fe/ml. At these labeling concentrations, there was no significant difference between labeled and control MSC phenotypic profile (Fig. 4).
3.2.5. Differentiation capacity
Differentiation into both bone and fat for MSC labeled at 10 μg Fe/ml (data not shown) and 20 μg Fe/ml MIRB, demonstrated no appreciable difference between unlabeled and MIRB MSC, labeled at either 10 or 20 μg Fe/ml, indicating that the presence of the MIRB label at these concentrations does not inhibit differentiation capacity (Fig. 6).
Figure 6.
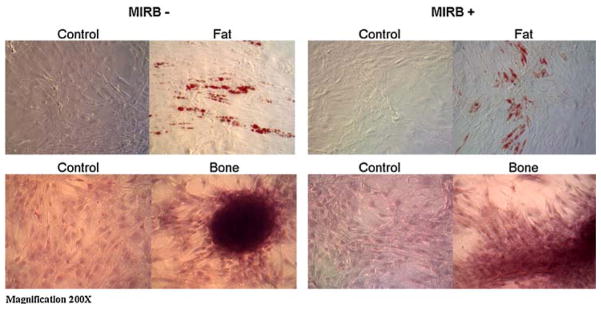
Light microscopy images of unlabeled and labeled (20 μg Fe/ml) MSC differentiation into fat (top) and bone (bottom). Control cells (both labeled and unlabeled) were not provided with adipogenic or osteogenic media.
3.3. In vitro MRI characterization
3.3.1. Imaging sequences: evaluation and analysis
To evaluate MRI detection properties, CNR was assessed as a function of important imaging parameters for each sequence considered. For GE sequences CNR was assessed as a function of BW, FA, TR and TE. As a function of TR, signal monotonically increased as did susceptibility weighting, providing for a maximum in CNR at the longest TR considered (system limit for FLASH sequence) of 500 ms. CNR was optimized at a BW of 130 kHz and a FA of 40° for the TR = 500 ms sequences. As a function of TE, CNR for GE sequences plateaued between 30 and 40 ms, after which point marginal increases and decreases (depending upon specific phantom imaged) were observed.
CNR curves for SE sequences behaved similarly to GE sequences as functions of BW, TR and TE. The FA for FSE sequences is typically kept at 90° and was not varied in the optimization of this sequence. The highest CNR for SE sequences was achieved at TR/TE 3000/220 ms and BW 130 kHz.
Parameters variation within the bSSFP (TRUFI™) sequence was limited by internal software presets. CNR was maximized at BW of 130 kHz and FA of 40°. Representative data for CNR as a function of TE for GE and SE sequences is shown in Fig. 7.
Figure 7.

CNR vs TE for spin echo (top) and gradient echo (bottom) sequences for labeled and unlabeled MSC pallets with cell count of 1E5. Data shown as mean ± SEM for 6 aquisitions.
At CNR maximized parameters, the highest CNR was achieved with GE sequences. Maximum CNR for bSSFP sequences was higher than that achieved from SE sequences. CNR relationships between each of the optimized sequences were consistent between all phantom sets imaged. Figure 8 shows representative CNR values for optimized imaging sequences.
Figure 8.

Optimized CNR for each of the considered imaging sequences vs. MSC concentration (top) and MSC pellet count (bottom). Mean ± SEM for 4 acquisitions.
CNR increased with both MSC pellet count and with increased intracellular Fe (increased MIRB labeling concentrations) for all sequences. Data is shown to indicate optimization trends and imaging capabilities. Strict comparison between different sample preparations is of limited utility as slice position and ROI selection through a distributed MSC pellet may considerably alter calculated CNR values. Data reported here are meant to demonstrate relative sensitivities between various imaging sequences as well as to identify trends as imaging parameters vary within selected sequences. Representative data is shown in Fig. 9 for MSC pellet counts and for MSC labeled at different MIRB concentrations.
Figure 9.

CNR for SE and GE sequences for MSC pellets labeled at increasing MIRB concentrations (top left) and GE (500/60) image of phantom used with 5E4 MSC labeled with MIRB in concentrations (from left to right) of 50, 40, 30, 20, 10 μg Fe/ml (top right). CNR vs. MSC pellet cell count for MSC labeled with 20 μg Fe/ml (lower left) and GE (500/60) image of phantom set used with (from left to right) 1.25E4, 2.5E4, 3.75E4, 6.25E4,1.2E5, 2.5E5 and 5E5 MSC labeled with 20 μg Fe/ml (lower right).
MOC vs imaging sequence varied similarly to CNR in that highest MOC was achieved with GE sequences followed by bSSFP and SE sequences. As a function of imaging parameters for each sequence, the values for MOC appeared to monotonically increase as susceptibility weighting increased. For most MSC samples considered, MOC trends were asymptotic rather than revealing a maximum value as did CNR trends. For GE sequences, MOC monotonically increased as a function of TE, whereas CNR values peaked at a TE of roughly 30 ms and then began to level off or slowly decline. Figure 10 demonstrates MOC trends vs CNR trends for imaging series of several TE.
Figure 10.
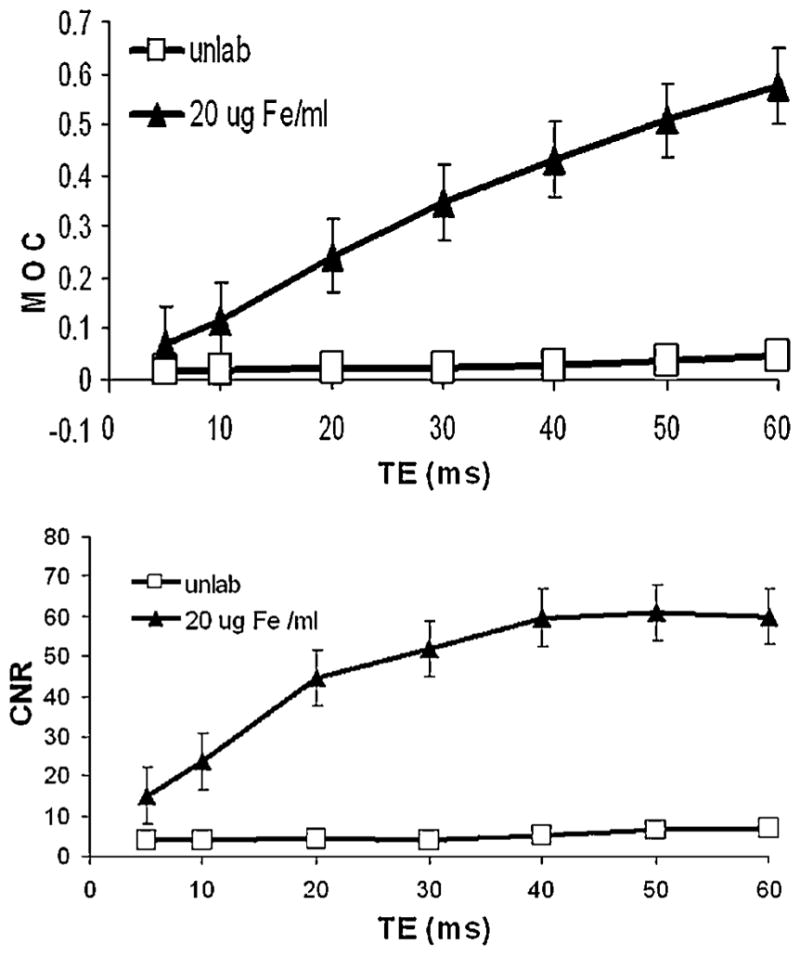
MOC (top) and CNR (bottom) curves vs. TE for GE (TR =500) sequences for labeled and unlabeled MSC. Mean ± SEM for 4 acquisitions.
T2* approximations for labeled MSC were shown to be a function of cell number, cell configuration and average MIRB per cell. Effectively, increased localized Fe content produces a larger magnetic effect on the surrounding protons, resulting in an increased spin–spin–decay-constant shortening. For the MSC configurations considered in this investigation, T2* values asymptotically approached a value of 20 ms. The T2* approximation for agar was approximately 120 ms, creating a maximum T2* shortening effect of about 100 ms for MIRB-labeled MSC in the configurations and concentrations considered.
Data from T2* maps generated by the Siemens software package, described above, correlated well with the trends established by mono-exponential decay fitting. Representative T2* maps and fitted T2* curves as functions of cell count and MIRB labeling concentration are shown in Fig. 11.
Figure 11.

T2* curves as a function on cell count (top left) and MIRB labeling concentration (bottom left) and T2* map of phantom with various MIRB MSC pallets (right). Mean ± SEM for 6 acquisitions.
For phantom models, idealized limit of detection was accomplished with CNR and MOC-optimized, high echo time (60 ms) GE sequence. For this sequence, pellet counts as low as approximately 1000 ± 150 MIRB MSC were detectable as statistically significant ( p < 0.001) from background. In Phantom Group 4, all three tubes containing MSC pellets of approximately 1000 cells were detectable (Fig. 12). Optimized FSE and bSSFP sequences applied to the same phantoms failed to detect (visually, and as statistically significant from background) any of the 1000 MSC pellets. bSSFP and FSE were able to detect two-thirds and one-third of the 2000 MSC pellets, respectively, as well as both 5000 and 10000 MSC pellet samples.
Figure 12.
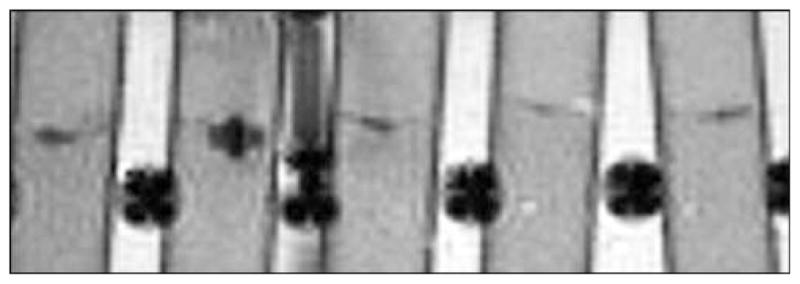
GE (500/60) image of phantom used for limit detection. From left MIRB MSC pellet counts of 5E3, 2E3, 1E3, 1E3, 1E3.
4. DISCUSSION
Bone marrow-derived MSC can effectively be labeled with MIRB and detected in low numbers (1000 MSC) with MRI. Labeling does not require the induction methods needed for incorporation of other SPIO agents (38–43). Optimal labeling conditions, determined as 20 μg Fe of MIRB/ml of culture media, result in an internalization of approximately 15 pg Fe/MSC. This is comparable to previous studies with Feridex™, where values from 10 to 20 pg/MSC have been reported with the use of high molecular weight poly-L-lysine as a transfection agent (44). MIRB appears to be localized within cytoplasmic endosomes surrounding the nucleus. Labeling, at this concentration, does not affect MSC viability, proliferative capacity, phenotype, functional capacity or the ability to differentiate into either fat or bone. MRI sensitivity is maximized through the application of long TR/TE, low BW, low FA gradient echo sequences. These sequences exaggerate the susceptibility artifact, clinically referred to as ‘blooming’, created by MIRB-induced local magnetic field perturbations (44–46). These observations, including Fe loading, intracellular distribution and effect on viability and differentiation, are in agreement with results of previous experiments conducted with other SPIO nanoparticles and labeling techniques (1,16,30,41,47,48).
Our data suggest that, while increased labeling concentrations of MIRB monotonically increases average Fe per MSC (at the concentrations we considered), an optimal range for labeling concentration can be identified by considering the differential in contrast (due to increased intracellular Fe) vs the increased cost and likelihood of adverse effects due to intracellular Fe overloading (49,50). Simultaneous maximization of viability, labeling efficiency and Fe uptake as a function of labeling concentration of MIRB results in a value of 20 μg Fe/ml as the optimal labeling concentration. Beyond this point, increased labeling concentration of MIRB only marginally increases Fe/ MSC and has an even smaller effect on contrast. Figure 13 demonstrates loading (in pg Fe/MSC), relative contrast and viability trends vs MIRB labeling concentration. At 20 μg Fe/ml, both labeling efficiency and viability remain on the flat portion of the curve, indicating that increased concentrations only marginally increase labeling efficiency and decreased concentrations only marginally increase viability.
Figure 13.
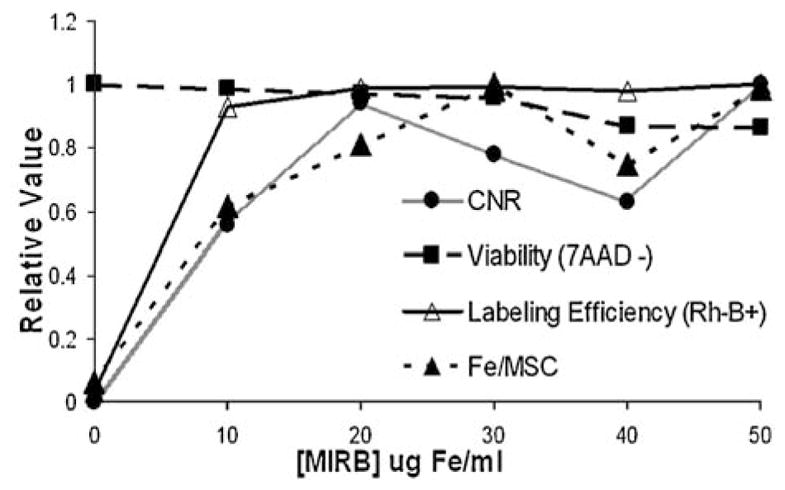
Optimal MIRB labeling concentration. Relative CNR, Labeling efficiency, Fe/MSC & viability as a function of MIRB labeling concentration.
At the Fe loading achievable with MIRB, we have shown in vitro MRI detection to be feasible and to have the sensitivity to detect as few as 1000 MSC at a clinically typical field strength of 1.5 T.
Unlike spin echo sequences, GE sequences do not apply an extra refocusing pulse and are consequently subject to additional losses in the transverse magnetization vector, leading to faster loss of spin–spin coherence (23). These additional losses can come from susceptibility artifacts, as produced locally by SPIO nanoparticles, and manifest as an increased spin–spin decay shortening above T2, referred to as T2* (32). The T2* shortening effect of the local magnetic perturbations are more pronounced than T2 shortening effects. Thus CNR achieved by GE sequences is higher than that achievable from SE sequences for our in vitro model. Other studies have made use of SE and bSSFP sequences to image SPIO labeled cells, with varying results, but our investigations confirm that GE sequences provide the highest sensitivity to SPIO labeled cells. For cells suspended in agar, contrast modulation was also highest with GE sequences. SSFP sequences, which are derivatives of GE sequences and maintain some degree of T2* weighting, provided lower CNR and contrast modulation than GE but higher than FSE sequences which are sensitive to purely T2 decay (25).
Our in vitro results demonstrate the feasibility of using a new SPIO contrast agent for cell labeling and are indicative of its applicability for in vivo tracking of MSC. We have characterized the Fe loading properties of MIRB and demonstrated the feasibility of detecting low numbers of MSC by applying highly susceptibility-weighted GE sequences. However, in referencing these results, it must be considered that the phantom preparations utilized are idealized models and do not accurately mimic most in vivo applications. While increasing TE in GE sequences amplifies the ‘blooming’ effect attributable to SPIO nanoparticles, it also exaggerates all other magnetic perturbations including boundaries, motion and shimming artifacts (32,45). Consequently, sensitivity can be increased by increasing TE, but specificity and applicability to in vivo systems may suffer. There will be a unique TE for each application which maximizes detection as a function of specificity and sensitivity for the detection of SPIO nanoparticles. For our experiments, TE = 60 ms for FLASH GE sequences provided, qualitatively, the best detectability for our SPIO labeled MSC suspended in agar. While this demonstrates proof of principle, it is likely that each in vivo application will require parameter optimization which may be accomplished with the methodology outlined in this study. These results lay the groundwork and established feasibility for the use of this contrast agent labeling and for in vivo MRI detection of MSC.
Acknowledgments
This study was funded by the Diabetes Research Institute Foundation and the Interdisciplinary Stem Cell Institute, University of Miami Miller School of Medicine, through NIH grants HL084275, HL084275 and U19 AI051728.
References
- 1.Budde MD, Frank JA. Magnetic tagging of therapeutic cells for MRI. J Null Med. 2009;50(2):171–174. doi: 10.2967/jnumed.108.053546. [DOI] [PMC free article] [PubMed] [Google Scholar]
- 2.Adler ED, Bystrup A, Briley-Saebo KC, Mani V, Young W, Giovanonne S, Altman P, Kattman SJ, Frank JA, Weinmann HJ, Keller GM, Fayad ZA. In vivo detection of embryonic stem cell-derived cardiovascular progenitor cells using Cy3-labeled Gadofluorine M in murine myocardium. JACC Cardiovasc Imag. 2009;2(9):1114–1122. doi: 10.1016/j.jcmg.2009.04.015. [DOI] [PMC free article] [PubMed] [Google Scholar]
- 3.Brekke C, Williams SC, Price J, Thorsen F, Modo M. Cellular multiparametric MRI of neural stem cell therapy in a rat glioma model. Neuroimage. 2007;37(3):769–782. doi: 10.1016/j.neuroimage.2007.06.006. [DOI] [PubMed] [Google Scholar]
- 4.Guzman R, Uchida N, Bliss TM, He D, Christopherson KK, Stellwagen D, Capela A, Greve J, Malenka RC, Moseley ME, Palmer TD, Steinberg GK. Long-term monitoring of transplanted human neural stem cells in developmental and pathological contexts with MRI. Proc Natl Acad Sci USA. 2007;104(24):10211–10216. doi: 10.1073/pnas.0608519104. [DOI] [PMC free article] [PubMed] [Google Scholar]
- 5.Higuchi T, Anton M, Dumler K, Seidl S, Pelisek J, Saraste A, Welling A, Hofmann F, Oostendorp RA, Gansbacher B, Nekolla SG, Bengel FM, Botnar RM, Schwaiger M. Combined reporter gene PET and iron oxide MRI for monitoring survival and localization of transplanted cells in the rat heart. J Nucl Med. 2009;50(7):1088–1094. doi: 10.2967/jnumed.108.060665. [DOI] [PubMed] [Google Scholar]
- 6.Onda T, Honmou O, Harada K, Houkin K, Hamada H, Kocsis JD. Therapeutic benefits by human mesenchymal stem cells (hMSCs) and Ang-1 gene-modified hMSCs after cerebral ischemia. J Cereb Blood Flow Metab. 2008;28(2):329–340. doi: 10.1038/sj.jcbfm.9600527. [DOI] [PMC free article] [PubMed] [Google Scholar]
- 7.Chang NK, Jeong YY, Park JS, Jeong HS, Jang S, Jang MJ, Lee JH, Shin SS, Yoon W, Chung TW, Kang HK. Tracking of neural stem cells in rats with intracerebral hemorrhage by the use of 3T MRI. Korean J Radiol. 2008;9(3):196–204. doi: 10.3348/kjr.2008.9.3.196. [DOI] [PMC free article] [PubMed] [Google Scholar]
- 8.Dousset V, Tourdias T, Brochet B, Boiziau C, Petry KG. How to trace stem cells for MRI evaluation? J Neurol Sci. 2008;265(1–2):122–126. doi: 10.1016/j.jns.2007.09.026. [DOI] [PubMed] [Google Scholar]
- 9.Kraitchman DL, Bulte JW. Imaging of stem cells using MRI. Basic Res Cardiol. 2008;103(2):105–113. doi: 10.1007/s00395-008-0704-5. [DOI] [PMC free article] [PubMed] [Google Scholar]
- 10.Kustermann E, Himmelreich U, Kandal K, Geelen T, Ketkar A, Wiedermann D, Strecker C, Esser J, Arnhold S, Hoehn M. Efficient stem cell labeling for MRI studies. Contrast Media Mol Imag. 2008;3(1):27–37. doi: 10.1002/cmmi.229. [DOI] [PubMed] [Google Scholar]
- 11.Zhu W, Li X, Tang Z, Zhu S, Qi J, Wei L, Lei H. Superparamagnetic iron oxide labeling of neural stem cells and 4. 7 T MRI tracking in vivo and in vitro. J Huazhong Univ Sci Technol Med Sci. 2007;27(1):107–110. doi: 10.1007/s11596-007-0130-1. [DOI] [PubMed] [Google Scholar]
- 12.Tang Z, Lin N, Fang H, Zhu K, Liu Y, Zhong Y, Lin J, Kang Z, Xu R. MRI tracking of the fate of intravascularly injected and SPIO-labeled rat mesenchymal stem cells in the livers of rats with hepatic fibrosis. Dig Dis Sci. 2009 doi: 10.1007/s10620-009-0921-2. [DOI] [PubMed] [Google Scholar]
- 13.Debbage P, Jaschke W. Molecular imaging with nanoparticles: giant roles for dwarf actors. Histochem Cell Biol. 2008;130(5):845–875. doi: 10.1007/s00418-008-0511-y. [DOI] [PubMed] [Google Scholar]
- 14.Arbab AS, Janic B, Knight RA, Anderson SA, Pawelczyk E, Rad AM, Read EJ, Pandit SD, Frank JA. Detection of migration of locally implanted AC133+ stem cells by cellular magnetic resonance imaging with histological findings. FASEB J. 2008;22(9):3234–3246. doi: 10.1096/fj.07-105676. [DOI] [PMC free article] [PubMed] [Google Scholar]
- 15.Cai J, Zhang X, Wang X, Li C, Liu G. In vivo MR imaging of magnetically labeled mesenchymal stem cells transplanted into rat liver through hepatic arterial injection. Contrast Media Mol Imag. 2008;3(2):61–66. doi: 10.1002/cmmi.231. [DOI] [PubMed] [Google Scholar]
- 16.Bulte JW. In vivo MRI cell tracking: clinical studies. AJR Am J Roentgenol. 2009;193(2):314–325. doi: 10.2214/AJR.09.3107. [DOI] [PMC free article] [PubMed] [Google Scholar]
- 17.Bulte JW, Duncan ID, Frank JA. In vivo magnetic resonance tracking of magnetically labeled cells after transplantation. J Cereb Blood Flow Metab. 2002;22(8):899–907. doi: 10.1097/00004647-200208000-00001. [DOI] [PubMed] [Google Scholar]
- 18.Arbab AS, Yocum GT, Rad AM, Khakoo AY, Fellowes V, Read EJ, Frank JA. Labeling of cells with ferumoxides-protamine sulfate complexes does not inhibit function or differentiation capacity of hematopoietic or mesenchymal stem cells. NMR Biomed. 2005;18(8):553–559. doi: 10.1002/nbm.991. [DOI] [PubMed] [Google Scholar]
- 19.Kim D, Chun BG, Kim YK, Lee YH, Park CS, Jeon I, Cheong C, Hwang TS, Chung H, Gwag BJ, Hong KS, Song J. In vivo tracking of human mesenchymal stem cells in experimental stroke. Cell Transplant. 2008;16(10):1007–1012. [PubMed] [Google Scholar]
- 20.Kostura L, Kraitchman DL, Mackay AM, Pittenger MF, Bulte JW. Feridex labeling of mesenchymal stem cells inhibits chondrogenesis but not adipogenesis or osteogenesis. NMR Biomed. 2004;17(7):513–517. doi: 10.1002/nbm.925. [DOI] [PubMed] [Google Scholar]
- 21.Oweida AJ, Dunn EA, Karlik SJ, Dekaban GA, Foster PJ. Iron-oxide labeling of hematogenous macrophages in a model of experimental autoimmune encephalomyelitis and the contribution to signal loss in fast imaging employing steady state acquisition (FIESTA) images. J Magn Reson Imag. 2007;26(1):144–151. doi: 10.1002/jmri.21005. [DOI] [PubMed] [Google Scholar]
- 22.Reddy AM, Kwak BK, Shim HJ, Ahn C, Cho SH, Kim BJ, Jeong SY, Hwang SJ, Yuk SH. Functional characterization of mesenchymal stem cells labeled with a novel PVP-coated superparamagnetic iron oxide. Contrast Media Mol Imag. 2009;4(3):118–126. doi: 10.1002/cmmi.271. [DOI] [PubMed] [Google Scholar]
- 23.Tai JH, Foster P, Rosales A, Feng B, Hasilo C, Martinez V, Ramadan S, Snir J, Melling CW, Dhanvantari S, Rutt B, White DJ. Imaging islets labeled with magnetic nanoparticles at 1. 5 Tesla. Diabetes. 2006;55(11):2931–2938. doi: 10.2337/db06-0393. [DOI] [PubMed] [Google Scholar]
- 24.Colter DC, Sekiya I, Prockop DJ. Identification of a subpopulation of rapidly self-renewing and multipotential adult stem cells in colonies of human marrow stromal cells. Proc Natl Acad Sci USA. 2001;98(14):7841–7845. doi: 10.1073/pnas.141221698. [DOI] [PMC free article] [PubMed] [Google Scholar]
- 25.Kenyon NS, Willman M, Kleiner G, Bartholomew A, Berman DM. Mesenchymal stem cells (MSC) enhance allogeneic islet engraftment and reverse rejection episodes in cynomolgus monkeys. American Journal of Transplantation. 2009;9(suppl 2) [Google Scholar]
- 26.Rad AM, Janic B, Iskander AS, Soltanian-Zadeh H, Arbab AS. Measurement of quantity of iron in magnetically labeled cells: comparison among different UV/VIS spectrometric methods. Biotechniques. 2007;43(5):627–628. 630, 632. doi: 10.2144/000112599. passim. [DOI] [PubMed] [Google Scholar]
- 27.Rad AM, Arbab AS, Iskander AS, Jiang Q, Soltanian-Zadeh H. Quantification of superparamagnetic iron oxide (SPIO)-labeled cells using MRI. J Magn Reson Imag. 2007;26(2):366–374. doi: 10.1002/jmri.20978. [DOI] [PMC free article] [PubMed] [Google Scholar]
- 28.Di Nicola M, Carlo-Stella C, Magni M, Milanesi M, Longoni PD, Matteucci P, Grisanti S, Gianni AM. Human bone marrow stromal cells suppress T-lymphocyte proliferation induced by cellular or nonspecific mitogenic stimuli. Blood. 2002;99(10):3838–3843. doi: 10.1182/blood.v99.10.3838. [DOI] [PubMed] [Google Scholar]
- 29.Kim SH, Lee WJ, Lim HK, Park CK. SPIO-enhanced MRI findings of well-differentiated hepatocellular carcinomas: correlation with MDCT findings. Korean J Radiol. 2009;10(2):112–120. doi: 10.3348/kjr.2009.10.2.112. [DOI] [PMC free article] [PubMed] [Google Scholar]
- 30.Arbab AS, Liu W, Frank JA. Cellular magnetic resonance imaging: current status and future prospects. Expert Rev Med Devices. 2006;3(4):427–439. doi: 10.1586/17434440.3.4.427. [DOI] [PubMed] [Google Scholar]
- 31.Ju S, Teng G, Zhang Y, Ma M, Chen F, Ni Y. In vitro labeling and MRI of mesenchymal stem cells from human umbilical cord blood. Magn Reson Imag. 2006;24(5):611–617. doi: 10.1016/j.mri.2005.12.017. [DOI] [PubMed] [Google Scholar]
- 32.Haacke ME, Brown RW, Thompson MR, Venkatesan R. Physical Principles and Sequence Design. Wiley; Chichester: 1999. Magnetic Resonance Imaging. [Google Scholar]
- 33.Denk C, Rauscher A. Susceptibility weighted imaging with multiple echoes. J Magn Reson Imag. 2009;31(1):185–191. doi: 10.1002/jmri.21995. [DOI] [PubMed] [Google Scholar]
- 34.Heiberg E, Sjogren J, Ugander M, Carlsson M, Engblom H, Arheden H. Design and validation of segment – a freely available software for cardiovascular image analysis. BMC Medical Imag. doi: 10.1186/1471-2342-10-1. in press. [DOI] [PMC free article] [PubMed] [Google Scholar]
- 35.Peli E. In search of a contrast metric: matching the perceived contrast of Gabor patches at different phases and bandwidths. Vision Res. 1997;37(23):3217–3224. doi: 10.1016/s0042-6989(96)00262-3. [DOI] [PubMed] [Google Scholar]
- 36.Henning TD, Wendland MF, Golovko D, Sutton EJ, Sennino B, Malek F, Bauer JS, McDonald DM, Daldrup-Link H. Relaxation effects of ferucarbotran-labeled mesenchymal stem cells at 1. 5 T and 3 T: discrimination of viable from lysed cells. Magn Reson Med. 2009;62(2):325–332. doi: 10.1002/mrm.22011. [DOI] [PMC free article] [PubMed] [Google Scholar]
- 37.Berkson JM, Magath TB, Hurn M. The error of estimate of the blood cell count as made with the hemocytometer. Am J Physiol. 1939;128:309–323. [Google Scholar]
- 38.Frank JA, Anderson SA, Kalsih H, Jordan EK, Lewis BK, Yocum GT, Arbab AS. Methods for magnetically labeling stem and other cells for detection by in vivo magnetic resonance imaging. Cytotherapy. 2004;6(6):621–625. doi: 10.1080/14653240410005267-1. [DOI] [PubMed] [Google Scholar]
- 39.Giesel FL, Stroick M, Griebe M, Troster H, von der Lieth CW, Requardt M, Rius M, Essig M, Kauczor HU, Hennerici MG, Fatar M. Gadofluorine m uptake in stem cells as a new magnetic resonance imaging tracking method: an in vitro and in vivo study. Invest Radiol. 2006;41(12):868–873. doi: 10.1097/01.rli.0000246147.44835.4c. [DOI] [PubMed] [Google Scholar]
- 40.Hsiao JK, Tsai CP, Chung TH, Hung Y, Yao M, Liu HM, Mou CY, Yang CS, Chen YC, Huang DM. Mesoporous silica nanoparticles as a delivery system of gadolinium for effective human stem cell tracking. Small. 2008;4(9):1445–1452. doi: 10.1002/smll.200701316. [DOI] [PubMed] [Google Scholar]
- 41.Hu SL, Zhang JQ, Hu X, Hu R, Luo HS, Li F, Xia YZ, Li JT, Lin JK, Zhu G, Feng H. In vitro labeling of human umbilical cord mesenchymal stem cells with superparamagnetic iron oxide nanoparticles. J Cell Biochem. 2009 doi: 10.1002/jcb.22283. [DOI] [PubMed] [Google Scholar]
- 42.Janic B, Rad AM, Jordan EK, Iskander AS, Ali MM, Varma NR, Frank JA, Arbab AS. Optimization and validation of FePro cell labeling method. PLoS One. 2009;4(6):e5873. doi: 10.1371/journal.pone.0005873. [DOI] [PMC free article] [PubMed] [Google Scholar]
- 43.Arbab AS, Yocum GT, Wilson LB, Parwana A, Jordan EK, Kalish H, Frank JA. Comparison of transfection agents in forming complexes with ferumoxides cell labeling efficiency, and cellular viability. Mol Imag. 2004;3(1):24–32. doi: 10.1162/15353500200403190. [DOI] [PubMed] [Google Scholar]
- 44.Bulte JW, Kraitchman DL. Iron oxide MR contrast agents for molecular and cellular imaging. NMR Biomed. 2004;17(7):484–499. doi: 10.1002/nbm.924. [DOI] [PubMed] [Google Scholar]
- 45.Chavhan GB, Babyn PS, Thomas B, Shroff MM, Haacke EM. Principles, techniques, and applications of T2*-based MR imaging and its special applications. Radiographics. 2009;29(5):1433–1449. doi: 10.1148/rg.295095034. [DOI] [PMC free article] [PubMed] [Google Scholar]
- 46.Bancroft LW, Bridges MD. MRI Normal Variants and Pitfalls. Lippincott Williams and Wilkins; Philadelphia, PA: 2009. [Google Scholar]
- 47.Arbab AS, Yocum GT, Kalish H, Jordan EK, Anderson SA, Khakoo AY, Read EJ, Frank JA. Efficient magnetic cell labeling with protamine sulfate complexed to ferumoxides for cellular MRI. Blood. 2004;104(4):1217–1223. doi: 10.1182/blood-2004-02-0655. [DOI] [PubMed] [Google Scholar]
- 48.Bulte JW, Kostura L, Mackay A, Karmarkar PV, Izbudak I, Atalar E, Fritzges D, Rodriguez ER, Young RG, Marcelino M, Pittenger MF, Kraitchman DL. Feridex-labeled mesenchymal stem cells: cellular differentiation and MR assessment in a canine myocardial infarction model. Acad Radiol. 2005;12(suppl 1):S2–6. doi: 10.1016/j.acra.2005.02.014. [DOI] [PubMed] [Google Scholar]
- 49.Soenen SJ, De Cuyper M. Assessing cytotoxicity of (iron oxide-based) nanoparticles: an overview of different methods exemplified with cationic magnetoliposomes. Contrast Media Mol Imag. 2009;4(5):207–219. doi: 10.1002/cmmi.282. [DOI] [PubMed] [Google Scholar]
- 50.Arbab AS, Bashaw LA, Miller BR, Jordan EK, Lewis BK, Kalish H, Frank JA. Characterization of biophysical and metabolic properties of cells labeled with superparamagnetic iron oxide nanoparticles and transfection agent for cellular MR imaging. Radiology. 2003;229(3):838–846. doi: 10.1148/radiol.2293021215. [DOI] [PubMed] [Google Scholar]