

Abstract
The human brain is an exceptionally heterogeneous structure. In order to gain insight into the neurobiological basis of neural circuit disturbances in various neurologic or psychiatric diseases, it is often important to define the molecular cascades that are associated with these disturbances in a neuronal type-specific manner. This can be achieved by the use of laser microdissection, in combination with molecular techniques such as gene expression profiling. To identify neurons in human postmortem brain tissue, one can use the inherent properties of the neuron, such as pigmentation and morphology or its structural composition through immunohistochemistry (IHC). Here, we describe the isolation of homogeneous neuronal cells and high-quality RNA from human postmortem brain material using a combination of rapid IHC, Nissl staining, or simple morphology with Laser-Capture Microdissection (LCM) or Laser Microdissection (LMD).
Keywords: Laser-capture microdissection, Laser microdissection, Postmortem brain, Immunohistochemistry, Nissl staining, Dopamine, Parvalbumin, GABAergic, Pyramidal, Neurons, Expression profiling
1. Introduction
Gene or noncoding (nc) RNA expression profiling of neuronal cell populations from postmortem brains is a quickly expanding field in neuroscience, and recent developments have introduced laser-assisted microdissection to individually isolate these cells. This cell-specific based analysis enables molecular fingerprinting, such as mRNA or microRNA expression profiling, without the confounding effects of surrounding cells and/or tissue structures (1).
A requirement for laser microdissection on postmortem brain material is the reliable visualization of the desired neurons. Some of the methods that are commonly used to identify specific subsets of neurons include immunohistochemistry (IHC) and Nissl staining. These procedures are conventionally optimized for the purpose of preservation of morphological details for downstream neuroanatomical analyses and typically involve a number of aqueous processing steps during a rather prolonged time interval (up to 2–3 days). As a result, they inevitably lead to significant and often complete degradation of RNA and, hence, cannot be directly adapted for laser microdissection of neurons for gene expression studies.
Expression profiling from laser-isolated cells requires the acquisition of high-quality mRNA or other ncRNA molecules – e.g., for a sample purity as expressed by an absorption ratio (A260–A280) between 1.8 and 2.5 and in the case of microarray hybridization, quantities in the microgram range, usually obtained after two rounds of T7-based linear amplification, are common practice (2). Here, we first describe three methods to identify neurons of interest from postmortem brains: (1) A quick Nissl staining protocol to detect pyramidal neurons by their characteristic morphology, (2) a rapid IHC protocol to visualize parvalbumin (PV)-containing GABAergic neurons, (3), and (3) the capture of naturally pigmented neuromelanin-containing dopamine neurons (4, 5) (Fig. 1). Then, we describe two currently available laser-assisted methods to isolate neurons in postmortem brains – Laser Capture Microdissection (LCM), which makes use of a low-intensity infrared laser beam to attach neurons on a matrix (6), and Laser Microdissection (LMD) that removes cells with a high-intensity UV cutting laser and collects them by gravity (7). Finally, we provide information about the quality of pre- or postamplified RNA isolated from captured cells for downstream applications such as quantitative Real-Time (qRT)-PCR or microarray hybridization, respectively.
Fig. 1.
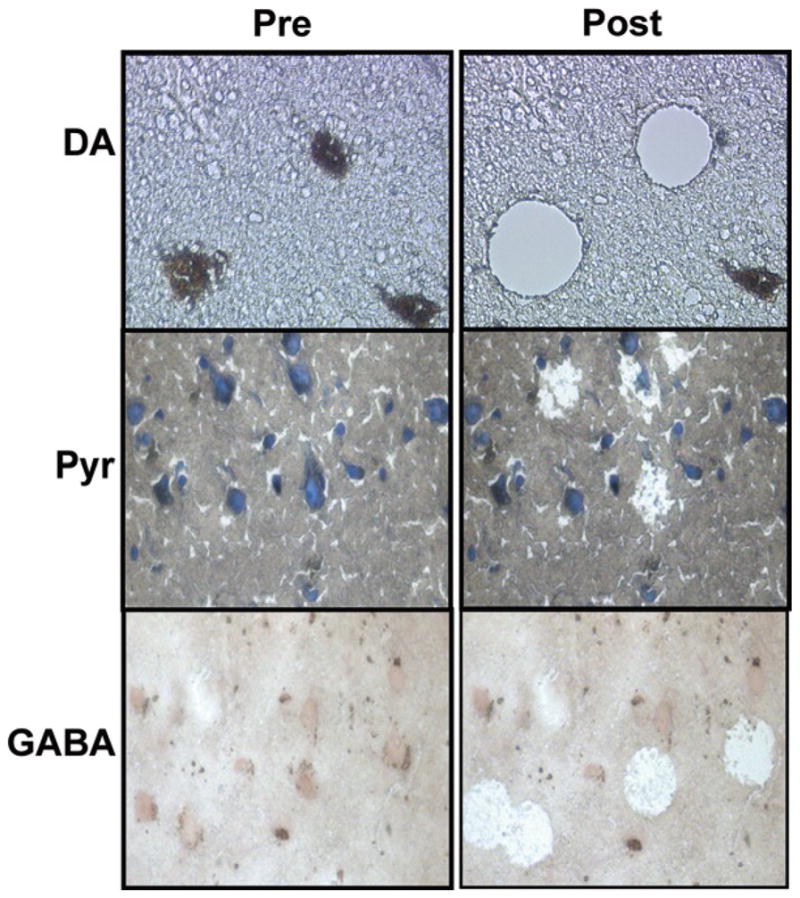
Examples of neurons before (Pre, left-hand side) and after (Post, right-hand side) laser microdissection (DA) or laser-capture microdissection (Pyr and GABA) from human postmortem brain tissue. DA dopaminergic neurons, Pyr pyramidal neurons, GABA parvalbumin-expressing, γ-aminobutyric acid neuron.
2. Materials
2.1. Tissue Preparation
RNaseZap® (Ambion®, TX).
Microslide box (VWR, PA).
Microm HM 505E cryostat (Thermo Scientific, MA).
Plain, uncharged glass slides for LCM (MDS Analytical Technologies, CA), or Leica Frame slides PET-membrane 1.4 μm for LMD.
2.2. Morphological Identification of Pyramidal Neurons with a Nissl Stain Procedure
HistoGene® LCM Frozen Section Nissl Staining Kit (MDS Analytical Technologies, CA). This kit contains not only the Nissl stain but also all the appropriate ethanols, xylene, and slide jars for the process. The slide jars can be reused after every 4–6 slides after removing RNases with RNaseZap® and wiping down with absolute ethanol.
Roche Protector RNase Inhibitor 40 U/μl (Roche, IN). This is added to most aqueous solutions as a precautionary method to prevent degradation of RNA through RNase activity. Store at −20°C and keep on ice while working with the product.
Liquid Blocker Super PAP pen (Daido Sangyo, Tokyo, Japan).
2.3. Rapid Immunohistochemistry Protocol for PV-Containing GABAergic Neuron Identification
0.05 M TBS (Tris-buffered saline) solution pH 7.4 (Do not add a sodium azide preservative, as this interferes with downstream processing).
0.05 M TBS, 0.2% Triton X-100 solution pH 7.4.
0.05M TBS, 0.2% Triton X-100, 1% BSA [Bovine Serum Albumin, Probumin® (Millipore, IL)]. Aliquot 50 ml into a Falcon tube, stored at 4°C.
Acetone (Fischer Scientific, NJ).
30% Hydrogen peroxide. Store at 4–8°C and only add to solutions just before needed (see Subheading 3).
Monoclonal anti-parvalbumin primary antibody (Mouse, Sigma-Aldrich®, MO). After rehydrating the antibody, make 20-μl aliquots and store at −20°C.
Peroxidase AffiniPure Donkey Anti-Mouse IgG secondary antibody (Jackson ImmunoResearch Laboratories, PA). Use same storage protocol as for primary antibody.
Roche Protector RNase Inhibitor 40 U/μl (Roche, IN).
NovaRED™ SK-4800 (Vector®, CA) stored at 4°C and protected from light. When using this solution, wear appropriate personal protection equipment, such as a mask. The rinsate from this solution should also be disposed of with care, as the toxicity and carcinogenicity are unknown.
Molecular Sieves (EMD™, NJ). These sieves are added to the second 100% ethanol, in the dehydration series, and are to be changed every 4–6 slides.
2.4. Laser (Capture) Microdissection: LMD or L(C)M
LEICA AS LMD apparatus fitted with 10, 20, and 40× magnification lenses used with Eppendorf thin-walled reaction tubes with domed cap (Fisher #951010022) for cell collection.
ArcturusXT™ LCM System (MDS Analytical Technologies, CA) fitted with 10, 20, and 40× magnification lenses. Be sure to install the LMD or LCM equipment in a humidity- and temperature-controlled environment, with humidity set below 40%, and kept at standard room temperature.
The ArcturusXT™ is used with CapSure® HS LCM Caps (MDS Analytical Technologies, CA), which should be kept in a dark place until needed, and GeneAmp® thin-walled reaction tube with domed cap (Applied Biosystems, CA). Only the product category N8010611 fits perfectly around the HS cap to prevent any leakage.
2.5. RNA Extraction and Downstream Processing of Neurons after LCM or LMD
mirVANA™ miRNA Isolation Kit (Ambion, Austin, TX) or PicoPure® RNA Isolation Kit (MDS Analytical Technologies, CA), used with the RNase-Free DNase Set (Qiagen, CA).
RiboAmp®HSPLUS with Turbo Labeling™ Biotin (MDS Analytical Technologies, CA), used with SuperScript™ III Reverse Transcriptase (Invitrogen, CA). When performing this protocol, use 0.5-ml tubes correlating with a 0.5-ml plate in the thermal cycler. This will increase your mRNA yield significantly.
3. Methods
In this protocol, the LCM method includes a staining step, either Nissl or IHC, and is specifically tailored for nitrogen-vapor flash-frozen human postmortem brain tissue. However, either staining protocol can also be combined with LMD. The parameters such as cryostat temperature, section thickness, and LCM laser specifications will vary according to the type of tissue used and the fixation method and should, therefore, be adjusted accordingly. For the IHC protocol, we noted in previous time study experiments that RNA in aqueous solutions started to degrade after 1.5 h. For this reason, our IHC protocol should be completed within 1 h. We have also added RNase Inhibitors to all solutions in both staining protocols, to further prolong RNA viability. We, therefore, recommend that the LCM/LMD capture period should follow the staining protocol directly and should also not exceed 1 h. For our LMD method, no IHC is involved, since DA neurons are neuromelanin-positive and can readily be detected by light microscopy.
In general, when working with RNA, it is important to eliminate any contaminating RNase activity, and surfaces should be cleaned with RNaseZap® and wiped down with absolute ethanol. Using plasticware that is nucleic acid-free and changing your gloves regularly (especially after touching areas that are not RNase-free) will help reduce the risk of RNase contamination.
3.1. Tissue Preparation
Remove possible RNase-contamination on glass slide with RNaseZap®, followed by wiping it down with absolute ethanol.
Remove the tissue block stored in the −80°C freezer and place it in a container with dry ice for transportation. Place a microslide box in the same container. Keep the samples continuously on dry ice.
Adjust the cryostat temperature to −17°C (see Note 1), install a new sectioning blade, and wipe the interior and sectioning blade with 100% ethanol in a perpendicular motion away from the razor edge. Set the slice thickness to 7–8 μm (see Note 2). Do not open cryostat cover more than halfway to avoid moisture from entering the cryostat.
After adhering the tissue block to the platform, let the block acclimate to the cryostat environment (temperature) for ~10–15 min.
Mount the tissue block to the specimen holder with as little “Optimum Cutting Temperature” (OCT) as possible, only touching the bottom of the specimen. Avoid covering the specimen with OCT along the sides. Only sections without OCT can be mounted for LCM.
Place specimen holder with mounted tissue such that the face of the tissue block is aligned with the blade’s edge and the thinnest part of the tissue is cut first. Bring the stage/block closer to the blade – enough to better determine how to angle the block in relation to the blade. Adjust the block as necessary. Once it appears aligned from all angles, begin cutting at 7–8 μm until the tissue reaches the blade and it cuts through the tissue. Based on where/how the blade cuts (i.e., the angle of intersection with the tissue), adjust the block such that the blade will cut the surface of the tissue evenly to produce mountable sections for LCM/LMD.
Use a brush to wipe away frost on the blade and stage, and pieces of tissue that cannot be mounted. Always wipe brush away from the razor edge (never along or against it!).
After acquiring a suitable section, adhere it to the plain glass (LCM) or the Leica Frame Slide (LMD) toward the center of the slide at room temperature and place immediately thereafter inside the cryostat or into microslide box on dry ice (see Note 3). Do not allow the slide to dry at room temperature.
Acquire another suitably smooth section (see Note 4), adhere it also toward the center of the same slide and place slide into the microslide box on dry ice. If cutting more than one specimen, use a new disposable microtome blade for each one. In addition, wipe down knife holder and stage with 100% ETOH in between specimens to avoid cross-contamination.
Cut enough sections for your entire experiment. In our case, four sections (or two slides) per case were sufficient to capture between 300–500 neurons. When you are finished sectioning, place the microslide box containing the sections into the −80°C freezer until needed for staining and/or LCM or LMD.
3.2. Morphological Identification of Pyramidal Neurons with a Nissl Stain Procedure1
Prepare the ethanol dehydration series (2× 75%, 2× nuclease-free water, 95%, 100%), adding 25 ml of each ethanol into the appropriate jars.
Add molecular sieves to the 100% ethanol jar and the xylene jar under the fume hood.
Place the first 75% ethanol jar into the −20°C freezer and all other jars on ice in an ice bucket.
Add 4 μl of RNase inhibitor to 400 μl of the HistoGene® stain in a 1.5-ml microcentrifuge tube (RNase-free) and place the tube on ice until needed.
Switch on the water bath and set to 42°C and place a rack containing a 50 ml Falcon tube in the water bath.
Remove two slides with two sections each from the −80°C freezer and defrost on a Kimwipe for 30 s or until the corners of the slides have defrosted.
With forceps, transfer the slides into the 75% ethanol jar that was originally placed in the −20°C freezer for 30 s.
After 30 s in the second jar containing nuclease-free water, place the slides on a Kimwipe.
Circle the sections on the slide with a PAP pen (see Note 5) and aliquot 90 μl of the HistoGene® stain with RNase inhibitor per section. Incubate at room temperature for 20 s.
Proceed through the dehydration series (nuclease-free water, 75%, 95%) until the final 100% ethanol dehydration step, leaving the slides in the final 100% ethanol jar containing the molecular sieves for 3 min (see Note 6).
Proceed to the fume hood and place the slides in the xylene jar containing the molecular sieves for 5 min, thereafter air-drying under the fume hood for 5 min (see Note 7). Proceed immediately with LCM, capturing approximately 500 cells.
3.3. Rapid Immunohistochemistry Protocol for PV-Containing GABAergic Neuron Identification
Prepare solutions necessary for protocol beforehand: 0.05 M TBS, 0.05 M TBS with 0.2% Triton X-100 solution, 0.05 M TBS with 0.2% Triton X-100 and BSA solution.
RNaseZap® and rinse with nuclease-free water all containers, including wash bottles and slide jars that will contain solutions.
Fill one wash bottle with TBS solution and another with nuclease-free water. Fill a zapped slide jar with the Triton X solution (refresh this solution after each use).
In a 1.5-ml microcentrifuge tube, aliquot 990 μl TBS solution. Cap and leave on the bench at room temperature.
In two 0.5-ml PCR tubes, aliquot 174 μl of the TBS/Triton X-100/BSA solution in each. Defrost one aliquot of both the primary and secondary antibodies and add 20 μl of the primary antibody to one 0.5-ml PCR tube and 20 μl of the secondary to the other 0.5-ml PCR tube containing the TBS/Triton X-100/BSA solution. Place these two PCR tubes on 4°C until needed.
Add 5 ml of nuclease-free water to a new 50-ml Falcon tube and place in rack on lab bench.
Prepare the ethanol dehydration series (50%, 75%, 95%, 2× 100%), adding 25 ml of each ethanol into the appropriate jars. Add molecular sieves to the second 100% ethanol jar and a glass slide jar filled with xylene under the fume hood.
Switch on the water bath set to 42°C and place a rack containing another 50-ml Falcon tube in the water bath.
Remove two glass slides with two sections each from the −80°C freezer and defrost on a Kimwipe for 30 s or until the corners of the slides have defrosted.
Using forceps, place the slightly defrosted slides into a glass dish filled 3/4 with acetone (or just enough to cover the slides). Cover the dish and incubate for 4 min to fix the tissue. This step should take place under a fume hood.
During this incubation time, prepare the endogenous enzyme block solution by adding 10 μl 30% hydrogen peroxide to the previously aliquotted TBS solution in the 1.5-ml microcentrifuge tube immediately before needed.
Remove slides and rinse with TBS from the wash bottle, being careful not to place a direct stream onto the sections. Thereafter, rinse with TBS/Triton X-100 solution by dunking slide into previously prepared slide jar a few times. Rinse again with TBS from wash bottle. Repeat for the other slide.
With a Kimwipe, remove excess liquid around the sections on the slide, being careful not to touch the section itself. The excess liquid could cause dilution of the antibody in subsequent steps. Place slides on an even surface, e.g., Kimwipe or the edge of an upside-down pipette tip container lid.
Pipette endogenous enzyme block onto slides – just enough to cover sections sufficiently (see Note 8) – and incubate for 5 min.
During this incubation period, add 6 μl of RNase inhibitor to the primary antibody aliquot and TBS/Triton X/BSA solution in the 0.5-ml PCR tube from the fridge, just prior to use.
Rinse the slides gently with nuclease-free water from wash bottle, again not aiming the stream directly onto the sections themselves. Wipe off excess liquid as before and place on leveled surface.
Pipette 95 μl of the primary antibody solution onto the beginning of the slide. Gently place a glass coverslip, with its edge touching the antibody solution on the slide. Slowly lower the coverslip onto the slide, distributing the liquid evenly over both sections on the slide, and avoid any bubble formation. Repeat for the other slide and incubate for 7 min.
During this incubation time, prepare the secondary antibody by adding 6 μl of RNase Inhibitor to the antibody aliquot and TBS/Triton X-100/BSA solution in the 0.5-ml PCR tube previously stored in the fridge.
After 7 min, rinse the slides as described in step 12 and remove excess liquid (see Note 9).
Apply the secondary antibody following the method described for the primary antibody in step 17 and incubate for 7 min.
During this incubation period, prepare the substrate chromogen (NovaRED) by following the instructions from the kit: Add three drops of reagent 1 to the previously prepared 5 ml nuclease-free water in the Falcon tube and mix, add two drops of reagent 2 and mix, add two drops of reagent 3 and mix. Only add hydrogen peroxide (two drops) to solution just prior to use for maximum results.
Place aluminum foil into a disused pipette container lid and curve aluminum foil to form sides (will look like a dish). Place Kimwipes in the middle of the “dish” and wet slightly with nuclease-free water.
Rinse slides as noted in step 12 and remove excess liquid. Place slides into the aluminum foil “dish” and lay down as flat as possible.
Pipette chromagen substrate solution onto slides, making sure to cover the sections. Use more than necessary to make sure that the sections do not dry out. Incubate for 12 min.
Gently rinse slides with the wash bottle containing nuclease-free water, again not directing the flow directly onto the sections, while collecting the rinsate into the aluminum foil “dish” and dispose appropriately.
Proceed with the dehydration series, by incubating the slides in each ethanol solution for 30 s beginning at 50%, and proceeding through to 100% ethanol. Leave the slides in the final 100% ethanol jar containing the molecular sieves for 3 min (see Note 10).
Proceed to the fume hood and place the slides in the xylene jar containing the molecular sieves for 2 min. Air-dry on a Kimwipe under the fume hood for 5 min. Proceed immediately with LCM, capturing approximately 350 cells.
3.4. Preparation of Tissue Slides for LMD of Dopamine Neurons
Since human midbrain dopaminergic neurons are neuromelanin positive, they are readily detectable in light microscopy (Fig. 1). Therefore, no additional staining steps are required. Prior to LMD the sectioned slides (Subheading 3.1) are dehydrated as described in Subheading 3.2, steps 10 and 11.
3.5. Laser Capture Microdissection of Pyramidal and PV GABAergic Neurons (see Footnote 1)
Load the slides and caps onto the Arcturus XT™ apparatus. Use the CapSure™ HS caps, but keep the program setting on Macro (see Note 11). Click on the box “Load with overview” to obtain an overview photo of each slide.
Adjust the brightness/focus at 2× magnification, to determine which section would be optimal for laser capture. Avoid tissue sections with excessive folding, but rather choose sections that are intact, smooth, and stained well, especially near the region of interest.
Place a cap over the general area where capturing. Still at the 2× magnification, make sure that the cap rails do not rest on any folds, as this will tilt the cap.
Next, confirm the location of the IR laser spot manually at the 40× magnification. If the spot (red beam) does not correlate with the center of the blue cross, this can be adjusted by right-clicking on the spot and selecting “located IR spot”.
Save the position of the cap by clicking on the plus sign at the position function. This way, if for any reason the cap must be removed and put back on the same location, the cap will always return to precisely the same spot that it was adjusted to before.
Enter these values into the control box: 70 into power and 16 into duration. Unclick the “auto move stage” option and make sure that the right size symbol correlates with the symbol on the panel to the right.
Select the capture circle option (bottom right) to select a pyramidal/PV GABAergic neuron that you want to test capture and then activate the laser by clicking on “test IR spot”.
The spot made by the laser should have a crisp dark ring around the object captured. If this ring is too light, the cell was not captured. If there is a dark spot in the middle of the dark ring, then the laser strength/duration is too great, and it might have a negative effect on the RNA present in the captured cell. Make sure that the ring is big enough to encompass the cell, but small enough that it does not include unwanted tissue or other cells (see Note 12).
Repeat the process on different parts of the tissue within the layer that you wish to capture, to check that the spot size does not differ depending on the location. Adjust accordingly.
Once the laser spot has been adjusted, identify pyramidal/PV GABAergic neurons for capture (see Note 13). We identify approximately 500/350 cells respectively per sample, which results in approximately 1–25 ng of total RNA per sample (see Note 14).
Once all the cells have been captured, move the cap to a different part of the slide that does not contain a section. Go back to where the cells were captured and make sure that at least 80% of the neurons were removed (see Note 15). If not, do not try to recapture the same cells, but locate the area where most of the cells were captured and capture more cells in the same area. Move the cap to the QC station.
Place the cap into the 0.5 ml-microcentrifuge tube from Applied Biosystems containing 50 μl of extraction buffer (PicoPure® RNA isolation kit). The cap has been designed to fit perfectly into this specific tube to prevent buffer from leaking.
Turn the assembly upside-down, making sure that extraction buffer covers the entire cap, and place it at the bottom of the 50-ml Falcon tube already present in the water bath set at 42°C. The neurons are incubated for 30 min to remove the tissue from the cap.
Thereafter, centrifuge the tube and cap assembly for 2 min at 800 × g. Remove the cap and store the remaining cell extract at −80°C until RNA extraction. As an extra precaution, you can reexamine the cap at the QC station on the laser-capturing apparatus to ensure that all neurons have been removed from the cap itself.
3.6. LMD of Dopamine Neurons
LMD is performed according to the manufacturer’s instructions. We use a LEICA AS LMD apparatus with manual or automated stage.
After setting up the hardware and software of the instrument place the FrameSlides with the tissue facing down and insert an Eppendorf thin-walled reaction tube with the domed cap in the tray and secure the tube in position.
Select the requested tube position and program, calibrate the laser, and adjust the laser to “line” setting to outline each individual cell (we capture at 40× magnification). Then, complete the capture in standard mode. While capturing use the “Move and Cut” mode to remove cells that are caught on the static of the slide. Click on the cell until it appears to have fallen (see Note 16).
After capturing click “no cap”. Unload and remove the tray and the slide, with the tube still in the tray, add 50 μl lysis buffer (Lysis/Binding buffer mirVana miRNA Ambion Isolation Kit) to the cap (see Note 17). Close the tube and remove from the tray; store the tube at −80°C.
3.7. RNA Extraction and Downstream Processing of Neurons after LCM or LMD
RNA of LCM Pyramidal/PVGABAergic neurons was isolated using the PicoPure® kit and LMD DA neurons with the mirVANA™ miRNA Isolation Kit. During RNA isolation with the PicoPure® kit, follow the appendix protocol for DNase treatment of the sample, as the elimination of genomic DNA is critical for accurate downstream applications such as qRT-PCR.
Amplify the mRNA (two rounds) obtained from pyramidal/GABAergic neurons with the RiboAmp®HSPLUS kit and provided protocol. During the second strand cDNA synthesis, our lab has made one slight modification to the manufacturer’s protocol. When the sample has been transferred from the tube to the purification column, centrifuge the tube originally containing the sample and transfer the extra microliter obtained after centrifugation into the purification column. Repeat this process during the second round of amplification (see Note 18).
To check the (m)RNA quality, confirm the concentration and purity (A260–A280 ratio, Table 1) with the NanoDrop spectrophotometer. As the amplified mRNA from the LCM neurons was used for microarray analysis, you should run an Experion StdSens LabChip® to ensure that the transcript length exceeds 600 nucleotides required for microarray hybridization.
RNA obtained from LMD material was used for microarrays (4, 5, 8) and miRNA profiling with a TaqMan® qRT-PCR based on the TaqMan® Human MicroRNA A Arrays (Applied Biosystems, CA) (Sonntag, unpublished).
Table 1.
A summary of subjects and RNA results of each neuron-type, matched for age, gender, and postmortem interval (PMI)
| ID | Diagnosis | Age | Gender | PMI | Cell number | A260/A280 | Amount of RNA (μg) | Assaycase |
|---|---|---|---|---|---|---|---|---|
| PYR1 | Control | 22 | M | 21.47 | 530 | 2.37 | 0.004 (69.3) | Microarray/qRT-PCR |
| PYR2 | Control | 75 | M | 20.25 | 520 | 2.44 | 0.014 (54.3) | Microarray/qRT-PCR |
| PYR3 | Control | 58 | F | 21.08 | 680 | 2.39 | 0.007 (50.1) | Microarray/qRT-PCR |
| PYR4 | Control | 71 | F | 20.50 | 530 | 2.47 | 0.012 (39.6) | Microarray/qRT-PCR |
| PYR5 | Schizophrenia | 36 | M | 17.97 | 530 | 2.44 | 0.001 (62.1) | Microarray/qRT-PCR |
| PYR6 | Schizophrenia | 62 | M | 10.75 | 630 | 2.34 | 0.002 (75.9) | Microarray/qRT-PCR |
| PYR7 | Schizophrenia | 67 | F | 21.80 | 540 | 2.52 | 0.002 (62.1) | Microarray/qRT-PCR |
| PYR8 | Schizophrenia | 88 | F | 13.33 | 550 | 2.47 | 0.002 (52.2) | Microarray/qRT-PCR |
| GABA1 | Control | 61 | M | 17.00 | 312 | 2.46 | (47.1) | Microarray/qRT-PCR |
| GABA2 | Control | 22 | M | 21.47 | 295 | 2.44 | (47.4) | Microarray/qRT-PCR |
| GABA3 | Control | 90 | F | 12.66 | 325 | 2.47 | (26.1) | Microarray/qRT-PCR |
| GABA4 | Control | 79 | F | 15.00 | 350 | 2.56 | (31.2) | Microarray/qRT-PCR |
| GABA5 | Schizophrenia | 56 | M | 21.83 | 712 | 2.48 | (22.8) | Microarray/qRT-PCR |
| GABA6 | Schizophrenia | 36 | M | 17.97 | 325 | 2.52 | (24.9) | Microarray/qRT-PCR |
| GABA7 | Schizophrenia | 93 | F | 6.92 | 359 | 2.59 | (25.8) | Microarray/qRT-PCR |
| GABA8 | Schizophrenia | 55 | F | 22.00 | 400 | 2.53 | (24.3) | Microarray/qRT-PCR |
| DA1 | Control | 79 | M | 20.92 | 360 | 1.69 | 0.17 | Microarray/qRT-PCR |
| DA2 | Control | 78 | M | 21.75 | 390 | 1.73 | 0.22 | Microarray/qRT-PCR |
| DA3 | Control | 72 | F | 18.25 | 300 | 1.58 | 0.19 | Microarray/qRT-PCR |
| DA4 | Control | 74 | F | 12.17 | 300 | 1.73 | 0.18 | Microarray/qRT-PCR |
| DA5 | PD | 79 | M | 23.42 | 350 | 1.73 | 0.51 | Microarray/qRT-PCR |
| DA6 | PD | 72 | M | 26.25 | 330 | 1.78 | 0.76 | Microarray/qRT-PCR |
| DA7 | PD | 81 | F | 22.75 | 300 | 1.44 | 0.27 | Microarray/qRT-PCR |
| DA8 | PD | 73 | F | 20.97 | 1300 | 1.82 | 0.68 | Microarray/qRT-PCR |
In all three neuron-types, four representative cases per treatment group or controls are listed. Assay represents the downstream processing used to analyze gene expression. The A260/A280 column contains sample purity ratios for postamplified mRNA for pyramidal and GABAergic neurons, but preamplified total RNA for the dopamine neurons. In the RNA amounts column, the numbers in brackets represent total amount of postamplified mRNA. No measurable preamplified RNA was detected for the GABA samples. DA dopaminergic neurons, GABA parvalbumin-expressing, γ-aminobutyric acid neuron, PD Parkinson disease, Pyr pyramidal neurons
3.8. Downstream Applications
After viable RNA is achieved with any of the above methodologies, it can be used to evaluate the expression profiles of cellular populations via a variety of technologies available today. These include microarray technology to determine the complete gene expression profile of the cell type of interest, or qRT-PCR to investigate or validate specific genes. For example, we have used the resulting RNA from the LMD protocol for microarray profiling of postmortem dopaminergic neurons in Parkinson’s disease subjects (4, 5), and this method was also used in combination with the Nissl staining technology to determine the expression profile of hippocampal GABAergic neurons (8). We have also analyzed the microarray data obtained from the pyramidal neurons in postmortem schizophrenia subjects and controls to discover altered underlying molecular pathways in this patient population (Pietersen et al., unpublished data).
Another recent application is the characterization of noncoding RNAs, such as microRNAs (miRNAs), which play an important role in regulating many aspects of gene transcription and translation (9). These molecules can be detected by sensitive high-throughput screening technologies, such as micro- or nanoarrays and qRT-PCR, which require only small amounts of RNA in the nanogram or picogram range, respectively. As miRNAs are thought to play a profound role in the fine-tuning of neuronal cell function (10, 11), the above described methodologies can provide material from single cells or a homogeneous cell population to gain insight into their molecular properties in health and disease (1).
Acknowledgments
This work was supported by NIH grants MH080272 and MH076060 (Woo) and R21NS067335 (Sonntag).
Footnotes
Protocol originally published in JoVE: Pietersen CY, Lim MP, Woo TUW (2009). Obtaining High Quality RNA from Single Cell Populations in Human Postmortem Brain Tissue. JoVE. http://www.jove.com/index/details.stp?id=1444, doi: 10.3791/1444.
As temperature can also influence tissue smoothness, try to keep the temperature above −20°C. Temperatures lower than this can result in tissue cracking.
You must be able to visualize the structure you wish to capture after staining. In our case, neurons are identified via a stain. If you cut the sections too thin, you might not be able to adequately visualize these cells. If the section is too thick, cells designated for capture will not fully adhere to the cap, and part of the cell will remain on the slide, thereby decreasing RNA yield.
The tissue moves between different temperature states during sectioning between the dry ice (approximately −78°C), cryostat, room temperature, and eventually the −80°C freezer environments. In order to reduce the temperature gradient, do not raise the temperature of the cryostat to more than −15°C, as it could affect RNA integrity.
You must be able to cut the tissue into smooth sections without folding. In order to accurately capture the designated area, smooth sections are key. Too thick or too thin sections could result in folding or tearing, respectively.
The PAP pen helps to concentrate the staining solution onto the section. However, with the plain glass slides, it is not always necessary to use it, as the staining solution appears to cling only to the section itself.
The molecular sieves draw out any excess moisture that might be present in the absolute ethanol and xylene solutions. This helps to dehydrate the sections completely, which is a necessary component for LCM or LMD.
Check that the sections are completely dry before proceeding with LCM. If you are still not able to capture cells after dehydration and air-drying, repeat the absolute ethanol, xylene, and air-drying steps to ensure proper dehydration.
We have opted not to use a humid chamber during the IHC protocol, as it is not necessary for such short incubation times. However, whenever applying a solution without a coverslip onto the sections, apply enough to ensure that the sections do not dry out during the incubation time.
The glass coverslips should come off while rinsing. Do not manually try to remove the coverslips, as this will cause some of the tissue section to scrape off. Adding enough liquid between the slide and coverslip, either primary or secondary antibody, will ensure a smooth coverslip removal.
We extended the duration of the final dehydration of the sections in 100% ethanol from 30 s to 3 min, and also added molecular sieves to the jar to ensure sufficient dehydration of the tissue, to obtain adequate tissue lift and to preserve RNA integrity. Molecular sieves are also added to the xylene solution for this reason.
As the HS cap is made for capturing single cells, it only has a small area designated for capture, which can limit the section area from which you would like to capture. To alleviate this issue, keep the settings on the ArcturusXT™ software on Macro, while using the HS cap, to capture cells from a larger section area.
The spot size should be specific to your cell size, i.e., not too big that it is nonspecific and small enough to be as specific as possible. At the same time, the laser strength should still be strong enough to be able to capture the cell. Conversely, if the laser strength is too high, the spot size will enlarge and might not be specific to the cell of interest.
Do not include cells that have other cell types directly next to them, as these may also be captured and you will no longer have a homogeneous cell population. Also, try to limit the amount of surrounding tissue you capture with the cell of interest by decreasing the spot size, while still ensuring adequate capture of that cell.
We also usually only use one section to reduce the amount of capture time, as the cap has to be readjusted for each section. Although, if you have not succeeded in capturing all cells in the allotted time, you can repeat the stain and capture from different sections from the same case.
Sometimes, during humid weather or particularly aqueous procedures, such as IHC, the tissue is not completely dry. In this case, and if additional dehydration does not help, use the Macro cap as it is in direct contact with the tissue and, therefore, adheres to the cells more easily. Keep in mind, however, that this cap often picks up unwanted tissue “debris” for the same reason. In this case, use the prep strips that are provided, which remove the debris from the surface of the section prior to microdissection.
We found that larger pieces of tissue are more likely to cling to the slide via static electricity, so avoid capturing more than one cell at a time. When cells do reattach to the slide, they are most easily removed by directing the laser toward the center of the cell.
We found that lysis buffer dries out quickly, so we recommend adding the buffer after capturing.
We recommend performing the amplification procedure using the 0.5-ml tubes provided, and subsequently, performing the thermal cycling with a corresponding 0.5-ml block to increase the RNA yield.
References
- 1.Sonntag KC. miRNAs and deregulated gene expression networks in neurodegeneration. Brain Research. 2010;1338:48–57. doi: 10.1016/j.brainres.2010.03.106. [DOI] [PMC free article] [PubMed] [Google Scholar]
- 2.McClain KL, Cai YH, Hicks J, Peterson LE, Yan XT, Che S, Ginsberg SD. Expression profiling using human tissues in combination with RNA amplification and microarray analysis: assessment of Langerhans cell histiocytosis. Amino Acids. 2005;28:279–90. doi: 10.1007/s00726-005-0177-x. [DOI] [PubMed] [Google Scholar]
- 3.Pietersen CY, Lim MP, Woo TU. Obtaining high quality RNA from single cell populations in human postmortem brain tissue. J Vis Exp. 2009;6:1444. doi: 10.3791/1444. pii. [DOI] [PMC free article] [PubMed] [Google Scholar]
- 4.Simunovic F, Yi M, Wang Y, Macey L, Brown LT, Krichevsky AM, Andersen SL, Stephens RM, Benes FM, Sonntag KC. Gene expression profiling of substantia nigra dopamine neurons: further insights into Parkinson’s disease pathology. Brain. 2009;132:1795–809. doi: 10.1093/brain/awn323. [DOI] [PMC free article] [PubMed] [Google Scholar]
- 5.Simunovic F, Yi M, Wang Y, Stephens R, Sonntag KC. Evidence for gender-specific transcriptional profiles of nigral dopamine neurons in Parkinson disease. PLoS One. 2010;5:e8856. doi: 10.1371/journal.pone.0008856. [DOI] [PMC free article] [PubMed] [Google Scholar]
- 6.Charboneau L, Paweletz CP, Liotta LA. Laser capture microdissection. Curr Protoc Cell Biol. 2001;Chapter 2(Unit 2):5. doi: 10.1002/0471143030.cb0205s10. [DOI] [PubMed] [Google Scholar]
- 7.Edwards RA. Laser capture microdissection of mammalian tissue. J Vis Exp. 2007:309. doi: 10.3791/309. [DOI] [PMC free article] [PubMed] [Google Scholar]
- 8.Benes FM, Lim B, Matzilevich D, Walsh JP, Subburaju S, Minns M. Regulation of the GABA cell phenotype in hippocampus of schizophrenics and bipolars. Proc Natl Acad Sci U S A. 2007;104:10164–9. doi: 10.1073/pnas.0703806104. [DOI] [PMC free article] [PubMed] [Google Scholar]
- 9.Bartel DP. MicroRNAs: target recognition and regulatory functions. Cell. 2009;136:215–33. doi: 10.1016/j.cell.2009.01.002. [DOI] [PMC free article] [PubMed] [Google Scholar]
- 10.Barbato C, Giorgi C, Catalanotto C, Cogoni C. Thinking about RNA? MicroRNAs in the brain. Mamm Genome. 2008;19:541–51. doi: 10.1007/s00335-008-9129-6. [DOI] [PubMed] [Google Scholar]
- 11.Schratt G. Fine-tuning neural gene expression with microRNAs. Curr Opin Neurobiol. 2009;19:213–9. doi: 10.1016/j.conb.2009.05.015. [DOI] [PubMed] [Google Scholar]