Abstract
We assess the geographic coverage and spatial clustering of drug users recruited through respondent-driven sampling (RDS) and discuss the potential for biased RDS prevalence estimates. Illicit drug users aged 18–40 were recruited through RDS (N = 401) and targeted street outreach (TSO) (N = 210) in New York City. Using the Google Maps API™, we calculated travel distances and times using public transportation between each participant’s recruitment location and the study office and between RDS recruiter–recruit pairs. We used K function analysis to evaluate and compare spatial clustering of (1) RDS vs. TSO respondents and (2) RDS seeds vs. RDS peer recruits. All participant recruitment locations clustered around the study office; however, RDS participants were significantly more likely to be recruited within walking distance of the study office than TSO participants. The TSO sample was also less spatially clustered than the RDS sample, which likely reflects (1) the van’s ability to increase the sample’s geographic heterogeneity and (2) that more TSO than RDS participants were enrolled on the van. Among RDS participants, individuals recruited spatially proximal peers, geographic coverage did not increase as recruitment waves progressed, and peer recruits were not less spatially clustered than seeds. Using a mobile van to recruit participants had a greater impact on the geographic coverage and spatial dependence of the TSO than the RDS sample. Future studies should consider and evaluate the impact of the recruitment approach on the geographic/spatial representativeness of the sample and how spatial biases, including the preferential recruitment of proximal peers, could impact the precision and accuracy of estimates.
Keywords: Spatial analysis, Respondent-driven sampling, Targeted sampling, Geographic coverage, Spatial clustering, Illicit drug users
Introduction
Respondent-driven sampling (RDS) is a recruitment and analytic strategy used when obtaining a representative, probability-based sample of the target population is unfeasible. RDS is a modified version of chain referral sampling often used to recruit populations at increased risk for HIV (e.g., illicit drug users) when stigma and/or illegality precludes access to a sampling frame. By January 2013, RDS had been used by researchers in over 80 countries1 and is currently used by the National HIV Behavioral Surveillance System in 25 metropolitan statistical areas in the USA.2,3 A small group of “seeds” are recruited by the research staff to initiate peer recruitment. Seeds are purposively selected to reflect the diversity of the underlying population and/or to ensure that specific subgroups are included in the sample. Seeds receive a limited number of coupons to recruit their peers; eligible peer recruits receive the same number of coupons to recruit their peers, and the peer referral process continues through successive waves until the final sample size is reached.4 Participants are compensated for peer recruitment and study participation. In theory and typically in practice, sample equilibrium is reached before recruitment ends. At sample equilibrium, the final sample should be (1) independent of the seeds initiating peer recruitment and (2) more geographically diverse than those initially selected.
RDS gained popularity as a recruitment strategy because of its ability to recruit members of high-risk populations quickly and its perceived superiority over alternative recruitment approaches. While RDS is thought to generate a more representative sample and recruit more geographically remote individuals than alternative recruitment strategies for “hidden” populations, few studies have examined this hypothesis by comparing samples recruited simultaneously using alternative recruitment approaches.
RDS vs. Targeted Sampling Approaches
One common alternative recruitment strategy is targeted street outreach (TSO) which uses ethnographic mapping strategies to identify recruitment neighborhoods (e.g., those with high concentrations of the target population); in some instances, sampling quotas are applied to each targeted neighborhood5. One study comparing people who inject drugs recruited through RDS and targeted sampling reported a comparable sample distribution by residential zip code for each strategy; however, the respondent-driven sample had a significantly lower proportion of participants residing in more impoverished, predominately African American, and geographically isolated zip codes.6 They attributed the increased diversity of the targeted sample to the extensive and integral ethnographic research which guided their targeted sampling approach.6 In another study, Broadhead and colleagues compared a sample recruited for a peer-driven intervention (RDS-recruited) with one recruited for a traditional outreach intervention and reported that the peer-driven sample was more geographically diverse.7
RDS Recruitment from a Spatial Perspective
The validity of the RDS estimator depends on several assumptions;4,8 one frequently evaluated assumption is that individuals recruit peers randomly (e.g., with respect to demographic characteristics, the outcome of interest, risk behaviors, relationship characteristics, and geography). Several studies reported evidence of nonrandom peer recruitment,9–16 of which only a few focused on nonrandom peer recruitment based on spatial/geographic factors. Some speculate that geographic sampling biases could result from seed choice,17 preferential recruitment of spatially proximal peers,18–20 and overrecruitment of peers residing closer to the interview location21,22 or with better transportation access.6,14 Several studies have acknowledged RDS’ ability to recruit geographically diverse samples.7,14,21,23 In one study, the geographic diversity of the sample increased as recruitment progressed;21 however, several geographic areas known to have members of the target population were not represented in the final sample.21 The presence of nonrandom recruitment based on spatial factors may affect the validity and accuracy of resulting prevalence estimates.
Study Objectives
This analysis examined two hypothesis-driven objectives (see Appendix 1 for more detail on each objective’s rationale, hypotheses, analytic approach, and key findings). The first objective was to compare the geographic coverage and spatial clustering of two samples of drug users recruited concurrently via RDS and TSO in New York City. We hypothesized that at sample equilibrium, RDS participants would cover a wider geographic area and be less spatially clustered than TSO participants. The second objective was to examine RDS recruitment from a spatial perspective. To do this, we compared the geographic coverage and spatial dependence of seeds and peer recruits. We hypothesized that (1) peer recruits would cover a wider geographic area than seeds and that the area covered by recruits would increase as recruitment progressed, (2) recruiter–recruit travel distance and time would not vary by the recruit’s location or his/her proximity to the study office, and (3) peer recruits would be less spatially clustered than seeds. To better understand the impact of observed spatial preferences in RDS recruitment on the HIV prevalence estimates in our RDS sample, we conducted additional analyses to (1) examine spatial differences in recruitment behavior by self-reported HIV status and (2) compare weighted HIV prevalence estimates in the RDS sample with New York City HIV surveillance data.24
Methods
The data for this analysis were collected as part of the longitudinal study, “Social Ties Associated with Risk of Transition” into injection drug use (START), which aimed to identify risk factors for initiating injection drug use among active heroin, crack, and cocaine users (18–40 years of age) in New York City. Detailed study procedures and eligibility criteria are described elsewhere.13 Participants were recruited concurrently through RDS (N = 403; 46 seeds, 357 peer recruits) and TSO (N = 217) between July 2006 and June 2009 and were enrolled/interviewed at a stationary study office in Harlem (88 %) or at one of seven mobile van sites (12 %). Recruitment of RDS seeds and TSO participants followed a targeted sampling plan25 which was developed for HIV prevention studies and has been used to recruit those at increased risk for HIV. Van sites rotated weekly and were located in Queens (N = 2), Far Rockaway (N = 2), Jamaica (N = 1), Brooklyn (N = 1), and Manhattan’s lower east side (N = 1). Of note, 29 % of TSO and 3 % of RDS participants (P < 0.0001) were enrolled on the van. Because recruitment locations for two RDS and seven TSO participants could not be geocoded, the final sample size for analysis was 611 (401 RDS, 210 TSO).
All participants provided informed consent and completed a 90-min interviewer-administered questionnaire approved by the institutional review boards at Columbia University and the New York Academy of Medicine. Surveys ascertained demographic variables, recruitment location, self-reported HIV status, drug/sex risk behaviors, and social network characteristics.26 All participants received $30 and a round-trip Metrocard for completing the questionnaire. RDS participants received three coupons to recruit drug-using peers; participants received $10 for each eligible peer recruit and an additional $10 if three eligible peers were recruited.
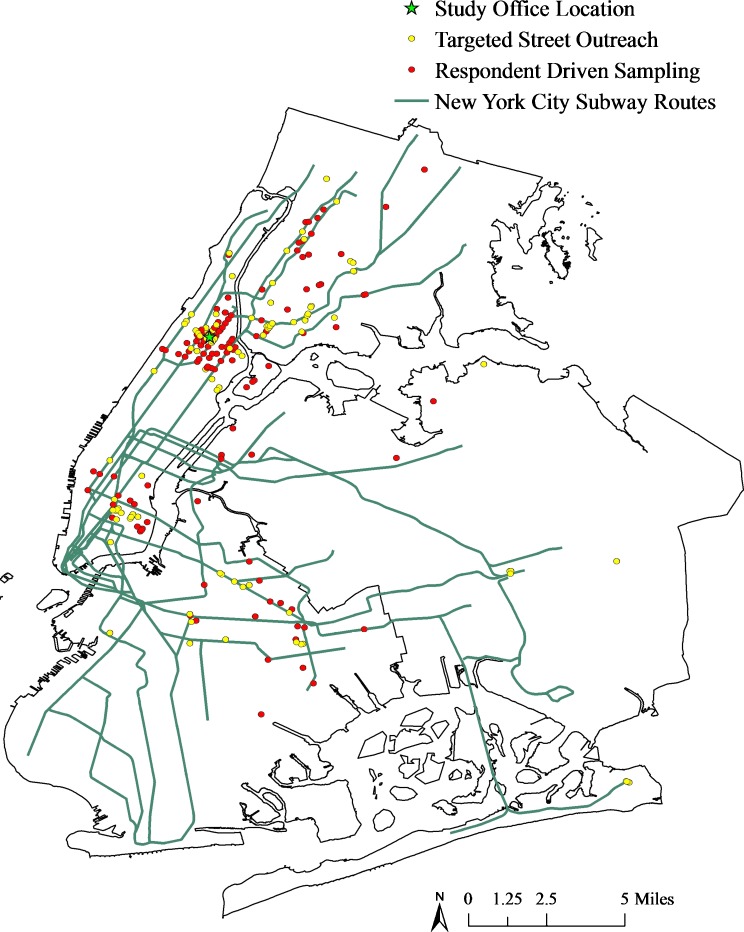
Because New York City residents rely heavily on public transportation and most study participants reported being recruited near subway lines (Fig. 1), we calculated the travel distance (miles) and time (minutes) via public transportation between (1) each participant’s recruitment location and the study office (excluding participants enrolled on the van) and (2) recruitment locations for recruiter–recruit pairs (RDS participants only) using the Google Maps API™ and a custom-written R code.27 Because there were significant differences in the proportion of RDS and TSO participants enrolled in the study on the van (noted above), we conducted separate analyses on samples including and excluding participants enrolled on the van (hereafter referred to as “van recruits”) when comparing the geographic coverage and spatial clustering of RDS and TSO participants.
FIG. 1.
Map of 611 START study participants (RDS = 401, TSO = 210) by recruitment location and recruitment strategy with a New York City subway map overlaid. RDS participants are in red, TSO participants are in yellow, the stationary study office is represented with a green star, and subway lines are in dark green.
Data Analysis
Geographic Coverage (RDS vs. TSO)
To identify areas where individuals were recruited with RDS only, TSO only, both, and neither strategy, we mapped individuals’ recruitment locations by recruitment strategy in ArcMap 10.1,28 created a 10 × 10 grid for New York City (excluding Staten Island), and calculated the number and proportion of RDS and TSO participants in each boxed area (with van recruits included and excluded, separately). We also compared the average distance and time between one’s recruitment location and the study office for RDS and TSO participants enrolled at the study office (van recruits excluded) using t tests and permutation tests (RDS/TSO location labels were randomly permuted, and 1,000 samples equal in size to the RDS sample were randomly generated without replacement) using SAS software v9.3.29
Spatial Clustering (RDS vs. TSO)
Spatial clustering for RDS and TSO participants was assessed using K function analysis with the SPLANCS package in R.30 To examine differences in the extent and resolution of spatial clustering for each, we tested the null hypothesis, H0: KRDS(h) = KTSO(h). Monte Carlo simulations were used to generate 95 % confidence envelopes for the difference in K functions, KRDS(h) – KTSO(h), for a range of distances, h, based on randomly permuting recruitment strategy location labels to provide the corresponding null distribution.31
Geographic Coverage (RDS Seeds vs. Peer Recruits)
We mapped RDS seeds and peer recruits by recruitment location and compared the distance and time traveled (1) to the study office (van recruits excluded) and (2) to recruit peers (RDS seeds vs. peer recruits and by recruitment wave). Finally, for each boxed area, we calculated and mapped the average distance/time traveled by recruiters using ArcMap 10.1.28
Spatial Clustering (RDS Seeds vs. Peer Recruits)
Spatial clustering for RDS seeds and peer recruits was assessed using K function analysis, and the null hypothesis, H0: Kseeds(h) = Kpeer recruits(h), was evaluated using the same method described above.31
Exploring the Potential for Biased HIV Prevalence Estimates (RDS Sample)
Because spatial patterns in RDS recruitment/enrollment emerged in the above analyses, we conducted additional analyses to explore the potential for biased HIV prevalence estimates related to spatial preferences in peer recruitment for the RDS sample. We examined the association between travel distance and time between recruiter–recruit pairs and (1) recruiter’s HIV status, (2) recruit’s HIV status, and (3) recruitment of peers with the same HIV status using SAS software v9.3.29. Finally, we compared (1) 2010 U.S. Census tract-level demographic characteristics for census tracts where participants were and were not recruited and (2) RDS-weighted HIV prevalence estimates obtained with RDSAT v 7.1.4632 with those obtained from New York City HIV surveillance data,24 by zip code.
Results
Geographic Coverage (RDS vs. TSO)
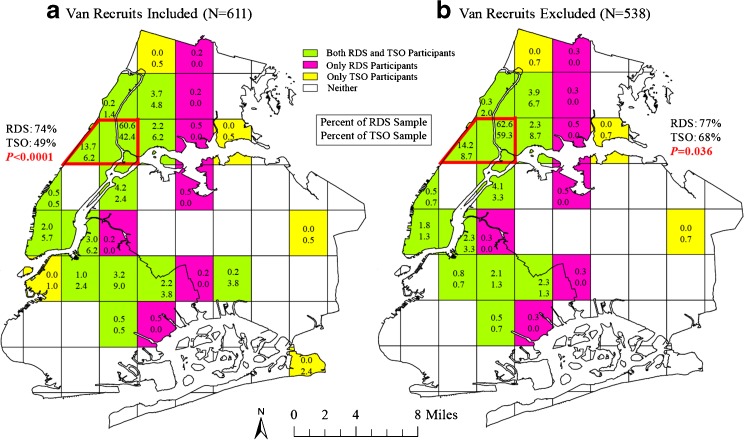
Recruitment locations for RDS and TSO participants overlapped substantially (Fig. 2), which is consistent with findings from Kral and colleagues.6 All participants traveled <40 min (22 miles) by public transportation to the study office. The proportion of the RDS or TSO sample in a boxed area where only one strategy recruited individuals was low (including van recruits, 2 % of the RDS sample and 5 % of the TSO sample; excluding van recruits, 3 % of the RDS sample and 2 % of the TSO sample). Regardless of the inclusion/exclusion of van recruits, the TSO sample covered a wider geographic area, and areas reached only by TSO were furthest from the study office. Additionally, RDS participants were significantly more likely than TSO participants to be recruited from the two boxed areas within walking distance of the study office. When van recruits were included, 74 % of RDS compared to 49 % of TSO participants were recruited in this area (P < 0.0001). When van recruits were excluded, the two samples looked more similar, but there were still significant differences in the geographic coverage; 77 % of RDS compared with 68 % of TSO participants were recruited within walking distance of the study office (P = 0.036).
FIG. 2.
Geographic coverage of RDS and TSO participants. Regions of New York City where participants were recruited through only RDS (pink), only targeted street outreach (yellow), both (green), and neither strategy (white) are displayed. All blocks are of equal area and are approximately 3 miles by 2.5 miles (length × width). Because the number of RDS and TSO participants enrolled in the study differed, the top number in each box represents the percent of the RDS sample recruited in that area and the bottom number in each box represents the percent of the TSO sample recruited in that area.
As seen in Table 1, the distance and time traveled by participants to the study office (van recruits excluded) were not significantly different by recruitment strategy (miles: P = 0.72 and minutes: P = 0.24; observed medians were within the interquartile ranges for the distribution of medians from 1,000 simulated samples). However, on average, RDS participants traveled fewer miles and minutes between their recruitment location and the study office (RDS median = 1.0 miles (4.8 min); TSO median = 2.0 miles (7.9 min)).
TABLE 1.
Distance (miles) and time (minutes) traveled to the study office using public transportation by TSO and RDS study participants and distance and time traveled between RDS recruiters and recruits
| Median | Interquartile range | Mean | Range | |
|---|---|---|---|---|
| Overall (N = 538) | ||||
| Distance on metro to office (miles)a | 1.1 | (0.4, 3.0) | 2.7 | (0.0, 21.6) |
| Time on metro to office (min)a | 4.8 | (2.7, 8.6) | 7.4 | (0.1, 39.1) |
| TSO (N = 150) | ||||
| Distance on metro to office (miles) a, b | 2.0 | (0.4, 3.2) | 2.8 | (0.0, 20.4) |
| Time on metro to office (min) a, c | 7.9 | (2.7, 10.6) | 8.0 | (0.1, 39.1) |
| RDS (N = 388) | ||||
| Distance on metro to office (miles)a | 1.0 | (0.4, 3.0) | 2.6 | (0.0, 21.6) |
| Time on metro to office (min)a | 4.8 | (2.7, 8.4) | 7.2 | (0.1, 39.1) |
| Distance on metro to recruiter (miles)d | 2.1 | (1.0, 4.8) | 3.5 | (0.0, 22.2) |
| Time on metro to recruiter (min)d | 7.5 | (4.0, 11.6) | 9.1 | (0.0, 32.7) |
| RDS seeds (N = 37) | ||||
| Distance on metro to office (miles)a | 1.0 | (0.4, 3.3) | 2.4 | (0.0, 20.4) |
| Time on metro to office (min)a | 5.1 | (2.1, 11.7) | 7.4 | (0.1, 39.1) |
| RDS peer recruits (N = 348) | ||||
| Distance on metro to office (miles)a | 1.0 | (0.4, 3.0) | 2.7 | (0.0, 21.6) |
| Time on metro to office (min)a | 4.8 | (2.7, 8.4) | 7.2 | (0.1, 33.7) |
| Distance on metro to recruiter (miles)d | 2.1 | (1.0, 4.8) | 3.5 | (0.0, 22.2) |
| Time on metro to recruiter (min)d | 7.5 | (4.0, 11.6) | 9.1 | (0.0, 32.7) |
| RDS waves 1–3 (N = 145) | ||||
| Distance on metro to office (miles)a | 0.9 | (0.3, 3.0) | 2.9 | (0.0, 21.6) |
| Time on metro to office (min)a | 4.3 | (2.1, 8.4) | 7.5 | (0.1, 33.7) |
| Distance on metro to recruiter (miles)d | 3.0 | (1.2, 5.1) | 4.2 | (0.0, 22.2) |
| Time on metro to recruiter (min)d | 9.6 | (4.6, 13.8) | 10.4 | (0.0, 32.7) |
| RDS waves 4–6 (N = 101) | ||||
| Distance on metro to office (miles)a | 1.1 | (0.4, 3.0) | 2.8 | (0.0, 18.5) |
| Time on metro to office (min)a | 4.3 | (2.8, 8.4) | 7.2 | (0.1, 33.4) |
| Distance on metro to recruiter (miles)d | 1.7 | (0.9, 3.2) | 3.2 | (0.0, 17.2) |
| Time on metro to recruiter (min)d | 6.0 | (3.8, 11.1) | 8.7 | (0.0, 29.5) |
| RDS waves 7–14 (N = 109) | ||||
| Distance on metro to office (miles)a | 1.0 | (0.9, 3.0) | 2.2 | (0.0, 14.2) |
| Time on metro to office (min)a | 4.8 | (4.3, 8.4) | 6.8 | (0.1, 28.6) |
| Distance on metro to recruiter (miles)d | 1.8 | (1.0, 3.2) | 3.1 | (0.0, 13.1) |
| Time on metro to recruiter (min)d | 5.4 | (3.6, 9.9) | 7.8 | (0.0, 27.4) |
| Distance and time traveled by RDS participants to the study office by HIV statusa, e | ||||
| Distance on metro to office (miles) for HIV-positive participants (N = 38) | 0.8 | (0.4, 5.2) | 3.1 | (0.0, 18.5) |
| Time on metro to office (min) for HIV-positive participants (N = 38) | 3.8 | (2.7, 16.2) | 8.4 | (0.1, 22.4) |
| Distance on metro to office (miles) for HIV-negative participants (N = 322) | 1.03 | (0.4, 3.0) | 2.6 | (0.0, 21.6) |
| Time on metro to office (min) for HIV-negative participants (N = 322) | 4.8 | (2.7, 8.4) | 7.1 | (0.1, 39.1) |
| Distance and time traveled to RDS recruit by recruiter’s HIV statusd, f | ||||
| Distance on metro to recruit (miles) for HIV-positive recruiters (N = 40) | 3.9 | (1.5, 7.3) | 5.0 | (0.0, 18.2) |
| Time on metro to recruit (min) for HIV-positive recruiters (N = 40) | 10.3 | (6.3, 18.0) | 12.0 | (0.0, 32.7) |
| Distance on metro to recruit (miles) for HIV-negative recruiters (N = 276) | 1.9 | (1.0, 4.5) | 3.3 | (0.0, 17.6) |
| Time on metro to recruit (min) for HIV-negative recruiters (N = 276) | 6.9 | (3.9, 11.3) | 8.7 | (0.0, 32.7) |
aVan recruits were not included in these calculations
b P value (RDS vs. TSO) for distance on metro to office (miles) = 0.715
c P value (RDS vs. TSO) for time on metro to office (minutes) = 0.235
dAlthough there were 357 peer recruits in the respondent-driven sample, two individuals could not be geocoded, which resulted in the loss of two ties. Additionally, four individuals who were initially eligible to participate in the study were dropped due to inconsistencies in their self-reported drug use, which resulted in the deletion of seven additional ties. Therefore, the final sample size for recruiter–recruit distance calculations was 348
e P value (HIV-positive vs. HIV-negative RDS participants) for distance on metro to office (miles) = 0.465 and P value (HIV-positive vs. HIV-negative RDS participants) for time on metro to office (minutes) = 0.308
f P value (HIV-positive vs. HIV-negative RDS recruits) for distance on metro to recruit (miles) = 0.008 and P value (HIV-positive vs. HIV-negative RDS participants) for time on metro to recruit (minutes) = 0.007
Spatial Clustering (EDS vs. TSO)
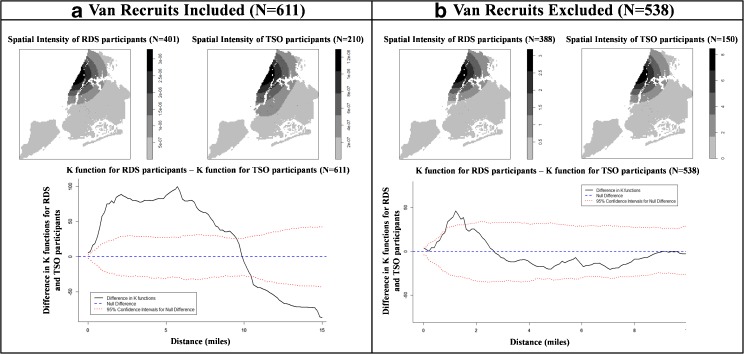
The spatial intensity maps in Fig. 3 demonstrate that the recruitment locations for both RDS and TSO participants cluster around the study office (P < 0.0001). When van recruits were included, the RDS sample was more spatially clustered than the TSO sample (P < 0.05 for individuals <10 miles apart), which contradicts our hypothesis. However, the difference in spatial clustering between RDS and TSO participants was not significant when the analysis was restricted to participants enrolled at the study office (van recruits excluded).
FIG. 3.
Comparing the spatial intensity of RDS and TSO respondents with van recruits a included and b excluded. The maps display the spatial intensity of RDS and TSO participants (by recruitment location), respectively. Darker shades indicate greater clustering. The graphs below display the difference between K functions for RDS and TSO participants (solid black line). When the difference in K functions is positive, RDS participants are more spatially clustered than TSO participants; when the difference in K functions is negative, TSO participants are more spatially clustered than RDS participants. The 95 % confidence envelopes for a null difference in the K functions (H0: K RDS(h) = K TSO(h)) (dotted red lines) are based on 1,000 Monte Carlo simulations. At distances where the difference in K functions exceeds the 95 % confidence envelopes, differential spatial clustering is observed.
Geographic Coverage (RDS Seeds vs. Peer Recruits)
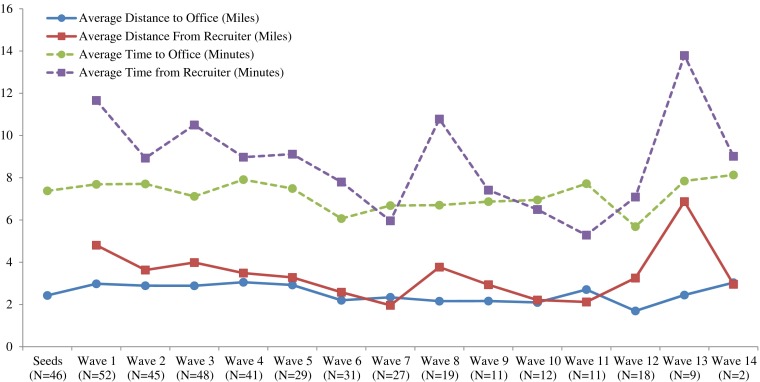
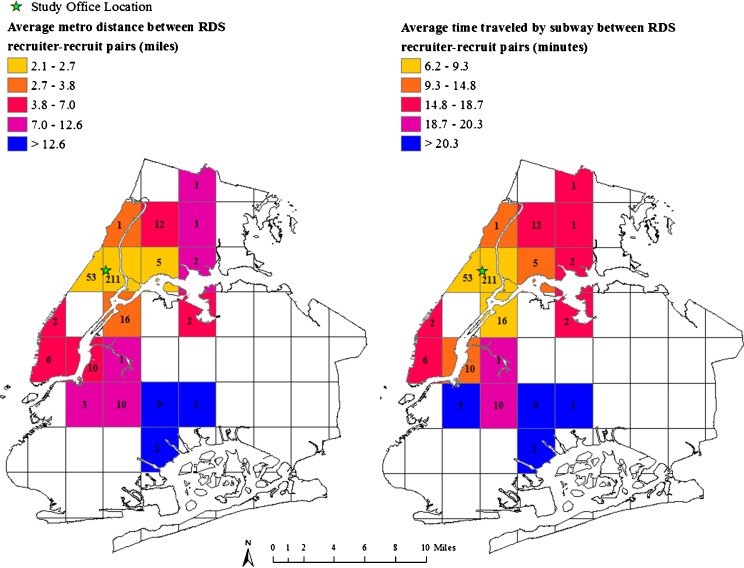
Overall, RDS participants tended to recruit spatially proximal peers (e.g., recruit–recruiter distance was a median of 2.1 miles (interquartile range (IQR), 1.0–4.8) and 7.5 min (IQR, 4.0–11.6)). As seen in Table 1 and Fig. 4, there were no significant differences in the travel distance or time between (a) recruiter–recruit pairs or (b) RDS participants and the study office (van recruits excluded) by recruitment wave. There was no significant difference in the distance or time traveled by RDS seeds and peer recruits to the study office; seeds traveled a median of 1.0 miles (5.1 min), whereas peer recruits traveled a median of 1.0 miles (4.8 min) (miles: P = 0.13 and minutes: P = 0.12) (Table 1). As seen in Fig. 5, those recruited further from the study office recruited peers who were further from them (miles: rho = 0.37; P < 0.0001 and minutes: rho = 0.31; P < 0.0001). Recruiters traveling further to recruit peers recruited fewer peers than those traveling shorter distances (miles: rho = −0.15; P = 0.04 and minutes: rho = −0.15; P = 0.03).
FIG. 4.
Average public transportation travel distance (miles) and time (minutes) between RDS study participants and the study office (van recruits excluded; N = 388) and between RDS recruits and his/her recruiter by wave (N = 348).
FIG. 5.
Average distance (miles) and time (minutes) by public transportation (per blocked area) between RDS recruits and his/her recruiter by recruit’s recruitment location (N = 348). Although there were 357 peer recruits in the respondent-driven sample, two individuals could not be geocoded, which resulted in the loss of two ties. Additionally, four individuals who were initially eligible to participate in the study were removed from the analysis due to inconsistencies in their self-reported drug use, which resulted in the deletion of seven additional ties. Therefore, the final sample size for recruiter–recruit distance calculations was 348.
Spatial Clustering (RDS Seeds vs. Peer Recruits)
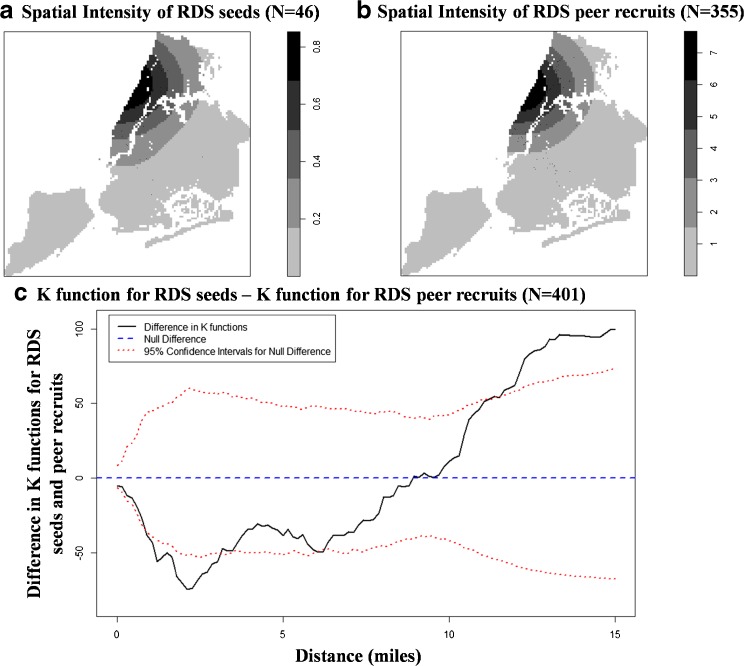
Among RDS participants, seeds were less spatially clustered than peer recruits; however, this difference was only significant for individuals separated by approximately 1–4 miles (Fig. 6). While the scales differ (e.g., miles in Fig. 6 represent Euclidean distances and miles in Table 1 represent public transportation distances), it is noteworthy that the median distance traveled to recruit peers was 2 miles (IQR, 1–5) (Table 1) and that nearly half of the RDS sample was recruited by peers within the distance identified as significant in Fig. 6.
FIG. 6.
Comparing the spatial intensity of RDS seeds and peer recruits. The first two maps display the spatial intensity of a RDS seeds (N = 46) and b peer recruits (N = 355), respectively. Darker shades indicate greater clustering. c The difference between K functions for RDS seeds and peer recruits (solid black line). When the difference in K functions is positive, RDS seeds are more spatially clustered than RDS peer recruits; when the difference in K functions is negative, RDS peer recruits are more spatially clustered than RDS seeds. The 95 % confidence envelopes for a null difference in the K functions (H0: K seeds(h) = K peer recruits(h)) (dotted red lines) were based on 1,000 Monte Carlo simulations and represent the set of confidence intervals over the range of spatial distances examined. At distances where the difference in K functions exceeds the 95 % confidence envelopes, differential spatial clustering is observed.
Exploring the Potential for Biased HIV Prevalence Estimates (RDS Sample)
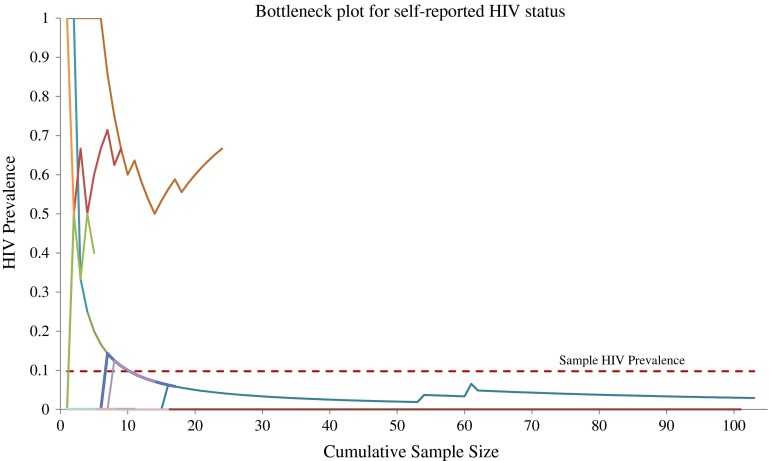
The unadjusted HIV prevalence among RDS participants was 10.5 %, and the RDS-adjusted HIV prevalence was 6.7 %. Information on HIV distribution by RDS chain is published elsewhere,33 and convergence plots and bottleneck plots for self-reported HIV status are in Appendix 2. RDS participants were recruited from 47 of 176 New York City zip codes. Compared with the distribution of adolescents/adults living with HIV/AIDS in New York City, our weighted RDS sample recruited a lower proportion of HIV-positive individuals in 37 recruitment zip codes (of note, HIV-positive individuals were not recruited from 31 recruitment zip codes) and a higher proportion of HIV-positive individuals in seven recruitment zip codes. The greatest discrepancies between the New York City Surveillance prevalence estimates and the RDS-weighted estimates occurred in two zip codes near the study office; the RDS-adjusted sample prevalence was much higher than the prevalence reported in the surveillance data for both of these zip codes.
On average, HIV-positive recruiters traveled 5 miles (12 min), and HIV-negative recruiters traveled 3 miles (9 min) to recruit peers (miles: P = 0.008, minutes: P = 0.007; Table 1). While the number of peer recruits did not significantly differ by HIV status (P = 0.29), HIV-positive participants recruited HIV-positive individuals 61 % of the time, and HIV-negative participants recruited HIV-positive individuals only 4 % of the time (P < 0.0001). We observed no significant differences in the distance or time traveled to the study office by HIV status (Table 1) or to recruit peers by the recruit’s HIV status or recruiter–recruit seroconcordance.
Discussion
Contrary to our hypotheses for objective 1, RDS participants were not recruited from a wider geographic area than TSO participants, and individuals recruited via RDS were not less spatially dependent on one another than those recruited through TSO. Furthermore, interesting patterns were observed when the analyses were stratified by the inclusion/exclusion of van recruits. As seen in Fig. 2, the geographic area covered by the TSO sample is greatly impacted by the addition of van recruits; when van recruits are excluded from the analysis, the proportion of the sample within walking distance of the study office increases by 20 %. These findings are in line with the study team’s rationale for using a mobile van, which was to increase the sample’s geographic diversity and to remove travel barriers to study enrollment. Thus, this report is extremely relevant to the practice of epidemiology, as it has implications for the spatial dependence of the recruited sample. Specifically, without the mobile van recruits, the TSO participants were more spatially clustered. We additionally noted significant barriers for recruiting/enrolling RDS participants using a mobile van that we had not previously encountered with a TSO approach. For example, the van regularly relocated to increase sample yield and diversity which posed challenges specifically for RDS participants when referring peers to new locations. This likely resulted in fewer RDS participants enrolling in the study on the van compared with TSO participants. This in turn impacted the RDS sample in two ways. First, when van recruits were included in the analysis, the spatial clustering observed among RDS participants was significantly greater than that of the TSO participants. However, when van recruits were excluded from the analysis, the difference in the spatial clustering was no longer significant between RDS and TSO. Second, within the RDS sample, peer recruits were more spatially clustered than seeds. Our findings show that (1) individuals recruited on the van were more likely to be recruited further from the study office, and (2) the van was much more successful for recruitment/enrollment of TSO participants than for RDS participants.
With respect to our second set of hypotheses, RDS peer recruits did not cover a wider geographic area than seeds, and the geographic coverage of the sample did not increase as recruitment progressed. This is likely because (1) RDS participants recruited spatially proximal peers, and (2) the time and distance traveled to the study office and to recruit peers remained fairly constant across recruitment waves (Fig. 4) and (Fig. 3) compared with those recruited further from the study office, those recruited closer recruited more peers and peers who were closer to them (Fig. 5). Thus, despite purposively selecting a geographically diverse group of seeds to initiate peer recruitment, the tendency to recruit spatially proximal peers that were close to the study office resulted in a sample of peer recruits that was more geographically confined than the seeds.
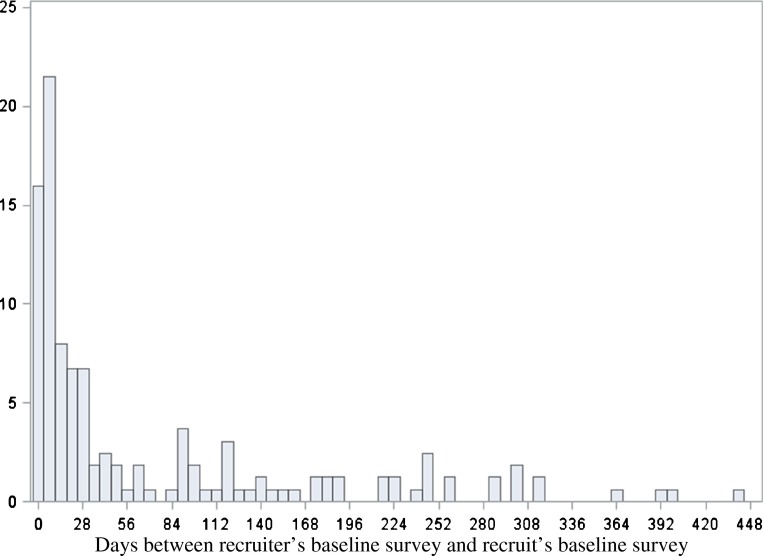
Some of our findings contrast those reported by McCreesh and colleagues in their evaluation of the role of distance in RDS recruitment in rural Uganda.19 For example, in our study, distance between recruits and recruiters did not decrease over time. Instead, travel distances and times were relatively stable over time. Although both studies report that most participants recruited spatially proximal peers, the proportion of START participants recruited by peers <2 km away (42 %) was substantially less than the proportion of study participants in Uganda who were recruited by someone <2 km away (93 %).19 Finally, 30 % of START recruits were interviewed within 1 week of their recruiter (median number of days = 22; IQR, 6–11 days). In contrast to the findings reported by McCreesh and colleagues, the time to recruit peers in START was not significantly associated with the recruiter’s distance (in time or minutes) or the recruit’s distance (in time or in minutes) from the study office (Appendix 3).
Limitations
First, our findings may not be generalizable to other areas with less extensive public transportation systems or where people rely less on public transportation. Additionally, because only recruitment locations were geocoded, it is possible that those recruited further from the study office decided to participate because they lived, worked, or spent time at another location closer to the study office. We also assumed that all participants used public transportation (or walked if the walking distance was shorter) to the study office and to recruit peers. Some individuals may have traveled by car or walked instead of using public transportation. While it is possible that some individuals may have traveled by car instead of using public transportation, it is more likely that those not using public transportation walked given that our sample represents a predominately lower income population and the prohibitively high cost of car ownership in New York City (e.g., gas, parking, insurance). Thus, some of our travel distances/times may underestimate actual travel distances/times.
While other studies have reported instances of coercion during RDS recruitment (e.g., payment for providing transportation to the study site),34 START participants were asked whether they felt pressured by the person who recruited him/her to participate in the study, and only two individuals (<1 %) reported that they did. The fact that few participants experienced being pressured or coerced to participate in the START study likely reflects that 78 % of RDS participants attended the group-facilitated recruitment training sessions, which were developed to enhance peer recruitment efforts.35 In brief, the trainings included discussions on study purpose and peer recruitment ethics. They also incorporated role play to discuss and practice techniques for recruiting peers. Of note, 55 % of those attending the group-facilitated recruitment trainings reported using some of the recruitment strategies discussed in the training, and 88 % reported that they were helpful.
Additionally, because HIV status was self-reported in this study, prevalence is likely underestimated. Consequently, the actual HIV prevalence among participants sampled is likely higher than that reported by AIDSVu24 in more zip codes than we report here. Finally, the data used to calculate baseline HIV prevalence are from the general population of adults and adolescents, and our sample represents a higher risk group. Compared with census tracts not reached with either strategy, study participants were recruited in census tracts with a greater proportion of Hispanic and black residents, a greater proportion of individuals and families living below the poverty line, a higher proportion of vacant houses and a lower proportion of owner-occupied homes, higher unemployment rates, and lower median household incomes (P < 0.05); this is consistent with our study goals and the ethnographic assessment used to select recruitment neighborhoods. Consequently, the observed higher prevalence of HIV in our sample may reflect an increased prevalence of drug users in areas with a higher HIV burden, spatial recruitment biases, or both.
Finally, it is also possible that failure to meet other RDS assumptions may have influenced our results. A rigorous evaluation of RDS assumptions in this study previously reported (1) some nonreciprocal recruitment ties, (2) nonrandom recruitment of drug-using network members, (3) possible inaccuracies in self-reported degree, (4) dependence among seeds and peer recruits, and (5) the ability to recruit more than one peer.13 Another previous report using START data examined clustering by HIV status within RDS recruitment chains.33 Individuals in RDS chains with higher than average HIV prevalence were more likely to have been recruited in neighborhoods characterized by greater inequality, higher valued owner-occupied housing, and a higher proportion of Latinos. Individuals in RDS chains with higher than average HIV prevalence were also more likely to have exchanged sex for money or drugs in the past year, to have used crack in the past 6 months, and to have been enrolled in a drug treatment program in the past 6 months; they were less likely to have used cocaine and to report homelessness in the past 6 months. Of note, while neighborhood characteristics were associated with recruitment patterns, RDS recruitment chains were not geographically confined. Rather, participants frequently recruited others in different (although demographically similar) neighborhoods.33,36 Estimates for self-reported HIV status were stable in both the RDS and TSO sample, and the prevalence of self-reported HIV status varied by RDS recruitment chain (Appendix 2).
Conclusions
Despite these limitations, our findings have implications for the design of recruitment strategies targeting hidden populations and for the analysis and interpretation of RDS data. First, while all participants were more likely to be recruited in the area surrounding the study office, RDS participants were more likely to be recruited within walking distance of it, and this may be partly attributed to the differential success of the mobile van for RDS and TSO recruitment/enrollment efforts. The mobile van successfully increased the geographic coverage and reduced the observed clustering for the TSO but not the respondent-driven sample. Consequently, TSO participants were less spatially clustered than RDS participants but only when van recruits were included in the analysis. Future studies using either RDS or TSO could use multiple stationary study sites (as opposed to mobile sites) located near subway entrances to improve study accessibility, expand geographic coverage, and reduce spatial clustering of sampled individuals.
With respect to the RDS sample, individuals recruited spatially proximal peers. Rather than the geographic coverage of recruits expanding as recruitment progressed, the opposite was true; the sample of peer recruits was more spatially clustered than the sample of seeds selected to initiate peer recruitment. This consequently limited the recruitment coverage area and also created a more spatially dependent sample. This may also partly account for the greater spatial dependence observed among RDS participants than among TSO participants. The observed spatial patterns in recruitment could have important implications for both the accuracy and validity of resulting RDS estimates due to the shared social environment of sampled individuals.
Because HIV and related risk behaviors are often spatially clustered,37,38 the accuracy and validity of prevalence estimates could be influenced by the fact that a majority of RDS participants were recruited within walking distance of their peers and of the study office. Due to the underlying spatial distribution of HIV, the tendency for RDS participants to recruit spatially proximal peers may increase recruitment homophily by HIV status which (1) violates RDS’s random recruitment assumption, (2) could bias population-based estimates, and (3) could increase the variance of population estimates. The preferential recruitment of peers who are close to the study office also has the potential to introduce bias. Oversampling of participants near the study office could over- or underestimate the HIV prevalence if the study office is located in an area with a high or low HIV burden. The same is true for factors other than HIV which tend to cluster geographically. The increased recruitment of individuals near the study office may also decrease the effective sample size because those who share the same risk environment or social space are likely to be more similar to one another. Bias may also be introduced if the distance between recruiter–recruit pairs varies by the outcome status.
Finally, a better understanding of geographic recruitment patterns could help researchers determine whether their sample is likely to be representative of the larger target population or a subset of the target population. For example, if recruitment is restricted to a subset of the larger geographic area, results may only be representative of a subset of the target population sampled. Ethnographic and qualitative research can be used to guide inferences with respect to whether the RDS sample reflects the geographic distribution of the target population or whether it reflects a geographic subset of the target population. In other words, do members of the target population reside in geographic areas not included in the final sample or does recruitment accurately reflect the geographic distribution of the target population? Future studies should examine geographic and spatial patterns in recruitment and determine how the preferential recruitment of more proximal peers could influence the precision and accuracy of RDS estimates and/or the representativeness of the resulting estimates.
Acknowledgments
This research was supported by the National Institute on Drug Abuse Grants R01 DA022144 (PI: Lewis, CF) and K01 DA033879 (PI: Rudolph, AE); the NIDA had no further role in study design; in the collection, analysis and interpretation of data; in the writing of the report; or in the decision to submit the paper for publication.
Appendix 1
TABLE 2.
Theory, objective, hypotheses, analytic approach, and key findings in the evaluation of geographic coverage and spatial dependence of illicit drug users recruited through respondent-driven sampling, New York City
| Theory | Objective | Hypotheses | Analytic approach | Key findings | |
|---|---|---|---|---|---|
| RDS aims to generate a representative sample of the target population at equilibrium. | 1A | Compare the geographic coverage of RDS and TSO participants | Hypothesis 1a: RDS participants would cover a wider geographic area than TSO participants. | 1. Map RDS and TSO participants according to their recruitment location in ArcMap 10.1 (
28
). 2. Create a 10 × 10 grid for NYC (except Staten Island) and calculate the number and proportion of RDS and TSO recruits in each boxed area in ArcMap 10.1 ( 28 ). 3. Identify areas where individuals were recruited with RDS only, TSO only, both, and neither strategy. |
Recruitment locations for RDS and TSO participants overlapped substantially. The proportion of the RDS or TSO sample in a box where only one recruitment strategy recruited individuals was low (including van recruits, 2 % of the RDS sample and 5 % of the TSO sample; excluding van recruits, 3 % of the RDS sample and 2 % of the TSO sample; Fig. 2a, b, respectively). The TSO sample covered a wider geographic area, and areas reached only by TSO were furthest from the study office (Fig. 2a, b). RDS participants were significantly more likely to be recruited within walking distance of the stationary study office in Harlem (77 % of the RDS sample vs. 68 % of the TSO sample; P = 0.036) (Fig. 2b). |
| 5. Compare the average distance and time traveled by RDS and TSO participants from their recruitment location to the study office via public transportation using the Google Maps APITM and a custom-written R code.27 Significant differences were assessed with t tests and permutation tests using SAS software v9.3.29 | Although the difference was not significant, RDS participants traveled fewer miles and minutes. RDS participants traveled a median of 1.0 mile (4.8 min), and TSO participants traveled a median of 2.0 miles (7.9 min) between their recruitment location and the study office (Table 1). | ||||
| RDS aims to generate a representative sample of the target population at equilibrium. | 1B | Compare the spatial clustering of RDS and TSO participants | Hypothesis 1b: RDS participants would be less spatially clustered than TSO participants | 1. Estimate and compare spatial clustering of RDS and TSO recruits using K function analysis with the SPLANCS package in R.30
2. Calculate the difference in the K functions, and test H0: K RDS(h) = K TSO(h). Monte Carlo simulations were used to generate 95 % confidence envelopes for the difference in K functions, K RDS(h) − K TSO(h) for a range of distances, h, based on randomly permuting RDS and TSO location labels to provide the corresponding distribution under the null hypothesis.31 |
Both RDS and TSO participants cluster around the study office (P < 0.0001) (Fig. 3). Overall, the RDS sample was significantly more clustered than the TSO sample (Fig. 3); however, this was mostly explained by the fact that TSO participants were significantly more likely to be enrolled on the mobile van (29 % of TSO participants vs. 3 % of RDS participants; P < 0.001), and the mobile van reduced geographic clustering for the TSO sample but not for the RDS sample. |
| Theoretically, as RDS recruitment progresses through successive waves, the sample of recruits should include more geographically remote individuals. | 2A | Compare the geographic coverage of RDS seeds and peer recruits |
Hypothesis 2a: Peer recruits would cover a wider geographic area than seeds.
The area covered would increase as recruitment progress. |
1. Map RDS seeds and peer recruits by recruitment location and compare the distance and time traveled via public transportation (1) to the study office (for those enrolled at the study office) and (2) to recruit peers (RDS seeds vs. peer recruits and by recruitment wave) using the Google Maps APITM and a custom-written R code.27 | RDS participants tended to recruit spatially proximal peers (median distance between recruit and recruiter = 2.1 miles; median time between recruit and recruiter = 7.5 min) (Table 1) Peer recruits did not cover a wider geographic area than seeds and the geographic area covered by RDS recruits did not increase as waves progressed (Table 1 and Fig. 4) |
| 2. Evaluate whether the distance/time traveled to recruit peers differed by proximity to the study office. | RDS participants recruited closer to the study office tended to recruit peers who were closer to them and those recruited further from the study office tended to recruit peers who were further from them (Fig. 5). Recruits traveling further to recruit peers also recruited fewer peers. | ||||
| When sample equilibrium is reached, the final sample should be (1) independent of the seeds who initiated peer recruitment and (2) more geographically diverse than those initially selected. | 2B | Compare the spatial clustering of RDS seeds and peer recruits | Hypothesis 2b: Peer recruits would be less spatially clustered than seeds. | 1. Estimate and compare the extent and resolution of spatial clustering of RDS seeds and peer recruits using K function analysis with the SPLANCS package in R.30
2. Calculate the difference in K functions and test H0: K seeds(h) = K peer recruits(h). Monte Carlo simulations were used to generate 95 % confidence envelopes for the difference in K functions, K seeds(h) − K peer recruits(h) for a range of distances, h, based on randomly permuting seed and peer recruit location labels to provide the corresponding distribution under the null hypothesis.31 |
The negative difference in the K function for most of the distances examined suggests that seeds are less spatially dependent on one another than are peer recruits; however, the difference is only significant for individuals separated by approximately 1–4 miles (Fig. 6). Although the scales differ (e.g., miles in Fig. 6 represent Euclidean distances and miles in Table 1 represent public transportation distances), it is noteworthy that the median distance traveled to recruit peers was 2 miles (IQR, 1–5) (Table 1) and that nearly half of the RDS sample fell within the distance identified as significant in Fig. 6. |
| 2C | Explore the potential for biased HIV prevalence estimates | 1. Examine the association between the distance and time between recruiter–recruit pairs and (1) the recruiter’s HIV status, (2) the recruit’s HIV status, and (3) recruitment of peers with the same HIV status using SAS software v9.3.29
2. Compare tract-level demographic characteristics (from the 2000 U.S. Census) where participants were and were not recruited. 3. Compare the observed HIV prevalence among RDS participants with the prevalence reported among adolescents/adults living in New York City (AIDSVu). |
HIV-positive individuals traveled 5 miles (12 min), and HIV-negative individuals traveled 3 miles (9 min) to recruit peers (P = 0.008 for miles and P=0.007 for minutes; Table 1). While the number of peer recruits did not significantly differ by HIV status (P = 0.29), HIV-positive participants recruited other HIV-positive individuals 61 % of the time, and HIV-negative participants recruited HIV-positive individuals only 4 % of the time (P < 0.0001). We observed no significant differences in the distance or time traveled to (1) reach the study office by HIV status or (2) to recruit peers by the recruit’s HIV status or by recruitment of individuals with the same HIV status as the recruiter. |
||
Appendix 2
FIG. 7.
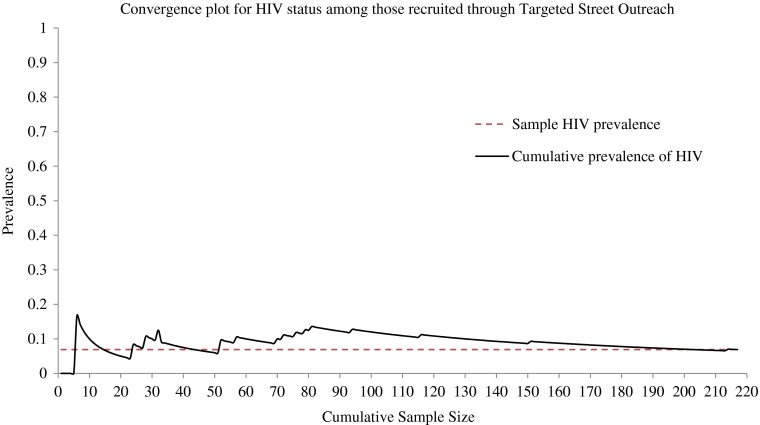
Convergence plot showing for self-reported HIV status in the TSO sample. The black solid line represents the cumulative estimate of the prevalence, and the red dotted line represents the estimate based on the complete sample, . As seen in this figure, the prevalence of self-reported HIV in the TSO sample is relatively stable over time.
FIG. 8.
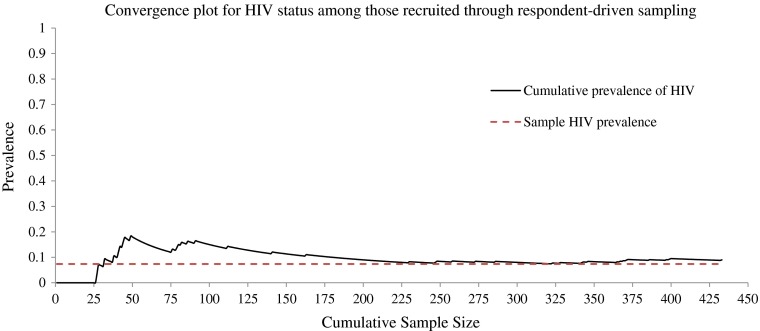
Convergence plot showing for self-reported HIV status in the RDS sample. The black solid line represents the cumulative estimate of the prevalence, and the red dotted line represents the estimate based on the complete sample, . As seen in this figure, the prevalence of self-reported HIV in the RDS sample is relatively stable over time.
FIG. 9.
The bottleneck plot for self-reported HIV status shows the cumulative proportion of the RDS sample reporting HIV-positive status in New York City, by seed (N = 27). While there are 27 different seeds and consequently 27 different recruitment chains (of varying lengths), some are difficult to distinguish because the prevalence within that chain remains constant at 0 %. The red dotted line represents the estimate of self-reported HIV status based on the complete sample, .
Appendix 3
FIG. 10.
Distribution of days between recruiter’s baseline survey and recruit’s baseline survey. This figure displays the number of participants (y-axis) enrolled in the START study according to the number of days he/she enrolled after his/her recruiter (x-axis). Of note, 49 individuals (30 %) were enrolled in the study within 1 week of the person who recruited him/her (range 0–440 days ).
FIG. 11.
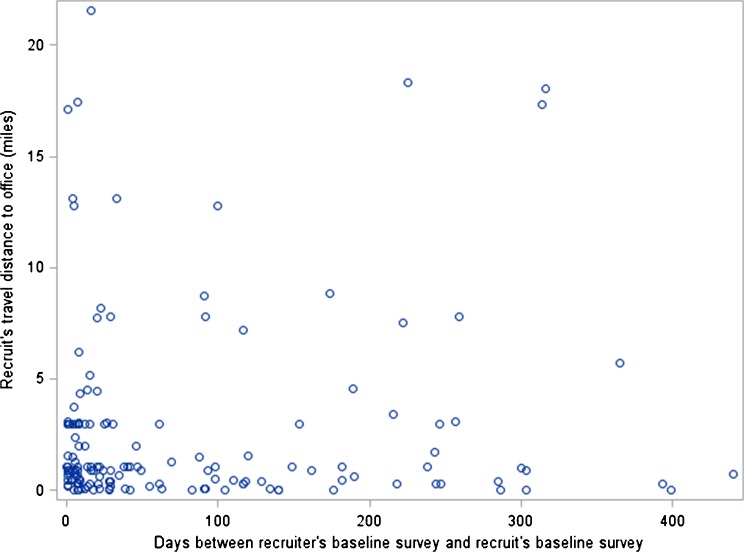
Scatter plot for the correlation between a recruit’s travel distance to the study office (miles) and the number of days between the recruiter’s baseline survey and his/her recruit’s baseline survey (rho = 0.09864; P value = 0.2103).
FIG. 12.
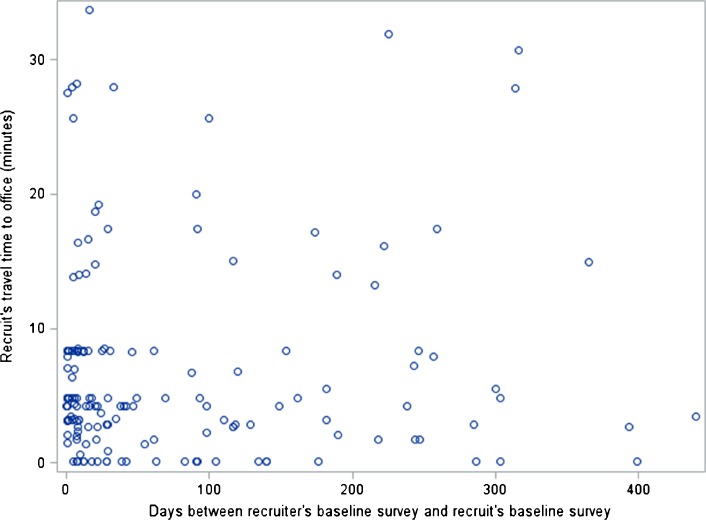
Scatter plot for the correlation between a recruit’s travel time to the study office (minutes) and the number of days between the recruiter’s baseline survey and his/her recruit’s baseline survey (rho = 0.06461; P value = 0.4126).
FIG. 13.
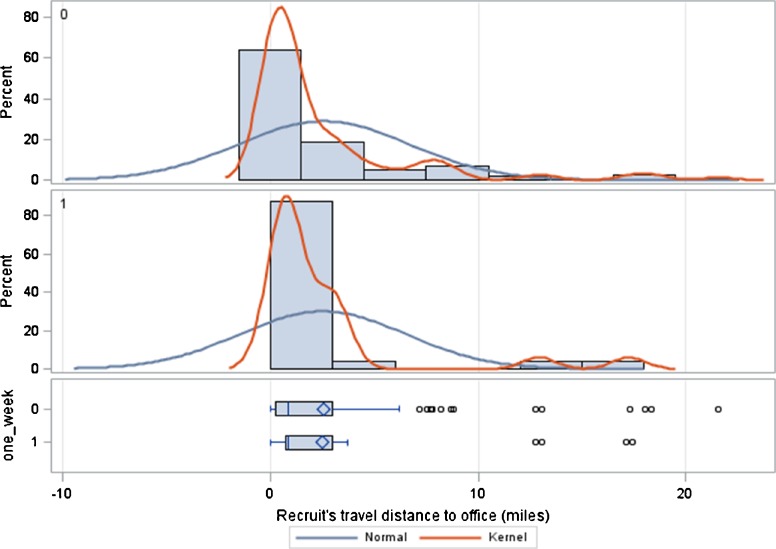
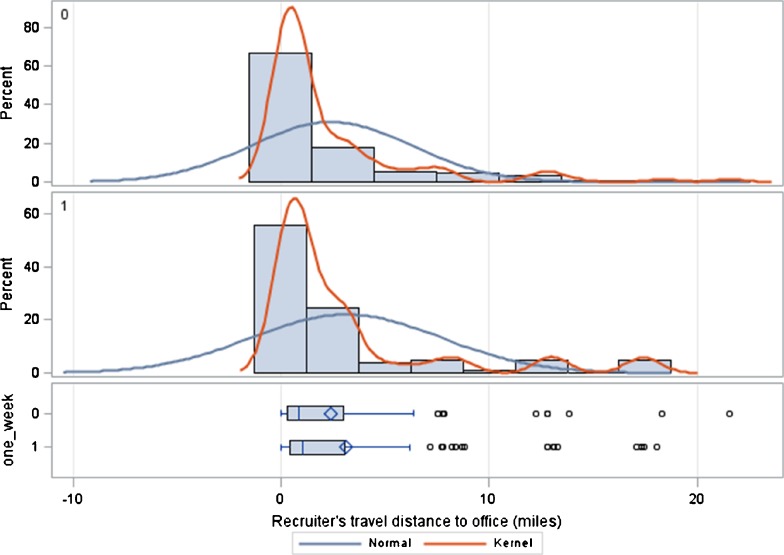
Miles traveled by recruits to the study office. This figure displays the distance traveled by recruits to the office (miles) for those recruited more than a week after his/her recruiter (one_week=0) and for those recruited within a week (one_week = 1) of his/her recruiter. When categorized as 1 week or less vs. more than 1 week between recruiter’s baseline visit and recruit’s baseline visit, there was no significant difference in the distance (miles) traveled by the recruit to the study office (P value = 0.9555).
FIG. 14.
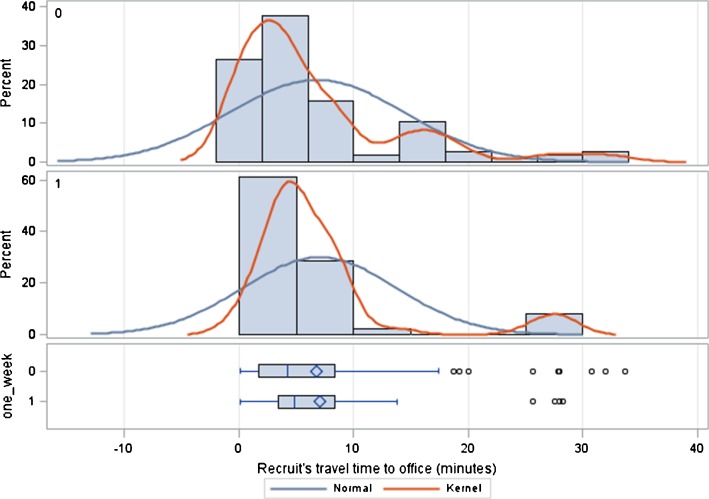
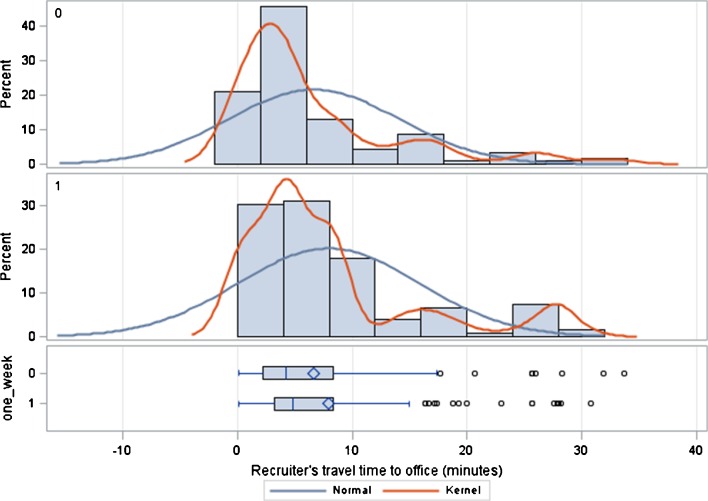
Minutes traveled by recruits to the study office. This figure displays the time traveled by recruits to the office (minutes) for those recruited more than a week after his/her recruiter (one_week=0) and for those recruited within a week (one_week = 1) of his/her recruiter. When categorized as 1 week or less vs. more than 1 week between recruiter’s baseline visit and recruit’s baseline visit, there was no significant difference in the time (minutes) traveled by the recruit to the study office (P value = 0.8475).
FIG. 15.
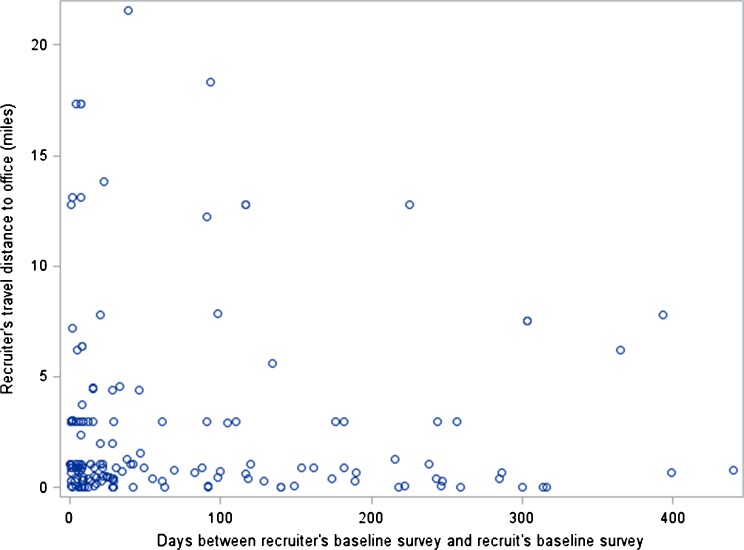
Scatter plot for the correlation between recruiter’s distance (miles) to the office and days between recruiter’s baseline survey and recruit’s baseline survey (rho = −0.02042; P value = 0.7959).
FIG. 16.
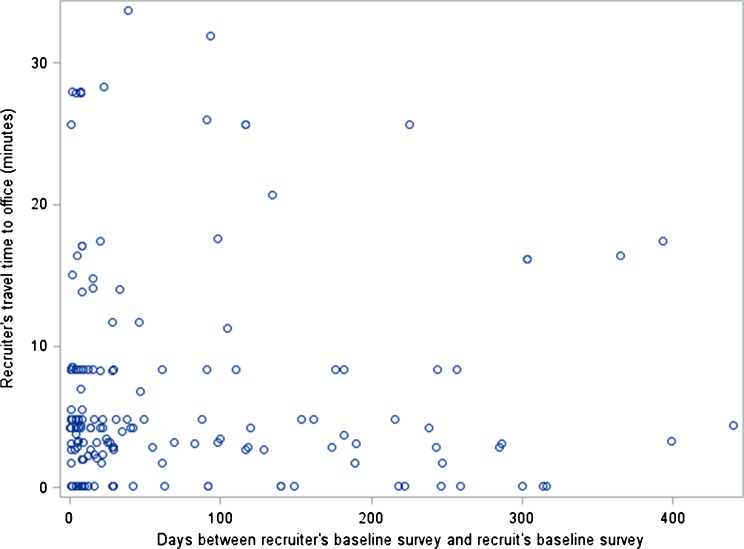
Scatter plot for the correlation between recruiter’s time (minutes) to the office and days between recruiter’s baseline survey and recruit’s baseline survey (rho = −0.03607; P value = 0.6476).
FIG. 17.
Miles traveled by recruiters to the study office. This figure displays the distance (miles) traveled by recruiters to the office for those who’s recruits enrolled in the study more than a week after him/her (one_week=0) and for those who’s recruits enrolled in the study within a week (one_week = 1) of him/her. When categorized as 1 week or less vs. more than 1 week between recruiter’s baseline visit and recruit’s baseline visit, there was no significant difference in the distance traveled (miles) by the recruiter to the study office (P value = 0.1844).
FIG. 18.
Minutes traveled by recruiters to the study office. The above figure displays the time (minutes) traveled by recruiters to the office for those who’s recruits enrolled in the study more than a week after him/her (one_week=0) and for those who’s recruits enrolled in the study within a week (one_week = 1) of him/her. When categorized as 1 week or less vs. more than 1 week between recruiter’s baseline visit and recruit’s baseline visit, there was no significant difference in the time traveled (minutes) by the recruiter to the study office (P value = 0.1930).
References
- 1.Lu X. Respondent-driven sampling: theory, limitations & improvements. Dissertation, Department of Public Health Sciences, Karolinska Institutet, Stockholm, Sweden; 2013.
- 2.Gallagher K, Sullivan P, Lansky A, Onorato I. Behavioral surveillance among people at risk for HIV infection in the U.S.: the National HIV Behavioral Surveillance System. Public Health Rep. 2007;122(Suppl 1):32–8. doi: 10.1177/00333549071220S106. [DOI] [PMC free article] [PubMed] [Google Scholar]
- 3.Lansky A, Abdul-Quader AS, Cribbin M, et al. Developing an HIV behavioral surveillance system for injecting drug users: the National HIV Behavioral Surveillance System. Public Health Rep. 2007;122(Suppl 1):48. doi: 10.1177/00333549071220S108. [DOI] [PMC free article] [PubMed] [Google Scholar]
- 4.Heckathorn DD. Respondent-driven sampling: a new approach to the study of hidden populations. Soc Probl. 1997; 174–199.
- 5.Watters JK, Biernacki P. Targeted sampling: options for the study of hidden populations. Soc Probs. 1989;36:416. doi: 10.2307/800824. [DOI] [Google Scholar]
- 6.Kral AH, Malekinejad M, Vaudrey J, et al. Comparing respondent-driven sampling and targeted sampling methods of recruiting injection drug users in San Francisco. J Urban Health. 2010;87(5):839–50. doi: 10.1007/s11524-010-9486-9. [DOI] [PMC free article] [PubMed] [Google Scholar]
- 7.Broadhead RS, Heckathorn DD, Weakliem DL, et al. Harnessing peer networks as an instrument for AIDS prevention: results from a peer-driven intervention. Public Health Rep. 1998;113(Suppl 1):42. [PMC free article] [PubMed] [Google Scholar]
- 8.Heckathorn DD. Respondent-driven sampling II: deriving valid population estimates from chain-referral samples of hidden populations. Soc Probl. 2002;49(1):11–34. doi: 10.1525/sp.2002.49.1.11. [DOI] [Google Scholar]
- 9.Wang J, Carlson RG, Falck RS, Siegal HA, Rahman A, Li L. Respondent-driven sampling to recruit MDMA users: a methodological assessment. Drug Alcohol Depend. 2005;78(2):147–57. doi: 10.1016/j.drugalcdep.2004.10.011. [DOI] [PubMed] [Google Scholar]
- 10.Wejnert C. An empirical test of respondent-driven sampling: point estimates, variance, degree measures, and out-of-equilibrium data. Sociol Methodol. 2009;39(1):73–116. doi: 10.1111/j.1467-9531.2009.01216.x. [DOI] [PMC free article] [PubMed] [Google Scholar]
- 11.Liu H, Li J, Ha T. Assessment of random recruitment assumption in respondent-driven sampling in egocentric network data. Social Networking. 2012;1(2):13–21. doi: 10.4236/sn.2012.12002. [DOI] [PMC free article] [PubMed] [Google Scholar]
- 12.McCreesh N, Frost SDW, Seeley J, et al. Evaluation of respondent-driven sampling. Epidemiology. 2012;23(1):138. doi: 10.1097/EDE.0b013e31823ac17c. [DOI] [PMC free article] [PubMed] [Google Scholar]
- 13.Rudolph AE, Crawford ND, Latkin C, et al. Subpopulations of illicit drug users reached by targeted street outreach and respondent-driven sampling strategies: implications for research and public health practice. Ann Epidemiol. 2011;21(4):280–9. doi: 10.1016/j.annepidem.2010.11.007. [DOI] [PMC free article] [PubMed] [Google Scholar]
- 14.Heckathorn DD, Semaan S, Broadhead RS, Hughes JJ. Extensions of respondent-driven sampling: a new approach to the study of injection drug users aged 18–25. AIDS Behav. 2002;6(1):55–67. doi: 10.1023/A:1014528612685. [DOI] [Google Scholar]
- 15.Wejnert C, Heckathorn DD. Web-based network sampling efficiency and efficacy of respondent-driven sampling for online research. Sociol Methods Res. 2008;37(1):105–34. doi: 10.1177/0049124108318333. [DOI] [Google Scholar]
- 16.Young AM, Rudolph AE, Quillen D, Havens JR. Spatial, temporal, and relational patterns in respondent driven sampling: evidence from a social network study of rural drug users. Journal of Epidemiology and Community Health. Unpublished. [DOI] [PMC free article] [PubMed]
- 17.Wylie JL, Jolly AM. Understanding recruitment: outcomes associated with alternate methods for seed selection in respondent driven sampling. BMC Med Res Methodol. 2013;13(1):93. doi: 10.1186/1471-2288-13-93. [DOI] [PMC free article] [PubMed] [Google Scholar]
- 18.Burt RD, Hagan H, Sabin K, Thiede H. Evaluating respondent-driven sampling in a major metropolitan area: comparing injection drug users in the 2005 Seattle area national HIV behavioral surveillance system survey with participants in the RAVEN and Kiwi studies. Ann Epidemiol. 2010;20(2):159–67. doi: 10.1016/j.annepidem.2009.10.002. [DOI] [PMC free article] [PubMed] [Google Scholar]
- 19.McCreesh N, Johnston LG, Copas A, et al. Evaluation of the role of location and distance in recruitment in respondent-driven sampling. Int J Health Geogr. 2011;10(1):56. doi: 10.1186/1476-072X-10-56. [DOI] [PMC free article] [PubMed] [Google Scholar]
- 20.Jenness SM, Neaigus A, Wendel T, Gelpi-Acosta C, Hagan H. Spatial recruitment bias in respondent-driven sampling: implications for HIV prevalence estimation in urban heterosexuals. AIDS Behav. 2013; 1–8. [DOI] [PMC free article] [PubMed]
- 21.Toledo L, Codeço CT, Bertoni N, Albuquerque E, Malta M, Bastos FI. Putting respondent-driven sampling on the map: insights from Rio de Janeiro, Brazil. JAIDS J Acquir Immune Defic Syndr. 2011;57:S136–43. doi: 10.1097/QAI.0b013e31821e9981. [DOI] [PubMed] [Google Scholar]
- 22.Qiu P, Yang Y, Ma X, et al. Respondent-driven sampling to recruit in-country migrant workers in China: a methodological assessment. Scand J Publ Health. 2012;40(1):92–101. doi: 10.1177/1403494811418276. [DOI] [PubMed] [Google Scholar]
- 23.Abdul‐Quader AS, Heckathorn DD, McKnight C, et al. Effectiveness of respondent-driven sampling for recruiting drug users in New York City: findings from a pilot study. Journal of Urban Health. 2006;83(3):459–476. [DOI] [PMC free article] [PubMed]
- 24.AIDSVu. Emory University, Rollins School of Public Health. Available: www.aidsvu.org. Accessed January 20, 2014.
- 25.Ompad DC, Galea S, Marshall G, et al. Sampling and recruitment in multilevel studies among marginalized urban populations: the IMPACT studies. J Urban Health. 2008;85(2):268–80. doi: 10.1007/s11524-008-9256-0. [DOI] [PMC free article] [PubMed] [Google Scholar]
- 26.Rudolph AE, Latkin C, Crawford ND, Jones KC, Fuller CM. Does respondent driven sampling alter the social network composition and health-seeking behaviors of illicit drug users followed prospectively? PLoS One. 2011;6(5):e19615. doi: 10.1371/journal.pone.0019615. [DOI] [PMC free article] [PubMed] [Google Scholar]
- 27.Delamater PL, Messina JP, Shortridge AM, Grady SC. Measuring geographic access to health care: raster and network-based methods. Int J Health Geogr. 2012;11(1):15. doi: 10.1186/1476-072X-11-15. [DOI] [PMC free article] [PubMed] [Google Scholar]
- 28.(ESRI) ESRI. North America Detailed Streets. 2007; http://www.arcgis.com/home/item.html?id=f38b87cc295541fb88513d1ed7cec9fd. Accessed September 1, 2013.
- 29.SAS/STAT Software, Version 9.3 [computer program]. Cary, NC; 2011.
- 30.R: a language and environment for statistical computing [computer program]. Vienna, Austria: R Foundation for Statistical Computing. 2008.
- 31.Ripley B. Modeling spatial patterns (with discussion) J R Stat Soc. 1977;39:172–212. [Google Scholar]
- 32.Respondent-Driven Sampling Analysis Tool (RDSAT) Version 7.1. [computer program]. Ithaca, NY: Cornell University; 2012.
- 33.Rudolph AE, Crawford ND, Latkin C, Fowler JH, Fuller CM. Individual and neighborhood correlates of membership in drug using networks with a higher prevalence of HIV in New York City (2006–2009). Ann Epidemiol. 2013. [DOI] [PMC free article] [PubMed]
- 34.Scott G. “They got their program, and I got mine”: a cautionary tale concerning the ethical implications of using respondent-driven sampling to study injection drug users. Int J Drug Policy. 2008;19(1):42–51. doi: 10.1016/j.drugpo.2007.11.014. [DOI] [PubMed] [Google Scholar]
- 35.Rudolph AE, Crawford ND, Latkin C, et al. Individual, study, and neighborhood level characteristics associated with peer recruitment of young illicit drug users in the USA: optimizing respondent driven sampling. Social Science & Medicine. 2011. [DOI] [PMC free article] [PubMed]
- 36.Rudolph AE, Crawford ND, Fuller CM. Response to letter to the editor: regarding “Individual and neighborhood correlates of membership in drug-using networks with a higher prevalence of human immunodeficiency virus (2006–2009)”. Ann Epidemiol. 2013;23(10):666–8. doi: 10.1016/j.annepidem.2013.07.020. [DOI] [PMC free article] [PubMed] [Google Scholar]
- 37.Hixson BA, Omer SB, del Rio C, Frew PM. Spatial clustering of HIV prevalence in Atlanta, Georgia and population characteristics associated with case concentrations. J Urban Health. 2011;88(1):129–41. doi: 10.1007/s11524-010-9510-0. [DOI] [PMC free article] [PubMed] [Google Scholar]
- 38.Heimer R, Barbour R, Shaboltas AV, Hoffman IF, Kozlov AP. Spatial distribution of HIV prevalence and incidence among injection drugs users in St Petersburg: implications for HIV transmission. AIDS (London, England). 2008;22(1):123. [DOI] [PMC free article] [PubMed]


