

Abstract
Cell cycle progression is coordinated with metabolism, signaling and other complex cellular functions. The investigation of cellular processes in a cell cycle stage-dependent manner is often the subject of modern molecular and cell biological research. Cell cycle synchronization and immunostaining of cell cycle markers facilitate such analysis, but are limited in use due to unphysiological experimental stress, cell type dependence and often low flexibility. Here, we describe high-content microscopy-assisted cell cycle phenotyping (hiMAC), which integrates high-resolution cell cycle profiling of asynchronous cell populations with immunofluorescence microscopy. hiMAC is compatible with cell types from any species and allows for statistically powerful, unbiased, simultaneous analysis of protein interactions, modifications and subcellular localization at all cell cycle stages within a single sample. For illustration, we provide a hiMAC analysis pipeline tailored to study DNA damage response and genomic instability using a 3–4-day protocol, which can be adjusted to any other cell cycle stage-dependent analysis.
Keywords: hiMAC, Non-invasive cell cycle assay, Cell cycle profiling, DNA damage markers, Imaging
Introduction
Progression through the cell cycle is tightly coordinated by molecular pathways, which sense intra- and extracellular signals and orchestrate vital cellular functions with DNA replication and cell division [1]. This integrated signaling network differentially regulates activity of essential cellular processes such as DNA damage responses, transcription, protein biosynthesis, energy metabolism and organelle functions throughout the cell cycle [2–5].
Synchronization protocols are often used to investigate cell cycle-dependent biological processes in mammalian cells in a given experimental setting; however, these are problematic because they load experimental stresses. Immunofluorescence (IF) imaging facilitates cell cycle staging and cell phenotyping, but a combination of both strongly restricts analysis flexibility due to the limitations of fluorescence channels and antibodies, which precludes powerful applications such as cell cycle-based colocalization analysis. Live cell imaging of fluorophore-tagged cell cycle markers has been used to monitor cell cycle progression in unsynchronized cell populations, but it requires stable protein overexpression and is limited in the use of additional markers.
In order to overcome these challenges, we developed hiMAC, which integrates two-color (DAPI/EdU) cell cycle profiling and the analysis of complex cell phenotypes in a single high-content microscopy pipeline. hiMAC provides an unbiased method for cell cycle stage-dependent analysis of protein localization, interactions, structural features and pathway activities with a high statistical power, which ultimately provide cell cycle-based fingerprints for many biological processes accessible by IF imaging.
Overview of hiMAC
The hiMAC methodology enables the analysis of localization and modification dynamics of multiple proteins simultaneously in all cell cycle phases of non-synchronized cells. It consists of the integrated analysis of the cell cycle and any cell features of interest by high-content fluorescence microscopy. It can process a large number of samples, which is necessary for setups with multiple treatment conditions and time points. High-resolution cell cycle information is derived from DNA content (DAPI) and replication status (e.g., incorporation of thymidine analog EdU), which confers species-independence and maximum flexibility in the choice of proteins to analyze. Figure 1 illustrates the hiMAC workflow. A detailed step-by-step description is provided in the “Procedure” section.
Figure 1.
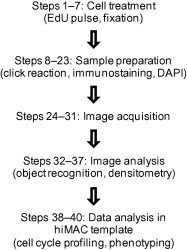
hiMAC workflow
The general experimental steps of the hiMAC procedure is outlined, see detailed stepwise description in the “Procedure” section.
Figure 2 exemplifies the hiMAC procedure for the co-localization analysis of two DNA damage markers, recombination marker Rad51 and general DNA damage marker γH2AX, throughout the cell cycle in mouse embryonic fibroblasts (MEFs). DNA lesions were induced by deletion of the DNA damage response gene Nbs1 as verified by the immunoblotting (Figure 2A). The hiMAC protocol begins with pulse labeling of cells with EdU, followed by fixation and permeabilization (Figure 1). A click reaction is performed to label S-phase cells [6], and proteins of interest and DNA are labeled with immunostaining and DAPI, respectively. Images are recorded by automated microscopy (Figure 2B) and analyzed in a customized CellProfiler [7] pipeline to measure intensities of DAPI (DNA content and condensation) and of EdU (replication status) in individual nuclei, and to identify the pattern of objects of interest, such as proteins, organelles and micronuclei (Figure 2C). Finally, a cell cycle profile is constructed, cell cycle phases are gated (Figure 2D and E), and the objects of interest are analyzed for all individual cell cycle phases (G1, early/mid/late S and G2/M) (Figure 2F).
Figure 2.

Illustration of individual steps of hiMAC
A. Western blot analysis of cell lysates from inducible Nbs1-null mouse embryonic fibroblast (MEF) cells (Nbs1F/F;CreER+) that were treated with 1 μM 4-hydroxytamoxifen (4-OHT) for 3 days to induce disruption of the Nbs1 gene. Cells were harvested after 3 or 6 days of recovery, i.e., 6 or 9 days post 4-OHT treatment (DPO). Controls are untreated inducible MEFs and congenic MEFs without expression of CreER. B. Example images of Nbs1-deleted cells at 6 DPO as shown in panel A that were stained with γH2AX and Rad51 antibodies, EdU and DAPI. Images were recorded by a Pathway 435 Bioimager (BD) with a 20× objective. C. Scheme of CellProfiler output table. The number in the “Cell” column refers to the respective nuclei as shown in panel B. D. Scheme of cell cycle profiling based on DAPI sum (DNA content), EdU sum (replication status) and DAPI mean (DNA condensation). E. Scatter plot of EdU sum vs. DAPI sum with gating of G1, early/mid/late S and G2/M cells was shown on the left, whereas scatter plot of DAPI mean vs. DAPI sum with gating of the late G2/M population (dashed frame, 4 N DNA content, EdU- and high DNA condensation) was shown on the right. F. Cell cycle phase-dependent colocalization of γH2AX and Rad51 foci in cells as shown in panel B. MN, micronuclei. Scale bars, 4 μM.
While hiMAC can be used to study cell cycle-dependent phenomena in general, here we specifically provide a pipeline to analyze the cell cycle phase-dependent localization of any two proteins and their interaction within the nucleus. We successfully applied this pipeline to analyze the dynamic localization of DNA damage response proteins (53BP1, Rad51, γH2AX, etc.) throughout the cell cycle [8].
Experimental design
Several parameters should be considered in the hiMAC protocol according to the experimental purpose. EdU pulse labeling is compatible with many cell treatments. However, EdU fails to label S-phase cells under conditions that block DNA synthesis (e.g., by hydroxyurea); the EdU pulse thus needs to be applied before such a treatment. It is recommended to include one sample of asynchronous untreated cells as undisturbed cell cycle control in every experiment. Positive and negative control samples should be included for each post-translational modification to assess maximum signal induction. When quantifying the level and localization of an ectopically expressed protein, appropriate controls such as non-functional or non-degradable isoforms of the same protein, or a different protein with the same tag and similar localization should be included. The cell fixation and immunostaining methods for high antibody specificity need to be optimized before high-throughput analysis [9]. siRNA knock-down of the protein epitope of interest is a good control for antibody specificity. While non-confocal microscopy is sufficient for hiMAC cell cycle profiling, confocal image acquisition may be of greater advantage for the resolution of fine structures of interest (nuclear foci, mitochondria, etc.).
Results
Cell cycle profiling
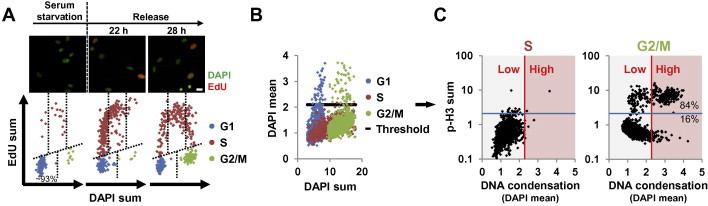
Cell cycle profiling of an asynchronous population of MEF cells yielded cell cycle profiles with clear separation of G1, S and G2/M populations (Figure 2E, left panel). We next validated the stringency of cell cycle gating (Figure 3). Cell cycle analysis of MEFs during serum starvation and release showed the expected outcome, namely efficient G0/G1 arrest (∼93%), followed by sequential passage of cells through early/mid/late S phase into G2/M phase (Figure 3A). In asynchronous MEF cells, the use of the S-phase population (EdU+) as a reference for cells with low DNA condensation allowed separation of G2/M cells (4 N, EdU−) into early G2 and late G2/M cells on the basis of mean DAPI intensity by hiMAC (Figure 3B and C). Co-staining with mitosis marker phospho-histone H3 (S28) (p-H3) showed that indeed most late G2/M nuclei were p-H3 positive (Figure 3B, ∼84%), demonstrating that DNA condensation within the G2/M population can be used as marker for late G2/M phases. Altogether, hiMAC facilitates gating of G1, early/mid/late S and early G2, as well as late G2/M populations.
Figure 3.
Validation of cell cycle parameters generated by hiMAC
A. Validation of DAPI and EdU total intensities as measures of DNA content and DNA synthesis. MEF cells were pulse labeled with EdU during serum starvation or 22 h and 28 h after release, stained with DAPI and EdU and analyzed by hiMAC. The upper panel shows representative images. The lower panel shows cell cycle profiles. The DAPI intensity of the G1 population at 28 h after release was used as reference for DNA content. Note that DAPI and EdU labeling allows to monitor the progression of released cells through S phase. B. and C. Validation of DNA condensation as mitosis marker. Asynchronous MEF cells were pulse labeled with EdU, stained with DAPI, EdU and a phospho-histone H3 (S28) (p-H3) antibody as mitosis marker and analyzed by hiMAC. S cells (red dots) were used as internal reference with low DNA condensation to set a DAPI mean threshold for the classification of G2/M cells (green dots) as either early G2 (low DNA condensation) or late G2/M (high DNA condensation) cells (B). p-H3 vs. DAPI mean scatter plots confirm that high DNA condensation in G2/M correlates well with p-H3 (right panel), whereas S cells have low DNA condensation and are p-H3 negative (left panel) (C). Scale bars, 10 μM.
Application of hiMAC to different cell cycle phase-dependent analyses
We have used hiMAC in three major applications, namely, the cell cycle phase-dependent analysis of DNA damage sources, pathway activities within subcellular organelles and colocalization pattern.
Investigation of the cell cycle dependence of pathway activities
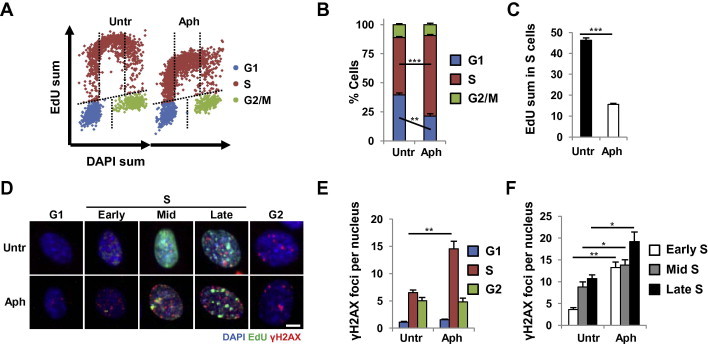
For this application, a microscopy-based readout for pathway activity is integrated into the hiMAC procedure. Such readout typically relies on the immunostaining of either reaction products or pathway components to reveal their subcellular localization or modification. We used his application to demonstrate the activation of specific DNA damage responses in G2-phase cells after the deletion of Nbs1 [8]. This application can also be used to measure cell cycle phase-dependent pathway activities under unperturbed conditions or in response to experimental treatments (genotoxic agents, inhibitors, gene deletions, etc.). As an example shown in Figure 4, we investigated the kinetics of γH2AX foci as a general DNA damage marker in the response of wild-type MEFs to DNA polymerase inhibitor, aphidicolin (Aph), at 200 nM, a concentration that permits replication at a reduced rate (Figure 4A). As expected, hiMAC analysis revealed accumulation of S-phase cells (Figure 4B), reduction of EdU incorporation (Figure 4C) and induction of γH2AX foci in early/mid/late S phase (Figure 4D−F), suggesting that DNA damage was highly specific to S phase and associated with impaired DNA replication.
Figure 4.
hiMAC mapping of primary DNA damage exemplified by aphidicolin
MEF cells untreated (Untr) or treated with 200 μM aphidicolin (Aph) for 12 h were stained with EdU, DAPI and γH2AX antibody. A. hiMAC cell cycle profiles. B. Cell cycle distribution. C. EdU signal intensities in S phase as a measure of DNA synthesis rate. D. Representative images of cells in indicated cell cycle phases. Quantification of γH2AX foci as a general marker of DNA damage is shown for cells in panel D in different cell cycle phases E. and different steps of S phase F. Significant difference in Aph-treated cells was indicated with asterisk, compared to the untreated cells in respective cell cycle phases (∗, P < 0.05; ∗∗, P < 0.01; ∗∗∗, P < 0.001). P values were generated by Student’s t-test (B and C) within the hiMAC analysis template, or by Kruskal–Wallis test with Mann Whitney test (E and F) by export of analysis results to GraphPad Prism software. Scale bars, 4 μM.
Investigation of the origin and fate of subcellular structures
In this application, a hiMAC time course is recorded after a specific treatment, such as chemical inhibitor treatment, gene deletion or knock-down by siRNA. hiMAC maps the cell cycle phase in which the structure of interest first appears. Analysis of the following time points then traces the structural changes during cell cycle progression. We have used this application to reveal the origin and progression of endogenous DNA damages and micronuclei (MN) in Nbs1-deleted cells [8]. For example, we assessed replication and homologous recombination activity in MN in Nbs1-deleted MEF cells [10] by quantifying EdU incorporation in all MN and Rad51 localization to damaged (γH2AX+) MN, respectively. As expected, replication occurred in MN in early/mid/late S phase but not in G1 or G2/M phases (Figure 5A and C). However, Rad51 signal appeared in damaged MN in late S phase and was maintained in G2/M phase (Figure 5B and C). These observations indicate a separation of replication and homologous recombination activity in MN, which has been similarly described for the main nucleus [11].
Figure 5.

hiMAC analysis of replication and recombination in micronuclei
MEF cells with inducible deletion of Nbs1 (5 DPO) were stained with γH2AX and Rad51 antibodies, EdU and DAPI. A. Representative images of EdU signal in micronuclei (MN). Arrowheads indicate EdU+ MN. B. Representative images of γH2AX and Rad51 signals in MN. Arrowheads indicate γH2AX-positive MN. C. Quantification of EdU incorporation as a measure of DNA synthesis and colocalization of Rad51 and γH2AX foci as a measure of recombination activity within MN for indicated cell cycle phases. Note that replication occurs in MN throughout S phase, whereas Rad51 accumulates in γH2AX-positive MN toward late S and G2/M phase. Significant difference in Nbs1-del cells was indicated with asterisk, compared to Ctrl cells in respective cell cycle phases (∗∗, P < 0.01; ∗∗∗, P < 0.001). P values were generated by Student’s t-test within the hiMAC analysis template. Scale bars, 4 μM.
Investigation of the interaction of macromolecules in a cell cycle-dependent manner
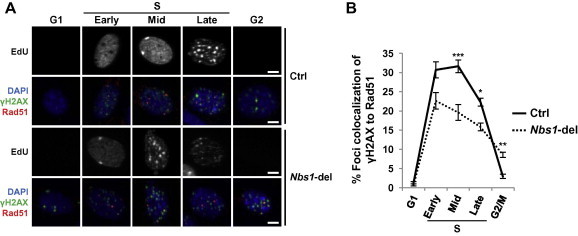
This application integrates e.g., immunostaining of two proteins in the hiMAC procedure to determine their interaction or relationship in any cell cycle phase. This application enabled us to follow the colocalization dynamics of DNA damage response proteins [8]. As an example, we analyzed the impact of decreased homologous recombination efficiency of Nbs1-deleted MEFs [10] on colocalization of Rad51 and γH2AX throughout the unperturbed cell cycle. Nbs1 deletion reduced spontaneous colocalization of Rad51 and γH2AX throughout S phase, but caused persistence of Rad51-γH2AX double positive foci in G2/M (Figure 6), indicating that homologous recombination activity is associated with unresolved replication damages in G2 phase [8].
Figure 6.
hiMAC analysis of protein colocalization into DNA damage foci
MEF cells without (Ctrl) or with (Nbs1-del) induced deletion of Nbs1 (6 DPO) were stained with γH2AX and Rad51 antibodies, EdU and DAPI. A. Representative images of Ctrl and Nbs1-del cells in indicated cell cycle phases. B. Quantification of colocalization of γH2AX foci to Rad51 foci in cells from A. Significant difference in Nbs1-del cells was indicated with asterisk, compared to Ctrl cells in respective cell cycle phases (∗, P < 0.05; ∗∗, P < 0.01; ∗∗∗, P < 0.001). P values were generated by Student’s t-test within the hiMAC analysis template. Scale bars, 4 μM.
The first two types of analysis can easily be applied to a defined cell sub-population, e.g., cells co-transfected with a fluorescence marker or a cell type expressing a specific lineage marker. Combination with genetic modification and small molecule inhibitors renders hiMAC a powerful approach to obtain functional data. hiMAC can be applied to virtually any proliferating adherent cells, which can incorporate the replication marker EdU into newly-synthesized DNA.
Discussion
We showed that hiMAC is a powerful method to study cell cycle phase-dependent cellular processes with high statistical power. Here, we discuss the advantages and drawbacks of hiMAC in comparison with potential alternative techniques, and point out the experimental limitations of this method.
Comparison with other methods
The use of visually assessable cell cycle stage markers for IF microscopy is an alternative for the cell cycle profiling step of hiMAC [12]. These markers include thymidine analog incorporation during replication (BrdU, EdU) and replication-associated proteins such as proliferating nuclear cell antigen (PCNA) and replication protein A (RPA) for S phase, cyclin B and kinetochore-associated proteins like centromere protein F (CENP-F) for G2 phase, and histone modifications like phospho-histone H3(pH3) for M phase. However, cell cycle staging by this approach depends on a combination of antibodies, which therefore restricts species compatibility and often leads to cross reactions with the antibodies that are used for the phenotype readout. In addition, cell cycle staging by IF microscopy of visually-assessable markers requires four channels (e.g., DAPI/RPA/CENP-F/pH3) in contrast to two channels by hiMAC. This renders inclusion of complex analysis parameters such as protein interactions almost impossible technically.
In comparison with hiMAC, cell synchronization approaches also allow cell cycle stage-specific biochemical analyses [13]. An efficient synchronization-release experiment circumvents the use of cell cycle markers and thus increases flexibility of imaging analysis. The disadvantages of such approaches are the high cell type dependence of synchronization efficiency and population homogeneity after release [13]. The population impurity caused by de-synchronization must be taken into account in the interpretation of results. hiMAC avoids resulting artifacts by allowing analysis of a stringently-defined cell cycle stage. Importantly, most synchronization protocols rely on either chemical drugs that target cell cycle regulators or the withdrawal of nutrients from the culture, all of which causes unphysiological challenges for cells and may therefore generate artifacts, particularly when analyzing processes related to cell cycle progression. Such stresses include replication fork damage by thymidine block and genomic instability by spindle poisoning. Data obtained from a single synchronization method can thus be strongly influenced by recovery from cell synchronization, which is circumvented in hiMAC by analysis of non-synchronized cells [14].
DAPI/EdU flow cytometry [15] is a good alternative to hiMAC for cell cycle profiling and can be combined with the measurement of whole-cell fluorescence intensities; however, it lacks the spatial resolution required for the analysis of subcellular structures. Microscopic analysis of cells immobilized after sorting by flow cytometry, imaging flow cytometry [16], and combination of flow cytometry with cell fractionation [17] are potential alternatives to hiMAC in particular for simple readouts such as overall protein levels. The major benefit of these approaches when compared with hiMAC is the high throughput achieved by integrating flow cytometry. However, these methods require detachment of adherent cells from the culture vessel, which often triggers stress responses and alteration of cell morphology and eventually precludes cell treatments with short kinetics. hiMAC is, in comparison, a relatively non-invasive approach.
Overall, hiMAC allows quantitative, statistically-powerful analysis of cell cycle phase-dependent cellular properties under physiological conditions in a large number of samples in a high-throughput format.
Limitations and other considerations
Since hiMAC is a microscopy-based approach, it suffers the same limitations as immunofluorescence microscopy in general, including a dependence on suitable antibodies and spatial resolution.
hiMAC analysis is most efficient when images are acquired with a high-content analysis microscope, which facilitates comparable exposure times between images, low sample bleaching and low hands-on time. For a small number of samples, our pipeline is compatible with manual image acquisition, but constant exposure durations in all channels are absolutely required for the generation of high-quality data.
The distinction between G0/G1 (2 N) and G2 (4 N) cells by hiMAC is based on DNA content. Some treatments can induce G0/G1 cells with 4 N chromosomes, e.g., as a consequence of endoreduplication or defective chromosome separation during mitosis. Combination of hiMAC with immunostaining of a G2-phase marker (CENP-F or cyclin B) can be used in a pilot experiment to assess the relevance of this potential artifact.
Conventional copper-catalyzed click chemistry quenches expressed fluorophores such as GFP. However, it is possible to restore the fluorescence by using an antibody directed against GFP. It is conceivable that novel click chemistry approaches to preserve GFP fluorescence will circumvent this technical issue.
In summary, we demonstrated that hiMAC is a versatile method to study DNA damage sources, pathway activities within subcellular organelles and protein colocalization patterns in a cell cycle phase-dependent manner. Its statistical power and high-throughput compatibility render hiMAC a useful approach for imaging analysis. It is conceivable that hiMAC will be applied for genome-wide screenings to identify factors involved in cell cycle phase-dependent processes.
Materials
Reagents
-
•
DMEM (Life Technologies, cat. No. 42430-082)
-
•
Fetal calf serum (FCS; Lonza, cat. No. DE14-802F)
-
•
L-glutamine (Life Technologies, cat. No. 25030-024)
-
•
Sodium pyruvate (Life Technologies, cat. No. 11360-039)
-
•
Penicillin–streptomycin (Life Technologies, cat. No. 15140-122)
-
•
EdU (Life Technologies, cat. No. E10187)
-
•
10 × PBS, pH 7.2 (Gibco, cat. No. 70013)
-
•
Formaldehyde solution (37% (wt/vol); Sigma, cat. No. F1635) !CAUTION Formaldehyde is very toxic if inhaled, ingested or absorbed through the skin.
-
•
Triton X-100 (Sigma, cat. No. T8787) !CAUTION Hazardous in case of eye contact, ingestion or inhalation.
-
•
Na3N (Sigma–Aldrich, cat. No. S2002) !CAUTION It is fatal if swallowed and contact with acids liberates very toxic gas.
-
•
TRIS (Roth, cat. No. AE15.3)
-
•
NaCl (Sigma, cat. No. S9888)
-
•
BSA (Sigma–Aldrich, cat. No. A2153)
-
•
Normal goat serum (ImmunoBioScience, cat. No. IHR-8136)
-
•
Anti-γH2AX antibody (Millipore, cat. No. 05-636)
-
•
Anti-Rad51 antibody (Millipore, cat. No. PC130)
-
•
Anti-GFP antibody (Life Technologies, cat. No. A21311)
-
•
Anti-rabbit IgG-Cy3 (Sigma, cat. No. C2306)
-
•
Anti-mouse IgG-FITC (Sigma, cat. No. F2883)
-
•
Alexa Fluor 647 azide (Life Technologies, cat. No. A10277)
-
•
(+) Sodium L-ascorbate (Sigma, cat. No. A4034)
-
•
Copper (II) sulfate pentahydrate (Sigma–Aldrich, cat. No. 209198) !CAUTION It is toxic if swallowed and causes skin and eye irritation.
-
•
DAPI (Life Technologies, D1306)
-
•
Plastic paraffin film (Sigma–Aldrich, cat. No. P7793)
Equipment
-
•
Imaging plates, 96-well (BD Biosciences, cat. No. 353219)
-
•
Biological safety cabinet
-
•
Cell culture incubator
-
•
BioTek MicroFlo Select Dispenser (Fisher Scientific) or a similar cell dispenser
-
•
Pathway 435 Bioimager (BD Biosciences) or a similar high-content analysis microscope
-
•
PC with Windows and MS EXCEL 2007–2013
Reagent setup
Cell culture medium: Supplement DMEM with 10% FCS, 2 mM L-glutamine, 1 mM sodium pyruvate, 100 units/ml penicillin and 100 μg/ml streptomycin; store at 4 °C for up to 1 week.
EdU labeling medium: Supplement cell culture medium with 8 μM EdU. Freshly prepare and store this solution for several hours at 4 °C.
1 × PBS Prepare 1 × PBS from 10 × PBS stock by diluting 1:10 with water; store at room temperature (RT) for up to 1 year.
Triton X-100: Prepare a 10% (vol/vol) Triton X-100 stock in water; store at RT.
Fixation/permeabilization solution: Freshly dilute 37% (wt/vol) formaldehyde 1:10 with 1 × PBS and add Triton X-100 to a final concentration of 0.1% (vol/vol); keep this reagent at RT.
Storage buffer: Prepare 0.1% (wt/vol) Na3N in 1 × PBS; store at 4 °C for several months.
10 × TBS: Dissolve 24 g TRIS and 88 g NaCl in water, adjust the pH value to 7.4 and fill up water to 1 l; store at RT.
BSA: Prepare a 5% (wt/vol) BSA in 1 × PBS; store aliquots at −20 °C.
Blocking solution: Mix 610 μl water with 100 μl 10 × TBS, 200 μl BSA stock solution, 50 μl goat serum and 40 μl 10% Triton X-100. Freshly prepare and store this solution at 4 °C for several days.
Primary antibody solution: Dilute primary antibodies (anti-γH2AX, anti-Rad51) at 1:200 in blocking solution. Freshly prepare and store the solution on ice.
Secondary antibody solution: Dilute secondary antibodies (anti-rabbit IgG-Cy3, anti-mouse IgG-FITC) at 1:200 in blocking solution. Freshly prepare and store the solution on ice protected from light.
DAPI stock solution: Prepare a 1 μg/ml DAPI solution in water; store aliquots at −20 °C.
DAPI staining solution: Dilute DAPI stock solution 1:1000 with 1 × PBS. Freshly prepare and store this solution on ice.
Alexa Fluor 647 azide stock solution: Prepare a 1 mM Alexa Fluor 647 azide solution in DMSO; store aliquots at −20 °C.
Sodium L-ascorbate: Freshly prepare 10 mM (+) sodium L-ascorbate in water, store on ice and avoid exposure to air.
CuSO4: Prepare 100 mM CuSO4 in water; store at RT for several months.
Click reaction cocktail: Mix 878 μl 1 × PBS with 2 μl Alexa Fluor 647 azide stock solution and 100 μl sodium L-ascorbate stock solution, add 20 μl CuSO4 stock solution. Freshly prepare this solution.
Equipment setup
CellProfiler: Download and install CellProfiler software version 2.1.0 or higher [7] (http://www.cellprofiler.org/) on your computer. Download and extract the Files S1 “CellProfiler File and Folder Nomenclature guide”, S2 “hiMAC positive control images” and S3 “CellProfiler hiMAC pipelines”. Copy the extracted CellProfiler pipeline files (from File S3) to the default output folder of your CellProfiler software. Generate the subfolder “ControlWell A01” within the default input folder of your CellProfiler software and copy the extracted positive control images (from File S2) into this subfolder.
hiMAC analysis template: Download and extract the Files S4 “hiMAC_analysis_file_1.0” and S5 “Example CellProfiler output”. Open the extracted hiMAC analysis file in MS EXCEL 2007–2013 and activate dynamic content (“Macros”). You may import the example CellProfiler output file from File S5 to test the template.
Procedure
This procedure describes the handling of cells on thin-bottom 96-well dishes. For the use of 12 mm diameter coverslips, scale up the culture volumes proportionally to the corresponding culture vessel, but use the indicated volumes for blocking solution, antibody solution, click reaction cocktail and DAPI staining solution. Embed coverslips in DAPI-free mounting medium before microscopy. While any adherent cell type can be used, we describe a protocol optimized for the analysis of Rad51 and γH2AX foci during cell cycle progression in MEFs with the inducible deletion of Nbs1 as presented in Figure 2.
Cell culture preparation (TIMING: 1–3 d)
-
1.
Passage cells 1–3 d before EdU incubation to achieve a confluence of 30%−75% on the day of the EdU pulse. Use a cell dispenser for 96-well dishes to ensure homogeneous cell seeding. Seed triplicate wells for each sample to rule out staining artifacts.
CRITICAL STEP Low cell densities affect autofocus quality during image acquisition and increase acquisition time. High cell densities affect cell cycle distribution.
EdU pulse labeling, fixation and permeabilization (TIMING: 1 h and 15 min)
-
2.
Prepare EdU labeling medium and equilibrate it at 37 °C.
-
3.
Remove part of the cell culture medium from the experimental dishes. Leave 100 μl per well.
-
4.
Add 100 μl of warm EdU-containing medium into each well, mix carefully and return the dishes to the incubator for 30 min. Avoid cooling of medium and samples.
-
5.
Aspirate off the medium and rinse cells once with 1 × PBS.
-
6.
Fix the cells in 100 μl of fixation/permeabilization solution for 20 min at RT.
CRITICAL STEP Cell fixation and permeabilization must be optimized for each primary antibody.
-
7.
Wash the cells 3 times with 1 × PBS for 5 min each.
PAUSE POINT Samples can be sealed with plastic paraffin film and kept in storage buffer at 4 °C for several weeks.
Sample staining (TIMING: 14–18 h)
-
8.
Completely aspirate off the PBS and add 30 μl of blocking solution per well.
CRITICAL STEP Blocking solution composition and antibody incubation conditions must be optimized for each primary antibody.
-
9.
Incubate samples for 30 min at RT.
-
10.
Completely aspirate off the blocking solution and add 30 μl of primary antibody solution per well.
-
11.
Incubate samples overnight at 4 °C.
-
12.
Wash the cells 3 times with 1 × PBS for 5 min. Handle samples in the dark from the next step.
-
13.
Completely aspirate off the PBS and add 30 μl of secondary antibody solution per well.
-
14.
Incubate the samples for 1 h at RT.
-
15.
Wash the cells 2 times with 1 × PBS for 5 min.
-
16.
Prepare the click reaction cocktail.
-
17.
Completely aspirate off the PBS and add 35 μl of click reaction cocktail per well.
-
18.
Incubate samples for 60 min at RT.
-
19.
Wash the cells once with 1 × PBS for 5 min.
-
20.
Prepare DAPI staining solution.
-
21.
Aspirate off the PBS completely and add 100 μl of DAPI staining solution per well.
-
22.
Incubate samples for 15 min at RT.
-
23.
Wash the cells twice with 1 × PBS for 5 min each.
PAUSE POINT Samples can be sealed with plastic paraffin film and kept in storage buffer at 4 °C in the dark for several weeks.
Microscopy setup (TIMING: 1 h)
-
24.
Select any microscope for automated image acquisition.
CRITICAL STEP Confocal microscopy facilitates the resolution of small, non-planar structures such as protein foci and may thus strongly improve automated object recognition and reliable quantification. Use non-confocal fluorescence microscopy instead of confocal microscopy if possible (e.g., for pure cell cycle profiling) as confocal imaging strongly increases acquisition durations. Homogeneous illumination of the optical field is crucial.
-
25.
Select an objective with a suitable magnification to resolve the desired structural information (10 × for cell cycle profiling; 20 × for large nuclear foci and 40 × for small nuclear foci).
-
26.
Optimize the exposure time for each channel to obtain high signal intensities while avoiding signal saturation.
CRITICAL STEP Clearly positive cells from the sample with the strongest staining must be used for exposure time optimization to avoid signal saturation. These are mitotic cells for the DAPI channel and mid-to-late S-phase cells for the EdU channel from an untreated asynchronous cell population.
TROUBLESHOOTING
-
27.
Optimize the optical auto-focus function for the DAPI channel, starting from 5 focusing steps with a step distance of 1 μM.
TROUBLESHOOTING
-
28.
Determine the z offset of each channel, which is the distance between a perfectly-focused image of the respective channel and the z position of the DAPI channel obtained by auto-focusing.
-
29.
Optional: Optimize the settings for all confocal channels (number of z-stacks, distance between z-stacks) for highest detail resolution, starting from 4 stacks with a stack thickness of 1 μM.
-
30.
Set up an image acquisition assay: In each optical field, auto-focus on the DAPI channel and record all channels, taking into account the z offsets determined above. Record at least 1000 nuclei per sample.
CRITICAL STEP The number of cells recorded determines the statistical significance of your results. Increase the amount of cells accordingly when analyzing specific, small cell populations such as late-G2/M cells.
Image acquisition [TIMING: 15 min–4 h for 6 wells (2 samples in triplicates), depending on magnification, duration of exposure and confocal vs. non-confocal]
-
31.
Run the image acquisition assay.
Setup of the image analysis pipeline (TIMING: 2 h)
-
32.
Copy image sets into the CellProfiler default input folder as described in the CellProfiler File and Folder Nomenclature guide (File S1 “hiMAC manuals.zip”).
-
33.
Select a positive control image set from your image acquisition, which contains all features to be analyzed (or the example image set in File S2).
-
34.
Open the CellProfiler software.
-
35.
Open a CellProfiler pipeline (File S3) according to the desired type of analysis as summarized in Table 1.
-
36.
Using the positive control image set from step 33, optimize parameters in the CellProfiler pipeline by following the optimization guideline (File S1).
TROUBLESHOOTING
Table 1.
Summary of hiMAC CellProfiler analysis pipelines
| No. of colors | No. of foci types | MN analyzed | CellProfiler pipeline file name |
|---|---|---|---|
| 4 | 2 | + | CP_hiMAC_pipeline_complete.cppipe |
| 4 | 2 | − | CP_hiMAC_pipeline_4-colors_2-foci-types_no-MN.cppipe |
| 4 | 1 | + | CP_hiMAC_pipeline_4-colors_1-foci-type_MN.cppipe |
| 4 | 1 | − | CP_hiMAC_pipeline_4-colors_1-foci-type_no-MN.cppipe |
| 4 | - | + | CP_hiMAC_pipeline_4-colors_no-foci_MN.cppipe |
| 4 | - | − | CP_hiMAC_pipeline_4-colors_no-foci_no-MN.cppipe |
| 3 | 1 | + | CP_hiMAC_pipeline_3-colors_1-foci-type_MN.cppipe |
| 3 | 1 | − | CP_hiMAC_pipeline_3 colors_1-foci-type_no-MN.cppipe |
| 3 | - | + | CP_hiMAC_pipeline_3-colors_no-foci_MN.cppipe |
| 3 | - | − | CP_hiMAC_pipeline_3-colors_no-foci_no-MN.cppipe |
| 2 | - | + | CP_hiMAC_pipeline_2-colors_MN.cppipe |
| 2 | - | − | CP_hiMAC_pipeline_2-colors_no-MN.cppipe |
Note: The names of the supplied CellProfiler pipelines for specific analysis purposes are listed. The choice of the pipeline file depends on the number of fluorescence channels, the number of different foci types and whether micronuclei (MN) are analyzed (+) or not (−).
Image analysis (TIMING: 30 min–1 h for 100 image sets)
-
37.
Run the optimized CellProfiler pipeline on all acquired images.
Data analysis (TIMING: 1–2 h)
-
38.
Move all CellProfiler output files and the hiMAC analysis file (File S4) into a new analysis folder.
-
39.
Open the hiMAC analysis file and follow either the short instructions in the file or the detailed instructions in the user manual (File S1) to import and analyze data.
TROUBLESHOOTING
-
40.
For manual data analysis, refer to the documentation of the technical background of the hiMAC analysis file (File S1).
Troubleshooting
High quality image acquisition is essential for the generation of hiMAC profiles. Potential problem sources during image acquisition are sub-optimal auto-focusing, definition of incorrect distances between focus planes of the selected color channels, inhomogeneous illumination of the optical field, overexposure, and insufficient compensation of the chromatic aberration between different color channels by the microscope hardware, which may lead to a small distortion of images in different color channels. To ensure optimal image quality, we advise to prepare samples in thin-bottom 96-well dishes instead of coverslips, carefully optimize the autofocus function, measure the distance between optimal focus planes of different channels, and determine the dynamic range of exposure durations for several samples. Distortion of images recorded in different color channels can be compensated for by including additional modules in the CellProfiler analysis pipeline. Detailed troubleshooting advice can be found in Table 2.
Table 2.
Troubleshooting table
| Step | Problem | Reason | Solution |
|---|---|---|---|
| 26 | GFP signal is lost | Click reaction bleaches GFP | Apply an anti-GFP antibody in Step 10 to detect GFP protein |
| 27 | DAPI auto-focus is not stable | Mounting medium may cause a fuzzy DAPI staining affecting the contrast of nuclear edges | Prepare your samples on 96-well dishes instead of coverslips; test another fluorescence channel for auto-focusing |
| 36 | Images from a specific channel appear unfocused | The focusing plane is incorrect | Optimize the z offset in Step 28 |
| Images from different color channels appear shifted | Components in the light path cause a systematic XY shift (e.g., for confocal vs. non-confocal images) | Call the service for microscope calibration; implement a compensatory XY shift in the image acquisition procedure in Step 30; include a “crop” module in the CellProfiler pipeline in Step 36 for each channel and compensate for the XY shift by different cropping positions | |
| Images from different color channels appear scaled/distorted | The chromatic aberration is insufficiently compensated for by the microscope hardware | Include “resize” and “crop” modules in the CellProfiler pipeline in Step 36 for each channel and compensate by enlarging images of the high wavelength channels (e.g., red, far red) and cropping to the original size to achieve optimal overlay with the DAPI channel | |
| 39 | Buttons in the hiMAC analysis file to not work | Macros are inactivated | Enable dynamic content/macros when opening the analysis file |
| Insufficient separation of G1/S/G2 populations in the cell cycle diagrams of the hiMAC analysis file | Signal variation between images or uneven illumination of the optical field cause imprecise measurement of DAPI and EdU intensities | Apply normalization in the hiMAC template for compensation; use the illumination correction function in the CellProfiler pipeline | |
| Insufficient separation of early G2 and late G2/M phases | The DAPI channel was saturated during image acquisition | Optimize DAPI exposure time for mitotic cells in Step 26 |
Timing
Step 1, cell culture preparation: 1–3 d
Steps 2–7, EdU pulse labeling, fixation and permeabilization: 1 h and 15 min
Steps 8–23, sample staining: 14–18 h
Steps 24–30, microscopy setup: 1 h
Step 31, image acquisition: 15 min−4 h for 6 wells
Steps 32–36, setup of the image analysis pipeline: 2 h
Step 37, image analysis: 30 min−1 h for 100 image sets
Steps 38–40, data analysis: 1–2 h
Authors’ contributions
Z-QW conceived and supervised the project. CB developed the protocol, pipelines and analysis files. TK tested and modified the pipelines and analysis files. CB and Z-QW wrote the manuscript. All authors read and approved the final manuscript.
Competing interests
The authors declare no competing financial interests.
Acknowledgements
We thank SJ Smith for reading and editing the manuscript and members of Z-QW’s laboratory for helpful discussion. CB was supported by a fellowship from the Studienstiftung des Deutschen Volkes of Germany. This work was supported in part by the Deutsche Forschungsgemeinschaft (DFG; Grant Nos. WA2627/1-1 and WA2627/5-1) of Germany.
Footnotes
Peer review under responsibility of Beijing Institute of Genomics, Chinewse Academy of Sciences and Genetics Society of China.
Supplementary data
hiMAC manuals. This zipped archive contains the following user manuals including CellProfiler file and folder nomenclature, CellProfiler hiMAC optimization guideline, user manual for hiMAC analysis file and technical background hiMAC template. All files are available as PDF.
hiMAC positive control images. This archive contains a set of 4 control images (DAPI – n000001 for DAPI, CY5 – n000001 for EdU, TRITC Confocal – n000001 for γH2AX and FITC – Confocal – n000001 for rad51) for the testing and optimization of the CellProfiler pipelines. The image set belongs to the Nbs1 deleted sample from the analysis in Figure 1C−G.
CellProfiler hiMAC pipelines. This archive contains the CellProfiler pipeline files. Please check Table 1 to find out which pipeline file is suitable for your analysis.
hiMAC analysis file 1.0. This archive contains the MS Excel file (for Excel 2007 and higher), which facilitates the import of CellProfiler output files to perform cell cycle profiling and phenotyping.
Example CellProfiler output. This archive contains two CellProfiler output files (tab separated text format), which can be imported into the hiMAC analysis template for testing. The analysis is similar to the one from Figure 1 C−G. Mouse embryonic fibroblasts with and without Nbs1 deletion were pulse labeled with EdU, fixed and stained with DAPI (blue), EdU (far red) and antibodies against γH2AX (green) and Rad51 (red). All possible parameters were quantified in CellProfiler and can be analyzed by importing into the hiMAC analysis file. The wells B02, C02 and D02 are control cells, whereas wells E02, F02 and G02 are for Nbs1 deleted cells.
References
- 1.Malumbres M., Barbacid M. Cell cycle, CDKs and cancer: a changing paradigm. Nat Rev Cancer. 2009;9:153–166. doi: 10.1038/nrc2602. [DOI] [PubMed] [Google Scholar]
- 2.Antico Arciuch V.G., Elguero M.E., Poderoso J.J., Carreras M.C. Mitochondrial regulation of cell cycle and proliferation. Antioxid Redox Signal. 2012;16:1150–1180. doi: 10.1089/ars.2011.4085. [DOI] [PMC free article] [PubMed] [Google Scholar]
- 3.Branzei D., Foiani M. Regulation of DNA repair throughout the cell cycle. Nat Rev Mol Cell Biol. 2008;9:297–308. doi: 10.1038/nrm2351. [DOI] [PubMed] [Google Scholar]
- 4.Cai L., Tu B.P. Driving the cell cycle through metabolism. Annu Rev Cell Dev Biol. 2012;28:59–87. doi: 10.1146/annurev-cellbio-092910-154010. [DOI] [PubMed] [Google Scholar]
- 5.David M., Petit D., Bertoglio J. Cell cycle regulation of Rho signaling pathways. Cell Cycle. 2012;11:3003–3010. doi: 10.4161/cc.21088. [DOI] [PMC free article] [PubMed] [Google Scholar]
- 6.Moses J.E., Moorhouse A.D. The growing applications of click chemistry. Chem Soc Rev. 2007;36:1249–1262. doi: 10.1039/b613014n. [DOI] [PubMed] [Google Scholar]
- 7.Kamentsky L., Jones T.R., Fraser A., Bray M.A., Logan D.J., Madden K.L. Improved structure, function and compatibility for Cell Profiler: modular high-throughput image analysis software. Bioinformatics. 2011;27:1179–1180. doi: 10.1093/bioinformatics/btr095. [DOI] [PMC free article] [PubMed] [Google Scholar]
- 8.Bruhn C., Zhou Z.W., Ai H., Wang Z.Q. The essential function of the MRN complex in the resolution of endogenous replication intermediates. Cell Rep. 2014;6:182–195. doi: 10.1016/j.celrep.2013.12.018. [DOI] [PubMed] [Google Scholar]
- 9.Bennett B.T., Bewersdorf J., Knight K.L. Immunofluorescence imaging of DNA damage response proteins: optimizing protocols for super-resolution microscopy. Methods. 2009;48:63–71. doi: 10.1016/j.ymeth.2009.02.009. [DOI] [PMC free article] [PubMed] [Google Scholar]
- 10.Yang Y.G., Saidi A., Frappart P.O., Min W., Barrucand C., Dumon-Jones V. Conditional deletion of Nbs1 in murine cells reveals its role in branching repair pathways of DNA double-strand breaks. EMBO J. 2006;25:5527–5538. doi: 10.1038/sj.emboj.7601411. [DOI] [PMC free article] [PubMed] [Google Scholar]
- 11.Su X., Bernal J.A., Venkitaraman A.R. Cell-cycle coordination between DNA replication and recombination revealed by a vertebrate N-end rule degron-Rad51. Nat Struct Mol Biol. 2008;15:1049–1058. doi: 10.1038/nsmb.1490. [DOI] [PubMed] [Google Scholar]
- 12.Kurzawa L., Morris M.C. Cell-cycle markers and biosensors. Chembiochem. 2010;11:1037–1047. doi: 10.1002/cbic.200900729. [DOI] [PubMed] [Google Scholar]
- 13.Banfalvi G. Overview of cell synchronization. Methods Mol Biol. 2011;761:1–23. doi: 10.1007/978-1-61779-182-6_1. [DOI] [PubMed] [Google Scholar]
- 14.Cooper S. Rethinking synchronization of mammalian cells for cell cycle analysis. Cell Mol Life Sci. 2003;60:1099–1106. doi: 10.1007/s00018-003-2253-2. [DOI] [PMC free article] [PubMed] [Google Scholar]
- 15.Cecchini M.J., Amiri M., Dick F.A. Analysis of cell cycle position in mammalian cells. J Vis Exp. 2012 doi: 10.3791/3491. [DOI] [PMC free article] [PubMed] [Google Scholar]
- 16.Calvert M.E., Lannigan J.A., Pemberton L.F. Optimization of yeast cell cycle analysis and morphological characterization by multispectral imaging flow cytometry. Cytometry A. 2008;73:825–833. doi: 10.1002/cyto.a.20609. [DOI] [PMC free article] [PubMed] [Google Scholar]
- 17.Rosner M., Schipany K., Hengstschlager M. Merging high-quality biochemical fractionation with a refined flow cytometry approach to monitor nucleocytoplasmic protein expression throughout the unperturbed mammalian cell cycle. Nat Protoc. 2013;8:602–626. doi: 10.1038/nprot.2013.011. [DOI] [PubMed] [Google Scholar]
Associated Data
This section collects any data citations, data availability statements, or supplementary materials included in this article.
Supplementary Materials
hiMAC manuals. This zipped archive contains the following user manuals including CellProfiler file and folder nomenclature, CellProfiler hiMAC optimization guideline, user manual for hiMAC analysis file and technical background hiMAC template. All files are available as PDF.
hiMAC positive control images. This archive contains a set of 4 control images (DAPI – n000001 for DAPI, CY5 – n000001 for EdU, TRITC Confocal – n000001 for γH2AX and FITC – Confocal – n000001 for rad51) for the testing and optimization of the CellProfiler pipelines. The image set belongs to the Nbs1 deleted sample from the analysis in Figure 1C−G.
CellProfiler hiMAC pipelines. This archive contains the CellProfiler pipeline files. Please check Table 1 to find out which pipeline file is suitable for your analysis.
hiMAC analysis file 1.0. This archive contains the MS Excel file (for Excel 2007 and higher), which facilitates the import of CellProfiler output files to perform cell cycle profiling and phenotyping.
Example CellProfiler output. This archive contains two CellProfiler output files (tab separated text format), which can be imported into the hiMAC analysis template for testing. The analysis is similar to the one from Figure 1 C−G. Mouse embryonic fibroblasts with and without Nbs1 deletion were pulse labeled with EdU, fixed and stained with DAPI (blue), EdU (far red) and antibodies against γH2AX (green) and Rad51 (red). All possible parameters were quantified in CellProfiler and can be analyzed by importing into the hiMAC analysis file. The wells B02, C02 and D02 are control cells, whereas wells E02, F02 and G02 are for Nbs1 deleted cells.