

Abstract
Background
The large placebo effect observed in prior acupuncture trials presents a substantial challenge for interpretation of the efficacy of acupuncture. We sought to evaluate the relationship between response expectancy, a key component of the placebo effect over time, and treatment outcome in real and sham electroacupuncture (EA).
Methods
We analyzed data from a randomized controlled trial of EA and sham acupuncture (SA) for joint pain attributable to aromatase inhibitors among women with breast cancer. Responders were identified using the Patient Global Impression of Change instrument at Week 8 (end of intervention). The Acupuncture Expectancy Scale (AES) was used to measure expectancy four times during the trial. Linear mixed-effects models were used to evaluate the association between expectancy and treatment response.
Results
In the wait list control group, AES remained unchanged over treatment. In the SA group, Baseline AES was significantly higher in responders than nonresponders (15.5 vs 12.1, P = .005) and AES did not change over time. In the EA group, Baseline AES scores did not differ between responders and nonresponders (14.8 vs 15.3, P = .64); however, AES increased in responders compared with nonresponders over time (P = .004 for responder and time interaction term) with significant difference at the end of trial for responders versus nonresponders (16.2 vs 11.7, P = .004).
Conclusions
Baseline higher response expectancy predicts treatment response in SA, but not in EA. Divergent mechanisms may exist for how SA and EA influence pain outcomes, and patients with low expectancy may do better with EA than SA.
Acupuncture, a component of the centuries old traditional Chinese medicine paradigm (1), has shown promise among patients with cancer for treatment of toxicities such as nausea, fatigue, and pain (2). To build a strong evidence base for acupuncture in survivorship care, large randomized controlled trials are needed to establish the efficacy of acupuncture for symptom management in cancer (2). While acupuncture has been found to be more effective than standard care or usual care in many large RCTs for chronic pain in noncancer populations, the large effect seen in the sham acupuncture (SA) group introduces great uncertainty in evaluating and interpreting the efficacy of acupuncture in the randomized setting (3). Indeed, a recent meta-analysis found that SA was much more effective than sham oral pharmaceutical placebos for migraine prophylaxis (4). Although the response to SA has led skeptics to consider the acupuncture effect no more than placebo, it remains quite possible that the sham interventions being studied are non-inert or acting via a different mechanism (5). Further evaluation of the contribution of the placebo effect to acupuncture is essential to addressing these methodological challenges about efficacy and to advancing the science of the field.
Response expectancy is defined as, “expectations held by the individual about one’s own emotional and physiological response” to a treatment and is a critical component of the placebo response (6). Expectancy can be based upon a prior stimulus (eg, prior acupuncture or a similar intervention), the environment (eg, confidence in the practitioner), or learned conditioning (7). Evaluation of the association of expectancy with response to acupuncture has yielded mixed results (8), but a large study in noncancer pain populations found Baseline expectancy predicted treatment response (9).
Despite the growing recognition of the importance of evaluating expectancy and elucidating the nonspecific effect of acupuncture, prior research has not used a validated instrument to evaluate response expectancy in the context of acupuncture. In addition, the majority of acupuncture studies evaluating response expectancy to date have measured expectancy only once at Baseline, when expectancy can change over time (10). Thus, this study aims to evaluate the association between response expectancy as measured by the Acupuncture Expectancy Scale (AES) (11,12), and treatment response to real and sham electroacupuncture (EA) for the treatment of aromatase inhibitor (AI)-associated arthralgia among women with breast cancer (13). The specific research questions of the study were: 1) Does Baseline expectancy predict pain reduction in the EA or SA groups? and 2) Does expectancy change with respect to responder status over the course of treatment in the EA or SA groups?
Materials and methods
Participants and Procedures
The details of the original trial have been published elsewhere (13). In brief, women with breast cancer who were experiencing arthralgia attributed to aromatase inhibitor therapy were randomized to an EA, SA, or a wait list control (WLC) usual care group. Patients were eligible if they had pain for at least 3 months of 4/10 or greater on a 0–10 numerical rating scale. Patients with metastatic disease or a bleeding disorder were excluded.
The EA regimen used a manualized protocol, which was formulated on the basis of the “Bi Syndrome” in Traditional Chinese Medicine, and was developed via our feasibility trial (14). The acupuncturists inserted and manipulated the needles (30 or 40mm, and 0.25mm gauge; Seirin-America, Inc, Weymouth, MA) until the “de qi” sensation was achieved. They connected electrodes to the four needles adjacent to the most painful joints, and applied 2-Hz electrostimulation with a TENS unit.
Patients randomized to SA had eight to twelve nonpenetrative Streitberger needles placed at nonacupuncture non-trigger points at least 5cm from their most painful joint. A Streitberger needle functions like a stage dagger, whereby the needle retracts into the handle with placement and is held in place by a gauze retention device. The acupuncturist applied a TENS unit to the Streitberger needles, and turned a knob so that the patient could see a blinking light but did not receive any electrical pulse. Patients in the EA and SA groups received treatments twice per week for 2 weeks followed by six weekly treatments for a total of 10 sessions.
Measurement of Expectancy
We measured response expectancy using the AES at Baseline, Week 2, Week 4, and Week 8 (end of intervention). The AES is a validated instrument that contains four items to evaluate response expectancy, each with a 5-point Likert scale ranging from 1 to 5. It has excellent internal consistency, with a Cronbach’s α 0.95. The instrument has very good test–retest reliability, and is responsive to change over an 8-week treatment period. It was specifically designed for use in acupuncture research and has been validated in the oncology setting (11,12). The scores range between 4 and 20, with a higher score indicating greater expectancy.
Measurement of Treatment Response
Treatment response was determined by the Patient Global Impression of Change (15) at Week 8, the end of treatment. This balanced 7-point scale has been used extensively in clinical trials to evaluate the clinical importance of changes. Patients were asked how much change they have experienced in their joint pain as compared with Baseline. Those patients who reported that their joint pain was “much improved” or “very much improved” were regarded as responders, while all others were classified as nonresponders (16).
Percent Pain Reduction
The pain severity score was measured using the Brief Pain Inventory (BPI). The BPI is a patient-reported outcome instrument for the measurement of pain with demonstrated reliability, validity, and responsiveness to change among patients with cancer (17). We calculated percent pain reduction using the difference in BPI severity domain (average of four pain severity items) between Week 8 and Baseline divided by Baseline values.
Statistical Analyses
The sample size for the study was set by the parent trial with the primary intention to determine the effect of EA as compared with WLC (13). We evaluated the AES score descriptively over time in the WLC group as well as in the EA/SA groups stratified by responder status. To evaluate whether Baseline expectancy predicts treatment response, we first tested the interaction between responder status and treatment group in predicting Baseline expectancy. We then built a multivariate linear regression model with percent reduction in BPI severity as the dependent variable, and Baseline expectancy and treatment group (EA or SA) as independent variables, including the expectancy and treatment group interaction term. Based on this model, we then developed expected percent BPI severity reduction based on the expectancy score for EA and SA at Baseline. Next, we tested whether expectancy changed over the course of acupuncture. Because the expectancy score was measured repeatedly over time, we developed linear mixed-effects models (18) with expectancy as the outcome. For WLC we tested whether expectancy changed by time, as there was only one responder. We first tested a three-way interaction with expectancy as the dependent variable and with treatment group, responder status, and time as the independent variables. We then developed models for EA and SA separately with responder status and time as covariates. We treated time as a categorical variable and included a random intercept term in the mixed-effects model. To evaluate whether change in expectancy over time differed between responders and nonresponders, we tested for time and responder interactions in both EA and SA groups. All analyses were two-sided with a P value of less than .05 for group comparisons and .10 for interaction terms indicating statistical significance. Statistical analyses were conducted using STATA (version 12.0; STATA Corporation, College Station, TX) and SAS (version 9.2; SAS Institute, Inc, Cary, NC).
Results
As previously reported (13), we screened 159 and enrolled 76 patients between September 2009 and May 2012. Of the 76 patients who qualified for Baseline evaluation, nine were further excluded (seven had patient-reported pain levels lower than the inclusion criteria, one had severe pain unrelated to aromatase inhibitors, and another did not want to participate), and the 67 eligible participants were randomly assigned to EA, SA, or WLC. Among participants, 21 (95.4%) in the EA group and 20 (90.5%) in the SA group received all 10 treatments. Four (6%) among all randomized were lost to follow-up before Week 8 and were not included in the main analyses (Figure 1).
Figure 1.

Screening, randomization, and completion of eight-week evaluations.
Table 1 shows Baseline data for the 67 participants. The mean age of the women enrolled was 59.7 years (range: 41– 76). Forty-eight women (71.6%) were white, while sixteen (23.9%) were black. Forty-four patients (66%) were receiving anastrozole at the time of randomization. The Baseline AES was 14.5, standard deviation (SD) = 2.7, ranging between 7 and 20. It did not differ among all three groups. By end of treatment at Week 8, 11 (55%) of the patients in the SA group and 12 (57.1%) in the EA group were responders based on the Patient Global Impression of Change, while only one (4.5%) in the WLC group was a responder.
Table 1.
Baseline characteristics of the study participants*
| Variables | EA, No. (%) | SA, No. (%) | WLC, No. (%) |
|---|---|---|---|
| (N = 22) | (N = 22) | (N = 23) | |
| Age, y | 57.5±10.1 | 60.9±6.5 | 60.6±8.2 |
| Race | |||
| White | 13 (59) | 17 (77) | 18 (78) |
| Non-white | 9 (41) | 5 (23) | 5 (22) |
| Employment | |||
| Employed | 14 (64) | 12 (55) | 12 (52) |
| Not employed | 8 (36) | 10 (45) | 11 (48) |
| Education | |||
| High school or less | 2 (9) | 3 (14) | 5 (22) |
| College or above | 20 (91) | 19 (86) | 18 (78) |
| Aromatase inhibitors | |||
| Anastrozole (Arimidex) | 13 (59) | 16 (73) | 15 (65) |
| Letrozole (Femara) | 4 (18) | 4 (18) | 4 (17) |
| Exemestane (Aromasin) | 5 (23) | 2 (9) | 4 (17) |
| Acupuncture Expectancy Scale Score | 14.8±2.5 | 13.7±2.9 | 14.9±2.5 |
* Plus–minus values are means ± standard deviation unless otherwise noted. Variables did not differ significantly among groups. EA = electroacupuncture; SA = sham acupuncture; WLC = wait list control.
Predicting Response by Baseline Expectancy Score
Baseline expectancy differs significantly based on the responder status and treatment group interactions (P = .015). Within the SA group, baseline AES was significantly associated with responder status at Week 8 (15.5 vs 12.1, P = .005); in contrast, in the EA group, Baseline expectancy scores did not differ between responders and nonresponders (14.8 vs 15.3, P = .64), see Figure 2.
Figure 2.
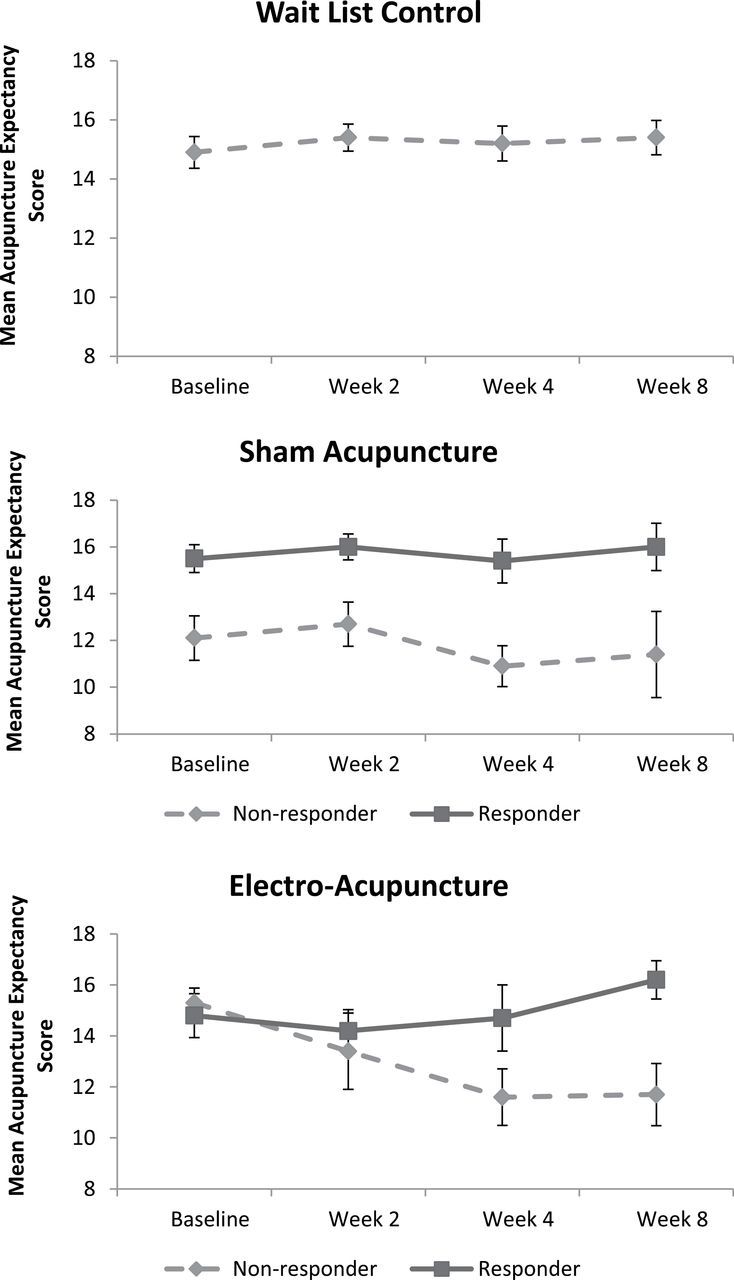
Change in Acupuncture Expectancy Score over time by group. In the Wait List Control group, only one patient was a responder, so we did not stratify by responder status.
In the multivariate model (see Table 2) with Week 8 percent pain severity reduction as the dependent outcome, we found a Baseline AES and treatment group interaction (P = .056). Each point increase in Baseline expectancy in the SA group is significantly associated with a greater percent pain reduction at Week 8 (regression coefficient = 7.9, SE= 2.8, P = .007). In contrast, we found no association between Baseline AES and percent pain reduction in the EA group (P = .89). Based on this model (Table 2), we developed calculated percent pain reduction based on Baseline AES (see Figure 3). As illustrated, at low level of AES, EA is substantially better than SA. At higher Baseline expectancy, percent pain reduction increased in the SA group and ultimately surpassed EA.
Table 2.
Predictors of percent reduction in Brief Pain Inventory (BPI) severity at Week 8–multivariate regression analysis*
| Coefficient | 95% CI | P | |
|---|---|---|---|
| Treatment (Sham acupuncture as reference) | 114.3 | −11.8 to 240.4 | .074 |
| Baseline expectancy score† | 7.9 | 2.3 to 13.5 | .007 |
| Treatment × baseline expectancy score‡ | −8.3 | −16.8 to 0.2 | .056 |
| Constants | −67.6 | −147.9 to 12.6 | .096 |
* CI = confidence interval.
† Expectancy measured by the Acupuncture Expectancy Scale.
‡ When interaction occurs, the individual term cannot be interpreted by itself. The individual term and the interaction term should be combined in explaining the dependent variable.
Figure 3.

Modeled pain outcome over baseline expectancy score. Percent Brief Pain Inventory (BPI) reduction at Week 8 in the sham acupuncture (SA) group equals −67.6 + 7.88 × Acupuncture Expectancy Scale (AES) score at baseline. Percent BPI reduction at Week 8 in the electroacupunture (EA) group equals −67.6 + 7.88 × AES at baseline + 114.3 − 8.31 × AES at baseline.
Change in Expectancy Score Based on Responder Status
Figure 2 demonstrates expectancy over time by treatment groups and responder status. In the WLC group, expectancy remained constant over time with a Baseline mean value of 14.9 and a Week 8 mean value of 15.4, P = .72 for trend. We found a three-way interaction among treatment group, time, and responder status (P = .078) in modeling the change in expectancy during acupuncture. In the SA group, there was no responder and time course interaction (P = .83), indicating that responders had persistently higher AES scores throughout the randomized controlled trial. In contrast, responders to EA had a higher expectancy relative to nonresponders (P = .004 for interaction term). At Week 8, expectancy was significantly higher in the responder group than in the nonresponder group (16.2 vs 11.7, P = .004).
Discussion
Patients receiving either EA or SA experienced improved joint pain over the 8 weeks of the trial, but the association with expectancy differed between the two groups. EA produced consistent and clinically important pain reduction (30% or greater) (19) regardless of Baseline expectancy while SA only produced clinically important pain reduction for those with higher expectancy. Expecting a positive outcome (expectancy) at the beginning of the trial was associated with the response to SA. In contrast, patients who responded to EA had increased expectancy over the course of their acupuncture treatment as compared with nonresponders, suggesting that positive responses during the process of EA increased the expectations of positive outcomes. Our findings imply that distinct mechanisms underlie the apparently similar clinical effect of EA and SA. These findings have important implications for acupuncture and pain research as well as for clinical practice.
It is important to put our findings in the context of existing literature. A recent systematic review evaluating the association of expectancy with acupuncture response revealed mixed results, with five of the nine identified studies revealing a significant association between expectancy and acupuncture response. Heterogeneity of study designs (eg, one treatment vs a course of treatment), interventions (eg, manual acupuncture [MA], EA, expectation manipulations), and populations (eg, healthy volunteer, patients with clinical pain such as headache, low back pain) and available data prevented a meta-analysis (8). Of particular relevance to our study, Linde et al. (9) found baseline expectancy predicted pain outcomes in MA, and the effect was even stronger for manual versus SA. On the other hand, in a trial of patients with low back pain, Sherman et al. (20) did not find that baseline expectancy predicted pain outcomes. Surprisingly, both studies found that expectancy measured after multiple treatments were more predictive of treatment outcomes than baseline, which was consistent with the EA group in our trial indicating a conditioning response. Unfortunately, the definition of expectancy used in these studies was different, which makes it difficult to compare results. Future research using a consistent and validated expectancy instrument in a longitudinal manner will help determine to what extent expectancy influences outcomes for specific conditions or populations by EA, MA, and SA.
Our findings of divergent patterns of expectancy and response suggest that different mechanisms underlying the clinical effect may exist for acupuncture and SA. These are consistent with emerging translational research in humans. In an functional magnetic resonance imaging study, Kong et al. applied an expectancy manipulation model to healthy volunteers receiving EA or SA for experimentally induced pain. The study found real acupuncture elicited a greater response in brain regions involved in pain processing than SA (21). Interestingly, they found that the analgesic effect of EA could be augmented by expectation. This contrasts our findings of a similar clinical response in the EA group regardless of baseline expectancy. This raises the possibility that innate expectancy (which individuals bring with them to treatment) may differ from manipulated expectancy. In a study using healthy volunteers in an experimental setting with quantitative sensory testing, Zheng et al. (22) found that EA produced a significant decrease in the single pain threshold and temporal summation threshold as compared with SA both immediately and 24 hours posttreatment. In a study using positron emission tomography with (11) C-carfentanil among patients with fibromyalgia, Harris et al. (23) found that real acupuncture increased mu-opioid receptor binding potentials in specific brain regions (cingulate cortex, caudate nuclei, and the amygdala) that are involved in pain processing, while SA may have caused a small decrease. These findings suggest divergent mechanisms underlying acupuncture and SA. Appropriate incorporation of these translational tools in cancer patients may help uncover the mechanisms underlying the clinical effect of acupuncture for pain and symptom management.
The strong association seen between expectancy and the response to SA emphasizes the importance of measuring expectancy in acupuncture as well as other clinical trials involving patient-reported outcomes. Research has previously shown that higher expectancy is associated with a greater willingness to participate in acupuncture clinical trials (12) and to use acupuncture services (24). We would expect the average AES scores seen in an acupuncture clinical trial to be higher than the general population, and this was seen in our trial (mean AES = 14.5 vs 9.8 in the validation cohort) (12). As demonstrated by Figure 3, as Baseline expectancy increases it is increasingly challenging to demonstrate the specific benefit of EA for pain management. This methodological issue is important to all trials (eg, drugs, natural products) that involve placebo controls. As more comparative effectiveness research between two or more active interventions is performed, a careful measurement of pretreatment expectancy may also help to identify its contribution to outcomes.
Our findings also have important implications for clinical practice. Clinical trials often enroll highly motivated individuals and thereby may produce clinical benefit beyond regular patients in practice. The mean expectancy score in breast cancer survivors is 9.8 (12) which is substantially lower than 14.5 in our trial. As illustrated by Figure 3, at an expectancy score of 9.8, EA may be substantially more effective than SA for everyday patients in a clinical practice setting. Our findings, if confirmed by future research, can substantially inform the efficacy versus effectiveness debate in acupuncture and in other clinical interventions.
The impressive response seen in SA among patients with high expectancy raises the provocative question of whether such patients benefit from the gentle stimulation of needles without seeking “de qi” sensation or electrostimulation. Indeed, traditional acupuncture employs many different needling manipulation styles. For example, in Japanese acupuncture or “mao ci” technique in Chinese acupuncture, the needles are inserted superficially with little to no stimulation. Our study provides the initial evidence that individually tailored delivery of acupuncture practice based on pretreatment expectancy may yield better clinical outcomes, which requires further research.
Our study has a number of important limitations. First, our sample size is relatively small. Our novel discovery should be interpreted with caution and validated in larger clinical trials. Also, 6% of our patients who did not have Week 8 endpoints thus could not be included in main analyses. In addition, our patients all had breast cancer and joint pain, which could limit generalizability to other symptoms and populations. Lastly, our active treatment group used EA; the applicability of our findings to MA remains unknown.
Despite these limitations, our study is the first to evaluate the relationship between expectancy and treatment outcomes over the course of an 8-week acupuncture trial using a validated expectancy instrument. Our findings suggest that distinct mechanisms exist between SA and EA and challenge the notion that acupuncture is “all placebo.” In the EA group, expectancy increased as a result of response rather than the other way. Secondly, the differential pain reduction in SA and EA groups based on pretreatment expectancy suggests the possibility of personalizing acupuncture delivery (EA vs MA with light stimulation of needles) for breast cancer survivors to improve pain management outcomes. These intriguing findings require larger and longer term trials to confirm.
Implications of Acupuncture Research for Cancer Survivorship
Acupuncture holds tremendous potential to improve symptoms (eg, pain, fatigue, hot flashes) in cancer survivors (2). Despite such promise, larger and more definitive trials with methodological rigor are required to establish both the short and long-term efficacy and effectiveness of acupuncture (2). Randomized trials should measure expectancy using a validated instrument at the beginning and longitudinally to understand the role of expectancy on outcomes (12). Research using translational tools such as quantitative sensory testing (22), functional brain imaging (21,23), and other correlative biomarkers (eg, inflammation, telomere length/telomerase activity) will increase our understanding of the mechanisms underlying both acupuncture effect as well as the symptom of interest (eg, pain). Further, research focused on tailoring treatment based on expectancy may help to inform the personalized practice of acupuncture and improve the overall experience of cancer survivorship for patients. Lastly, the longer term persistence of the improvement in pain related to SA and EA needs to be studied.
Conclusion
Expectations of positive outcomes may underlie the response to SA, but not to EA. Patients with low expectations for a positive outcome do better with EA than SA.
Funding
National Institutes of Health/National Center for Complementary and Alternative Medicine (NCCAM) (R21 AT004695). Dr JJM is a recipient of the NCCAM K23 AT004112 award. The funding agencies had no role in the design or conduct of the study.
Clinical Trial Registration: NCT01013337.
References
- 1. Mao JJ, Kapur R. Acupuncture in primary care. Prim Care. 2010;37(1):105–117. [DOI] [PMC free article] [PubMed] [Google Scholar]
- 2. Garcia MK, McQuade J, Haddad R, et al. Systematic review of acupuncture in cancer care: a synthesis of the evidence. J Clin Oncol. 2013;31(7):952–960. [DOI] [PMC free article] [PubMed] [Google Scholar]
- 3. Vickers AJ, Cronin AM, Maschino AC, et al. ; Acupuncture Trialists’ Collaboration. Acupuncture for chronic pain: individual patient data meta-analysis. Arch Intern Med. 2012;172(19):1444–1453. [DOI] [PMC free article] [PubMed] [Google Scholar]
- 4. Meissner K, Fässler M, Rücker G, et al. Differential effectiveness of placebo treatments: a systematic review of migraine prophylaxis. JAMA Intern Med. 2013;173(21):1941–1951. [DOI] [PubMed] [Google Scholar]
- 5. Lund I, Näslund J, Lundeberg T. Minimal acupuncture is not a valid placebo control in randomised controlled trials of acupuncture: a physiologist’s perspective. Chin Med. 2009;4:1. [DOI] [PMC free article] [PubMed] [Google Scholar]
- 6. Kirsch I. Changing Expectations: A Key to Effective Psychotherapy. Pacific Grove, CA: Brooks/Cole Publishing Company; 1990. [Google Scholar]
- 7. Kirsch I. Response expectancy as a determinant of experience and behavior. Am Psychol. 1985;40(11):1189. [Google Scholar]
- 8. Colagiuri B, Smith CA. A systematic review of the effect of expectancy on treatment responses to acupuncture. Evid Based Complement Alternat Med. 2012;2012:857804. [DOI] [PMC free article] [PubMed] [Google Scholar]
- 9. Linde K, Witt CM, Streng A, et al. The impact of patient expectations on outcomes in four randomized controlled trials of acupuncture in patients with chronic pain. Pain. 2007;128(3):264–271. [DOI] [PubMed] [Google Scholar]
- 10. Vase L, Baram S, Takakura N, et al. Specifying the nonspecific components of acupuncture analgesia. Pain. 2013;154(9):1659–1667. [DOI] [PMC free article] [PubMed] [Google Scholar]
- 11. Mao JJ, Armstrong K, Farrar JT, Bowman MA. Acupuncture expectancy scale: development and preliminary validation in China. Explore (NY). 2007;3(4):372–377. [DOI] [PMC free article] [PubMed] [Google Scholar]
- 12. Mao JJ, Xie SX, Bowman MA. Uncovering the expectancy effect: the validation of the acupuncture expectancy scale. Altern Ther Health Med. 2010;16(6):22–27. [PMC free article] [PubMed] [Google Scholar]
- 13. Mao JJ, Xie SX, Farrar JT, et al. A randomised trial of electro-acupuncture for arthralgia related to aromatase inhibitor use. Eur J Cancer. 2014;50(2):267–276. [DOI] [PMC free article] [PubMed] [Google Scholar]
- 14. Mao JJ, Bruner DW, Stricker C, et al. Feasibility trial of electroacupuncture for aromatase inhibitor–related arthralgia in breast cancer survivors. Integr Cancer Ther. 2009;8(2):123–129. [DOI] [PMC free article] [PubMed] [Google Scholar]
- 15. Sloan JA, Aaronson N, Cappelleri JC, Fairclough DL, Varricchio C; Clinical Significance Consensus Meeting Group. Assessing the clinical significance of single items relative to summated scores. Mayo Clin Proc. 2002;77(5):479–487. [PubMed] [Google Scholar]
- 16. Farrar JT, Young JP, Jr, LaMoreaux L, Werth JL, Poole RM. Clinical importance of changes in chronic pain intensity measured on an 11-point numerical pain rating scale. Pain. 2001;94(2):149–158. [DOI] [PubMed] [Google Scholar]
- 17. Cleeland CS, Ryan KM. Pain assessment: global use of the Brief Pain Inventory. Ann Acad Med Singapore. 1994;23(2):129–138. [PubMed] [Google Scholar]
- 18. Laird NM, Ware JH. Random-effects models for longitudinal data. Biometrics. 1982;38(4):963–974. [PubMed] [Google Scholar]
- 19. Farrar JT, Portenoy RK, Berlin JA, Kinman JL, Strom BL. Defining the clinically important difference in pain outcome measures. Pain. 2000;88(3):287–294. [DOI] [PubMed] [Google Scholar]
- 20. Sherman KJ, Cherkin DC, Ichikawa L, et al. Treatment expectations and preferences as predictors of outcome of acupuncture for chronic back pain. Spine (Phila Pa 1976). 2010;35(15):1471–1477. [DOI] [PMC free article] [PubMed] [Google Scholar]
- 21. Kong J, Kaptchuk TJ, Polich G, et al. Expectancy and treatment interactions: a dissociation between acupuncture analgesia and expectancy evoked placebo analgesia. Neuroimage. 2009;45(3):940–949. [DOI] [PMC free article] [PubMed] [Google Scholar]
- 22. Zheng Z, Feng SJ, Costa Cd, Li CG, Lu D, Xue CC. Acupuncture analgesia for temporal summation of experimental pain: a randomised controlled study. Eur J Pain. 2010;14(7):725–731. [DOI] [PubMed] [Google Scholar]
- 23. Harris RE, Zubieta JK, Scott DJ, Napadow V, Gracely RH, Clauw DJ. Traditional Chinese acupuncture and placebo (sham) acupuncture are differentiated by their effects on mu-opioid receptors (MORs). Neuroimage. 2009;47(3):1077–1085. [DOI] [PMC free article] [PubMed] [Google Scholar]
- 24. Kim YJ, Lee IS, Kim HS, et al. Validation of the Korean version of the Acupuncture Expectancy Scale. Acupunct Med. 2014;32(1):51–55. [DOI] [PubMed] [Google Scholar]