

Abstract
Many children have significant mathematical learning disabilities (MLD, or dyscalculia) despite adequate schooling. We hypothesize that MLD partly results from a deficiency in the Approximate Number System (ANS) that supports nonverbal numerical representations across species and throughout development. Here we show that ninth grade students with MLD have significantly poorer ANS precision than students in all other mathematics achievement groups (low-, typically-, and high-achieving), as measured by psychophysical assessments of ANS acuity (w) and of the mappings between ANS representations and number words (cv). This relationship persists even when controlling for domain-general abilities. Furthermore, this ANS precision does not differentiate low- from typically-achieving students, suggesting an ANS deficit that is specific to MLD.
Keywords: mathematical learning disability, dyscalculia, approximate number system
Approximately 6 to 14% of school age children have persistent difficulty with mathematics despite adequate learning opportunities (Barbaresi, Katusic, Collagin, Weaver, & Jacobsen, 2005) and age appropriate achievement in other domains. These learning difficulties have lifelong consequences on outcomes as varied as job attainment and success (Parsons & Bynner, 1997; Rivera-Batiz, 1992), financial decision-making, health care risk assessment (Hibbard, Peters, Dixon, & Tusler, 2007), and social activities (McCloskey, 2007). Heightened interest in the nature and origins of these learning difficulties has led to the birth of a “new discipline of mathematical disabilities” (Siegler, 2007, p. xviii) which has focused on defining mathematical learning disability (MLD), identifying its underlying core deficits, and differentiating children with MLD from their mathematically successful counterparts.
Two approaches dominate efforts to characterize MLD, and both have received empirical support (note that, in this paper, we consider MLD and dyscalculia to be synonymous). The domain-general approach conceives of MLD as resulting from dysfunction in supporting cognitive systems, such as phonological skills, working memory, long term memory, or visuospatial processing (Geary, 1993). For example, children with MLD have smaller counting spans (Geary, Hoard, Byrd-Craven, & DeSoto, 2004) and are less accurate and less efficient on non-numerical working memory tasks (Murphy, Mazzocco, Hanich, & Early, 2007) relative to their peers. The domain-specific approach posits that MLD results from deficits in numerical processing, or from a deficient “number sense” (e.g., Dehaene, Piazza, Pinel, & Cohen, 2003).
A possible locus for a domain-specific deficit in MLD is the Approximate Number System (ANS), because it appears early in development, is universally shared among humans, and emerges without explicit instruction (see Feigenson, Dehaene, & Spelke, 2004 for a review). The ANS is a mental system of approximate number representations that is activated and used during both nonsymbolic approximations (e.g., judging which array of items is more numerous, irrespective of item size) and symbolic number tasks (e.g., judging whether a series of Arabic numerals refers to increasing or decreasing quantities). These representations are active anytime someone thinks about or uses numbers, including when solving mathematics problems but also during everyday decision-making such as selecting a grocery store checkout line based on which line has the fewest people (Feigenson et al., 2004). When an array of items (e.g., seven dots) appears too quickly to permit serial counting, a specific ANS representation (e.g., for “approximately seven”) is activated. Figure 1 illustrates that approximate number representations can be depicted as series of Gaussian curves organized on a mental number line. The standard deviation of each number's representation (i.e., the width of each curve) reflects the amount of “noise,” or error, linked to that number's representation. The standard deviations of these curves increase linearly as the quantities being presented increase. Thus, the degree of uncertainty in an observer's numerical approximation increases with the quantity being represented. Moreover, there are individual differences in the standard deviation of observers' number representations. Larger standard deviations indicate noisier representations, which lead to poorer performance in tasks that rely on the ANS (Halberda, Mazzocco & Feigenson, 2008).
Figure 1.
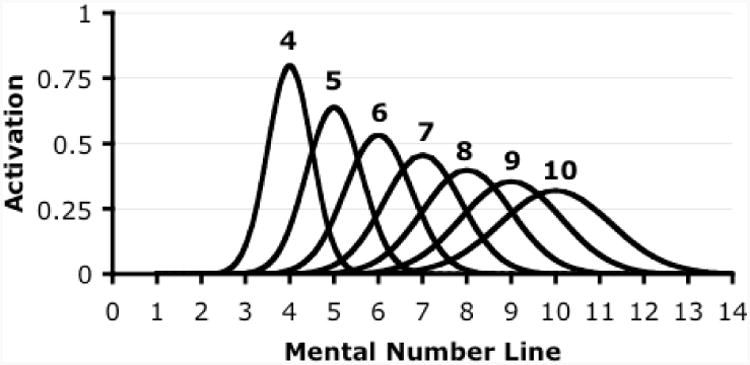
A depiction of number representations in the ANS.
The amount of noise in an individual's ANS is indexed as a Weber fraction (w). This index can be derived by asking an individual to evaluate which of two quickly flashed arrays of objects is more numerous (Halberda et al., 2008). As the ratio between two arrays approaches one (in which case the two numerosities would be identical), individuals make more errors judging which of the two is more numerous. The rate of this increase in errors is a function of the amount of noise in the ANS representations. Mathematical modeling of performance on this task reveals a person's Weber fraction, or w, with higher w's corresponding to a noisier ANS.
The ANS is also activated during symbolic number tasks (Ansari & Dhital, 2006). For instance, when rapidly shown an array of seven dots, the curve for “seven” in Figure 1 would be activated, and an individual who has acquired number words may report having seen “around 7 or 8 dots” (Dehaene, Bossini, & Giraux, 1993). The difference between presented and reported quantities can stem from error in either an individual's ANS representation for the quantity (e.g., seven), or the accuracy with which that individual's ANS representation is mapped to number words. To estimate an individual's degree of mapping error, a coefficient of variation (cv) can be estimated by simply asking the person to quantify rapidly appearing arrays. More errors lead to a higher cv. Hence, error in the approximate number representations themselves can be measured by tasks involving nonverbal judgments (i.e., judging which array of objects is more numerous), and error in the mapping between approximate number representations and number words can be measured by tasks involving symbolic judgments (i.e., saying that an array has “about 7” items).
In this study we asked whether the associations between mathematics achievement and w or cv distinguish children with MLD from their peers. We propose that a poor ANS contributes, at least in part, to MLD. Alternatively, MLD may arise primarily from reported domain-general impairments, such as in working memory (Geary, Hoard, Byrd-Craven, Nugent, & Numtee, 2007), limiting the degree to which the ANS underlies MLD. Moreover, the previously reported correlation between w and mathematics achievement (Halberda et al., 2008) may be predominantly driven by individual differences among children with average to superior mathematics achievement, in which case w and cv may not differentiate children with vs. without MLD. Thus, in the present study we examined w and cv in children with MLD relative to children with typical achievement (TA) or high achievement (HA) in mathematics.
The second question motivating this research was whether associations between MLD and w or cv discriminate subgroups of children with mathematical difficulties. Researchers currently rely on diverse criteria to classify participants as having MLD. A commonly used criterion is mathematics achievement test cut-off scores at or above the 25th percentile (e.g., Geary et al., 2004; Siegel & Ryan, 1989; Wilson & Swanson, 2001) which we believe captures children whose learning difficulties represent a broad etiological basis. Other researchers adopt a more stringent cut-off (e.g., ≤ 10th percentile, Mazzocco & Thompson, 2005; Ostad, 1997) as a proxy for mathematical difficulties associated with neurobiologically-mediated cognitive deficits, which we propose are linked to the ANS. Initial comparisons of groups based on these 10th versus 11th to 25th percentiles (Mazzocco & Myers, 2003), which revealed important qualitative differences in cognitive profiles, have since been replicated and expanded (Geary et al., 2007; Murphy et al., 2007). Thus, in the present study, we separately examined these two mutually exclusive groups of children with mathematical difficulties, comparing those with MLD (achievement scores ≤ 10th percentile) to children with “low mathematics achievement” (LA, achievement scores in the 11th - 25th percentile). Moreover, we compared each of these groups to two groups of mathematically successful peers (children with TA or HA). Our predictions were that markedly poor ANS (high w's and cv's) would underlie MLD (but would not underlie all mathematical difficulties), and would thus differentiate children with MLD from their peers, including peers with low mathematics achievement. We examined these differences at adolescence, an age at which we previously have shown large individual differences in w (Halberda et al., 2008).
Finally, we explored how ANS-acuity might affect symbolic mathematics by investigating differences between w, which requires no verbal response, and cv, which requires mapping between number words and the ANS. We predicted that cv would correlate more strongly with symbolic mathematics tasks than would w, suggesting that the ANS and the symbolic number system may interact via number word mappings (e.g., Ansari & Dhital, 2006).
Method
Participants
Participants were drawn from a prospective longitudinal study of mathematics achievement (Mazzocco & Myers, 2003). The initial sample was recruited from the Baltimore County Public School district, excluding those schools whose high rates of student mobility or eligibility for free and reduced price meal programs implicated high poverty conditions. During the first year of the longitudinal study, all kindergartners attending one of seven participating schools were invited to participate. A total of 57% enrolled (n=249; 120 boys), and 161 participated through Grade 8.
At Grade 9, when participants were 14 to 15 years old, we evaluated a subset of this group representative of a wide range of mathematics achievement levels, to obtain ANS behavioral data for the present study. Four children were excluded for inconsistent performance on the w (n=3) or cv (n=1) measures. For these, either the model implementing Levenberg-Marquardt least squares fit failed to settle on a value for w within the allotted 50 iterations, or the standard deviation of responses on the cv assessment was > 3 SDs above the mean. Five additional children were excluded for having inconsistent mathematics achievement scores over time. Mathematics achievement scores were considered consistent if a child's scores fell within one of the ranges specified below during at least half of the years during which such scores were obtained, and fell within the 95th percentile confidence interval for that range during all years. Ten children (five boys) met criteria for MLD because their mathematics achievement scores were in the bottom 10th percentile; nine children (five boys) met criteria for low mathematics achievement (LA) by scoring in the 11th to 25th percentile; 37 children (20 boys) with typical mathematics achievement (TA) scored in the 25th to 95th percentiles, and 15 children (eight boys) with high achievement (HA) scored > 95th percentile. The 95th percentile was selected because it is a commonly used criterion for school placement in gifted and talented programs, and has been used in earlier studies of high achieving students (e.g., Hoard, Geary, Byrd-Craven, & Nugent, 2008). The final sample of 71 children (Mage = 14 years, 10 months; age range: 14 years 2 months to 15 years 11 months) included European American (n=62), Black (n=6), Hispanic (n=2) and Asian (n=1) children.
Procedure
During all years of the longitudinal study, participants were tested individually during a one- to three-session assessment. The administered tests varied across years, but always included a combination of mathematics and domain-general assessments. Here we describe the assessments that were included in the present study and the rationale for their inclusion.
Measures
Assessing the acuity of the Approximate Number System
Two ANS-related tests were administered during only the tenth year of the study. First, Weber fraction (w) was measured with a Number Discrimination task similar to tasks used with animals and pre-verbal infants (Feigenson et al., 2004). Participants saw spatially intermixed arrays of blue and yellow dots on a computer screen for 200 ms, too quickly for verbal counting to occur (Kaufman, Lord, Reese, & Volkmann, 1949), and indicated which array was more numerous by pressing a color-coded key (Figure 2). Both the blue and the yellow arrays contained 5 to 16 dots. The ratio between the arrays varied randomly among four ratio bins in which the ratio of the smaller to the larger set was 1:2, 3:4, 5:6 or 7:8 across 80 test trials. We expected percent correct to decrease as ratio became more difficult. Each participant's w was determined by fitting a psychophysical model of the ANS to their performance (smaller w values indicate lower standard deviations of the underlying ANS Gaussian number representations (Figure 1), and thus better performance; Halberda et al., 2008). A random half of the trials involved displays which equated the total blue and yellow surface area, and in all trials individual dot sizes varied in order to disrupt the stability of area or dot-size as a cue to number (for further details on calculating w and on controls for non-numerical dimensions, see Halberda et al., 2008; and Halberda & Feigenson, 2008). Test – retest reliability for this measure, assessed by Cronbach's alpha (1951), is approximately 0.65 (Halberda, 2010).
Figure 2.
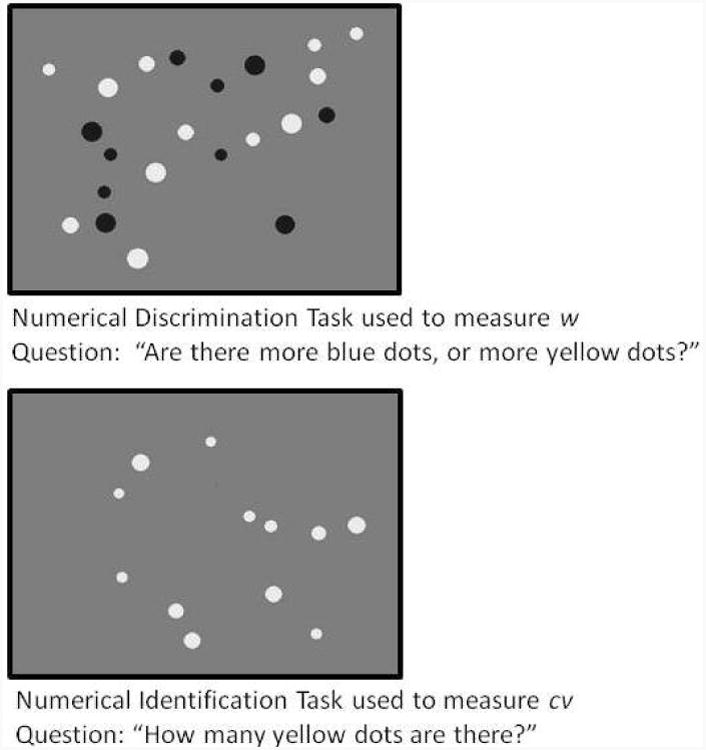
Sample stimuli from the Numerical Discrimination and Numerical Identification tasks, and the primary questions posed to participants during each task. Blue dots appear in black, and yellow dots appear in gray.
We used a second ANS-related Number Identification task to measure the precision of the mapping between the ANS and the verbal number system (cv). Participants saw arrays of 9, 12 or 15 yellow dots flashed for 200 ms, too rapidly to permit counting (Kaufman et al., 1949), then verbally estimated how many dots were shown (Figure 2). No feedback was given, and because of the inherent noisiness of the ANS representations, participants gave verbal estimates ranging from “six” to “thirty” dots. This task required participants to access both their nonverbal ANS number representations (to mentally estimate the number of dots present), and the mapping of these ANS representations to symbolic number words (to verbally report that there were, for example, “ten” dots shown) (Baroody & Gatzke, 1991; Halberda et al., 2006; Whalen, Gallistel, & Gelman, 1999). We measured the variability in participants' verbal number judgments across 90 test trials. Test-retest reliability for this measure was r = .781, p < .001.
These two tasks were administered in succession, with the Number Identification task always presented first, at both the beginning and end of one 75-minute testing session (described subsequently). This allowed us to obtain enough data for accurate estimates of w and cv for each participant without fatiguing participants with a single, long presentation. In previous work in our lab we have found no order effects either from retesting on the same task or from altering the order of Number Identification and Number Discrimination. Performance was averaged across the two administrations, and a single score was derived per test per participant.
Assessing mathematics achievement
Two standardized mathematics tests, the Test of Early Mathematics Ability – 2nd edition (TEMA-2; Ginsburg & Baroody, 1990), and the Woodcock-Johnson Revised Calculation subtest (WJR-Calc; Woodcock & Johnson, 1990) were administered during the first seven years of the study. Typical items from the TEMA-2, administered from Grades K to 3, measure formal skills such as counting and reading and writing numerals, and informal skills such as cardinality. Test-retest reliability for the TEMA-2 is .94 (Ginsburg & Baroody, 1990). The WJ-R-Calc, administered from Grades 1 to 6 (except Grade 2, owing to time constraints), involved written arithmetic calculations of increasing difficulty. Internal consistency reliability of the WJ-R is .89 (Woodcock & Mather, 1990).
For both measures, variables of interest were the age-referenced normative score, per test, based on Mean = 100, SD = 15. In the present study, these standardized scores were used to determine level of the grouping variable mathematics achievement level for analyses of variance, or as outcome scores in multiple regression analyses, as reported subsequently.
Additional mathematics outcome measures
During the last four years of the longitudinal study, we administered investigator-designed measures of school mathematics designed to test hypotheses concerning mental computation (Mazzocco, Devlin, & McKenney, 2008), numerical decomposition (Mazzocco & Hanich, 2010), and rational number sense (Mazzocco & Devlin, 2008) among children with MLD.
The Fast Math Task
The Fast Math Task (FMT), administered at Grade 8 only, required children to write as many exact solutions to one- or two-digit arithmetic problems as possible within 60 seconds per page. Eighteen problems appeared on each of eight test pages. Each page included problems classified as easy (e.g., 6 + 6; 5 × 4) or hard (e.g., 18 + 21; 13 × 7), based on the likelihood that a solution would be obtained primarily by retrieval vs. mental calculation, respectively. Four sets of 18 problems (easy or hard addition; and easy or hard multiplication) were presented, in each of two fixed orders. Test-retest reliabilities range from .62 to .79 (reported by Mazzocco et al., 2008). In earlier work, we showed that performance on the easy FMT problems differentiates children with MLD from their peers, whereas performance on hard problems differentiates children with LA from their TA peers. Therefore, we included Grade 8 scores from both the easy and hard problems in the present study.
Composing and Decomposing Numbers Task
During Grades 8 and 9 we administered the Composing and Decomposing Numbers task (CDN; Mazzocco & Hanich, 2010), a timed test of symbolic numerical processing that involved determining which number pairs summed to a target value (i.e., 19). On each of three stimulus pages, 20 of the 49 pairs presented summed to 19, while the remaining pairs summed to either 19 ± 3 or 4 (close foil condition), or 19 ± 10 (distant foil condition). Test-retest reliability on the CDN test is, r = .74. In earlier work we showed that children with MLD are slower and less accurate than their peers on this task, particularly on the close foil condition (Mazzocco & Hanich, 2010). Therefore, we included accuracy rates on the CDN close-foil condition as outcome scores in the present study.
Ranking Proportions Task
Finally, we administered a test of symbolic “rational number sense,” the Ranking Proportions Task (RPT), which involved rank ordering ten values per trial, for each of four test trials. Values included numerical decimals (e.g., 0.07, 0.50), fractions depicted by pie charts, numerical fractions (e.g., ¼), or a combination of numerical decimals and fractions. Test-retest reliability for the RPT rank ordering scores ranges from .68 to .85. (Mazzocco & Devlin, 2008). Our earlier work showed that, relative to typically achieving peers, children with MLD were significantly more likely to fail at least three of the four RPT trials each year from Grades 6 to 8. Consistent with our previous work, in the present study we used a pass/fail dichotomous score as an outcome measure at Grade 9, which reflected whether children correctly rank ordered all ten values on each of at least three of the four test trials.
Assessing non-numerical correlates of mathematics achievement
Although the present study focused primarily on ANS skills, we also probed whether group differences on our ANS measures resulted from differences in more general cognitive skills known to be associated with mathematics achievement, and whether the ANS contributed to variability in mathematics achievement above and beyond the variability accounted for by these non-numerical correlates. We included covariates available from our longitudinal study, focusing on measures that we and others have found correlate significantly with mathematics achievement. In view of the increased prevalence of dyslexia in children with MLD (Barbaresi et al., 2005), we included a measure of nonword decoding as a covariate, because decoding deficits are a core underpinning of dyslexia (National Reading Panel, 2000). Additional covariates included measures of lexical retrieval speed (Willburger, Fussenegger, Moll, Wood, & Landerl, 2009), visual perceptual skills (Mazzocco, Bhatia, & Lesniak-Karpiak, 2006), memory, working memory, and spatial memory (e.g., Bull & Scerif, 2001). Each of these measures was administered during one or more years of the study, but only the most recently obtained data per measure was included in the present study, in order to minimize the gap in time between the administration of these assessments and our ANS-assessments, and to limit the number of covariates included in our statistical models.
Nonword reading
We administered the Woodcock Johnson – Revised Word Attack to assess children's nonword decoding. Grade 4 Word Attack was a covariate in the present study. Internal consistency reliability of the WJ-R is .87 for the age groups relevant to this study (Woodcock & Mather, 1990). The variable of interest was the age-referenced standard scores.
Rapid Automatized Naming
Rapid Automatized Naming (RAN) (Denckla and Rudel, 1977), a test of lexical retrieval, was administered each year of the study. RAN performance at Grade 9 was a covariate in the present study. During RAN subtests, children rapidly named either individual digits or the color of a series of solid squares. RAN subtests served as control tasks for the present study because each involves behavioral responses similar to the rapid naming of colors and numbers elicited during our Number Discrimination and Number Identification tasks. An untimed warm-up trial was used to establish that children had verbal labels for each of five colored or numerical stimuli. During the timed test trials that followed, children verbally identified 50 colors (RAN-colors) or numbers (RAN-Numbers), arranged in a 5 × 10 array on a sheet of white paper, as quickly as possible. The experimenter recorded overall response time (RT) with a stopwatch, with shorter RTs indicating better (faster) performance.
Visual Closure
The Developmental Test of Visual Perception Second Edition (DTVP-2; Hammill, Pearnson, & Voress, 1993) included subtests used to assess visual perception. Our earlier work demonstrated that Visual Closure was the subtest most strongly correlated with mathematics achievement scores among typically achieving students and children at risk for poor mathematics outcomes (Mazzocco et al., 2006). During Visual Closure, children identified which of several degraded shapes matched a visually intact target shape. The task is normed for children up to age 10 years and its internal consistency is .85. Grade 3 standardized age-reference scores served as covariates in the present study.
Memory for Digits
Memory for Digits, a subtest from the Stanford Binet Intelligence Test – Fourth Edition, was used to measure verbal short-term memory for numbers. Children were asked to repeat progressively longer strings of verbally presented digits first verbatim (Forward Span), and then in reverse (Backward Span). Span length, the longest set of digits repeated correctly on two consecutive trials, was recorded separately for forward and backward tasks. An age-referenced normative score was derived from the forward and backwards spans combined, and was based on a mean of 50 (SD = 8). Memory for Digits performance at Grade 9 was included in the present study. Mean internal consistency at age 14 – 15 years is .83.
The Contingency Naming Test
We used the Contingency Naming Test (CNT) (Anderson, Anderson, Northam, & Taylor, 2000) to assess cognitive flexibility and performance efficiency, under moderate working memory demands. The CNT required naming the color or shape of stimuli according to rules that became progressively more challenging. The stimuli were approximately 1-inch shapes, outlined in black with solid-color interiors that contained a smaller, inner shape also outlined in black (e.g., a solid blue 1” square in which a ¼” circle appeared). Rules presented during the warm up trials do not tap executive control because they require merely naming the color or outer shape. Two subsequently presented rules require cognitive switching between naming the color or shape of the stimuli, depending on one attribute (i.e., whether the inner and outer shapes of the stimulus match) or two attributes (i.e., whether these shapes match and whether a black arrow appears over the stimulus). Children first completed an untimed practice trial during which they named a row of nine stimuli on an 8” × 11” sheet of white paper. Once children demonstrated mastery of the naming rule, they saw three rows of 9 stimuli on a 8” × 11” sheet of white paper, and named the stimuli as quickly as possible while the experimenter recorded reaction time (RT). The variable of interest was performance efficiency, a positive number reflecting the speed-accuracy trade-off obtained by calculating [(1/RT)/√(errors + 1)] × 100. Higher scores reflect better (more efficient) performance. Scores increase with age, but are not age-adjusted. From age 5 to 11 years, scores across trials and age groups range from approximately .20 to 2.0 (Mazzocco & Kover, 2007).
The CNT was administered at alternating years, up to Grade 8. In our earlier work we found that all eighth graders in the longitudinal study successfully completed the two-attribute task, and that performance ceilings were evident on the one-attribute task at this grade level. Therefore, only the two-attribute task at Grade 8 was included in the present study. The standardization report of the CNT does not include reliability data (Anderson et al., 2000), but we found a significant test-retest correlation for the two-attribute efficiency scores collected two years apart, Rho = .50, p < .001 (Mazzocco & Kover, 2007).
Memory Puzzle Test
We used the Memory Puzzle Test (Mazzocco et al., 2006) to measure working memory for spatial locations following repeated exposure to a fixed visual array. During the Figure-Ground subtest, participants identified familiar shapes that appeared within designs consisting of overlapping shapes. These designs appeared on the top half of an 8 × 11 inch piece of paper, directly above a target array. The array was comprised of ten unique shapes, each of which appeared in one of ten cells within a 2 × 5 grid. All 11 pages of the Figure Ground subtest contained identical depictions of this array. The location of the ten unique shapes remained constant across all 11 presentations occurring during the subtest, and all pages were administered to each participant. Immediately after all 11 pages were viewed, the participants were shown a blank 2 × 5 grid and were given laminated cut-outs of the ten unique shapes. Participants were asked to reproduce the correct location of the shapes. A maximum “correct location” score of 10 points was assigned. The Memory Puzzle Test was administered only twice during the longitudinal study, and scores obtained at Grade 3 were included in the present study. The Spearman Rho correlation across these two administrations was .34, p<.001.
Results
Preliminary Analyses
Preliminary analyses included ANOVAs or t-tests for continuous dependent variables, or chi squares for frequency counts. We first verified that children in the present study did not differ from the remaining members of the overall longitudinal study cohort (Mazzocco & Myers, 2003) on gender distribution, relative frequencies of mathematics achievement levels, handedness, or performance on cognitive measures from prior years included in the present study, all ps = .063 to .903. We also ruled out gender differences in our two primary dependent variables of interest, Weber fraction (w) and coefficient of variation (cv), ps > .47; and determined that boys and girls were equally represented across each level of our independent variable, Mathematics Achievement Group, p = .995. Therefore, gender was excluded from subsequent analyses. Finally, we verified that, consistent with earlier studies (Halberda et al., 2006), the mean and standard deviation of participants' estimates in the Number Identification (cv) task increased linearly as a function of the number of dots presented, F(2, 66) = 282.98, p < .001, η2 = .896; and F(2, 66) = 44.80, p < .001, η2 = .576; respectively. There was no Group × Quantity interaction for either variable, ps > .53. This performance finding reflects engagement of the ANS among all participant groups.
Primary analyses
Mathematics achievement level group differences in ANS performance
We carried out two sets of analyses, both designed to evaluate whether w or cv differed across mathematics achievement groups. The first set of analyses included, as covariates, all four domain-general scores obtained during the Grade 9 assessment (during which the ANS data were also collected). These concurrent covariates were response times for RAN-Color and RAN-Number, and Digit Span scores for Forward and Backward subtests. The second set of analyses included additional covariates, drawn from multiple years of the study, as described subsequently.
Performance at Grade 9
We carried out a univariate Analyses of Covariance (ANCOVA) with w as the dependent, mathematics achievement group as the independent, and RAN-Colors, RAN-Numbers, Digits Forward, and Digits Backward as covariates. As predicted, there was a main effect of mathematics achievement group, F(3, 63) = 6.54, p < .001, η2 = .238. No covariates were significant, ps > .28. Levene's test of equality of error variances showed no significant differences in variance across groups, p = .76, so Least significant difference (LSD) post hoc tests were conducted. Post hocs showed that children with MLD had significantly higher w scores (i.e., poorer ANS acuity) than did children in the Low Achieving (LA), Typically Achieving (TA), and High Achieving (HA) groups, ps < .005 (Figure 3), Cohen's d effect sizes = 1.30, 1.29, and 1.84, respectively (mean differences for marginal group means appear in Table 1). No other significant pairwise comparisons emerged, ps > .12. This pattern of findings held when the covariates were removed from the model.
Figure 3.
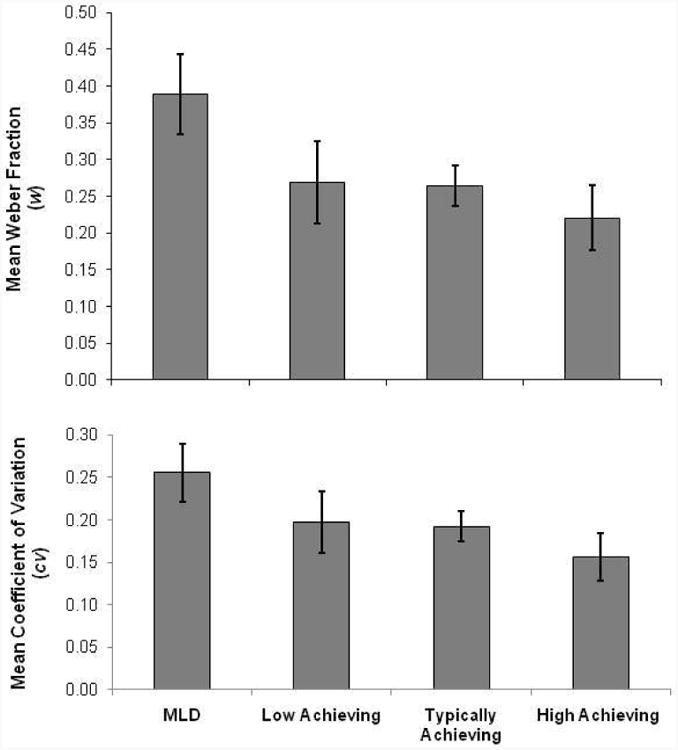
Mean ANS-acuity (w) and mean mapping-precision (cv) scores derived from the Number Discrimination and Identification Tasks, respectively, for each of four levels of Mathematics Achievement Group. Errors bars represent 95% confidence intervals for each group mean. For both w and cv, a lower score represents better performance.
Table 1. Results of Statistically Significant Post Hoc Pairwise Comparisons Following ANCOVAs.
| Covariates included in Analysis | Dependent variable | Mathematics Achievement Group | Mean Difference | Standard Error | p value | 95% Confidence Intervals | |
|---|---|---|---|---|---|---|---|
| Grade 9 variables only | w | MLD vs: | Low achieving | 0.121 | 0.041 | .004 | 0.039, 0.203 |
| Typically achieving | 0.124 | 0.032 | .000 | 0.060, 0.188 | |||
| High Achieving | 0.169 | 0.040 | .000 | 0.089, 0.249 | |||
| cv | MLD vs: | Low achieving | 0.058 | 0.027 | .037 | 0.004, 0.112 | |
| Typically achieving | 0.062 | 0.021 | .005 | 0.019, 0.104 | |||
| High Achieving | 0.097 | 0.026 | .000 | 0.044, 0.150 | |||
| Longitudinal variables | w | MLD vs: | Low achieving | 0.113 | 0.039 | .005 | 0.036, 0.190 |
| Typically achieving | 0.128 | 0.032 | .000 | 0.063, 0.193 | |||
| High Achieving | 0.133 | 0.044 | .004 | 0.045, 0.221 | |||
Similar results emerged from the ANCOVA in which cv was the dependent variable. As predicted, there was a main effect of mathematics achievement group, F(3, 63) = 4.57, p = .006, η2 = .179. No covariates were significant, ps > .66. Levene's test showed no group differences in variance, p = .13, so LSD post hocs were conducted. Children with MLD had higher cv scores (i.e., poorer mapping between the ANS and number words, as revealed by greater variability in their numerical estimates) relative to children in the LA, TA, and HA groups, ps < .04 (Table 1; Figure 3), Cohen's ds = 0. 968, 0.951, and 1.498, respectively. Although children in the HA group had smaller (i.e., better) cv relative to the TA group, this pairwise difference was not significant, p = .066, as was also the case with all remaining pairwise comparisons (LA vs. TA, p = .86, and LA vs. HA, p = .13). Only when covariates were removed from the ANOVA did children with HA have significantly smaller cv than children in the MLD (p < .001) and TA groups (p = .036), indicating a more precise ANS and more precise mapping between their ANS and verbal number system. (The lack of differences between the HA and LA groups (p = .086) may result from greater variability among the latter, as seen in Figure 3.)
Longitudinal domain-general and ANS performance measures
The lack of variance explained by the covariates suggests that the group differences we observed on our Number Discrimination (w) and Number Identification (cv) tasks did not stem from more general differences in lexical access to color or number words as measured by RAN, nor from verbal short-term or working memory as measured by Digit Span. However, these covariates represent only some of the domain-general skills associated with mathematical achievement levels. Additional covariates were not measured during the Grade 9 assessment, but were available from earlier years of the longitudinal study. We limited additional covariates to scores for which an association with mathematics achievement outcome have been demonstrated in previous research; these scores represent non-word reading decoding (Word Attack), executive function (CNT), visual memory (Memory Puzzle), and visual perception (DTVP Visual Closure) skills. Scores from these four measures, in addition to the covariates introduced in the first set of analyses, were included as covariates in a second set of two ANCOVAs reported below. To reduce covariates given the small sample sizes for our mathematics achievement groups, Digits Forward and Backwards were represented by a Digit Span composite score, and only the task-relevant RAN subtest (color for w, number for cv) was included in each ANCOVA.
We carried out an ANCOVA with w as the dependent, mathematics achievement group as the independent, and all six aforementioned covariates (Digit Span composite, RAN Colors, Word Attack, CNT, DTVP, and Memory Puzzle Test scores). The main effect of mathematics achievement group persisted, F(3, 59) = 5.26, p = .003, η2 = .211. No covariates accounted for a significant amount of variance in performance, ps > .054. Levine's test showed no group differences in variance, p = .35, so LSD tests were conducted. Children with MLD had higher (i.e., poorer) w scores relative to all three remaining groups, ps < .006 (Table 1). No other pairwise comparisons were significant, ps > .58.
When cv was entered as the dependent variable with the six covariate terms (substituting RAN-Number for RAN-Color), there was no main effect of mathematics achievement group, p = .144. Achievement group accounted for the largest proportion of the variance in cv of all variables in the model, η2 = .087, but the effect was not significant. All remaining ps > .10; all values of η2 < .046. Thus, post hoc comparisons were not indicated.
To summarize our findings on group differences, both the noisiness of the ANS (w) and the precision with which participants have mapped verbal labels onto their ANS representations (cv) differentiated children with MLD from their peers, but failed to differentiate children with low mathematics achievement from their typically achieving peers. This supports our hypothesis that a number-specific deficit in the ANS underlies MLD, at least in part. For w, these effects held when a wide range of non-numerical covariates were statistically controlled for, whereas effects of cv were diminished in the presence of these covariates. This is consistent with our hypotheses that w is a pure measure of ANS, whereas cv reflects a combination of skills dependent on both ANS and verbal mapping precision, the latter of which is more strongly correlated with domain-general covariates. We examined this notion with correlational analyses including w and cv.
ANS and domain general skills as predictors of mathematics achievement scores
Whereas we conducted ANCOVAs to examine ANS performance as a function of mathematics achievement levels, we used correlation and regression analyses to evaluate the relative contributions of ANS-acuity (w) and mapping-precision (cv) to predicting mathematics scores as a continuous variable. For regression analyses of mathematics achievement, we used as our dependent variable the average TEMA-2 or WJ-R score over time, to span achievement measured at Grades K to 3 and 3 to 6, respectively. We found that both predictor variables, w and cv, contributed to predicting these averages. While w accounted for 19% of the variance in mean TEMA-2 scores from Grades K to 3, F(1,69) = 17.036, p < .001, adjusted R2 = .189; adding cv to the model increased the adjusted R2 to .284, p = .002. Likewise, while w accounted for 21% of the variance in mean WJR-Calc scores from Grades 3 to 6, F(1,69) = 19.834, p < .001, adjusted R2 = .212, adding cv to the model increased the adjusted R2 to .283, p = .007. Both w and cv were significantly negatively correlated with TEMA-2 and WJR-Calc scores for all years of the study during which these scores were collected (Table 2).
Table 2. Pearson Correlations Between Grade 9 w or cv and Mathematics Achievement Scores Obtained at Kindergarten through Grade 6.
| w | cv | ||||
|---|---|---|---|---|---|
|
|
|||||
| Measure (Grade) | Correlation | p | Correlation | p | |
| TEMA-2 scores | |||||
| Kindergarten | -.320 | .006 | -.403 | .000 | |
| 1 | -.335 | .004 | -.400 | .001 | |
| 2 | -.426 | .000 | -.411 | .000 | |
| 3 | -.492 | .000 | -.453 | .000 | |
|
| |||||
| WJR-Calc scores | |||||
| 1 | -.562 | .000 | -.287 | .015 | |
| 3 | -.504 | .000 | -.406 | .000 | |
| 4 | -.423 | .000 | -.381 | .001 | |
| 5 | -.327 | .000 | -.316 | .008 | |
| 6 | -.437 | .000 | -.462 | .000 | |
Next, we tested for the relative contribution of our two ANS scores and the two covariates that accounted for at least 4% of the variance in the ANCOVAs reported above (i.e., Memory Puzzle Test and CNT efficiency), to performance on the TEMA-2 and WJ-R Calculation. The predictor variables (w, cv, memory puzzle, and CNT efficiency) appeared in sets of fixed order analyses. Tables 3 and 4 present the amount of variance in performance on the TEMA-2 and the WJ-R Calculations test predicted by each measure.
Table 3. Fixed Order Regression Analyses Predicting Average TEMA-2 Performance.
| Model | Dependent variable entered into model | R2 | R2 change (p) | Model F (df) | p |
|---|---|---|---|---|---|
| A- 1 | w | .20 | .20 (.000) | (1, 69) 17.70 | .000 |
| A- 2 | cv | .31 | .11 (.002) | (2, 68) 15.07 | .000 |
| A- 3 | CNT efficiency | .36 | .05 (.018) | (3, 67) 12.74 | .000 |
| A- 4 | Memory Puzzle | .41 | .05 (.055) | (4, 64) 11.16 | .000 |
| B- 1 | cv | .23 | .23 (.000) | (1, 69) 20.09 | .000 |
| B- 2 | CNT efficiency | .30 | .07 (.008) | (2, 68) 14.75 | .000 |
| B- 3 | Memory Puzzle | .32 | .02 (.137) | (3, 65) 10.38 | .000 |
| B- 4 | w | .41 | .09 (.003) | (4, 64) 11.16 | .000 |
| C- 1 | CNT efficiency | .21 | .21 (.000) | (1, 69) 18.02 | .000 |
| C- 2 | Memory Puzzle | .25 | .04 (.052) | (2, 66) 10.93 | .000 |
| C- 3 | w | .39 | .14 (.000) | (3, 65) 13.62 | .000 |
| C- 4 | cv | .41 | .02 (.105) | (4, 64) 11.16 | .000 |
| D- 1 | Memory Puzzle | .05 | .05 (.060) | (1, 67) 3.47 | .048 |
| D- 2 | w | .28 | .23 (.000) | (2, 66) 12.59 | .000 |
| D- 3 | cv | .35 | .07 (.010) | (3, 65) 11.51 | .000 |
| D- 4 | CNT efficiency | .41 | .06 (.011) | (4, 64) 11.16 | .000 |
| E- 1 | Memory Puzzle | .05 | .05 (.060) | (1, 67) 3.47 | .048 |
| E- 2 | cv | .24 | .19 (.000) | (2, 66) 10.46 | .000 |
| E- 3 | w | .35 | .11 (002) | (3, 65) 11.51 | .000 |
| E- 4 | CNT efficiency | .41 | .06 (.011) | (4, 64) 11.16 | .000 |
Table 4. Fixed Order Regression Analyses Predicting Average WJ-R Mathematics Achievement.
| Model | Dependent variable entered into model | R2 | R2 change (pa) | Model F (df) | p |
|---|---|---|---|---|---|
| A- 1 | w | .22 | .22 (.000) | (1, 69) 19.82 | .000 |
| A- 2 | cv | .30 | .08 (.007) | (2, 68) 14.81 | .000 |
| A- 3 | CNT efficiency | .36 | .06 (.017) | (3, 67) 12.60 | .000 |
| A- 4 | Memory Puzzle | .43 | .07 (.026) | (4, 64) 12.06 | .000 |
| B- 1 | cv | .20 | .20 (.000) | (1, 69) 17.34 | .000 |
| B- 2 | CNT efficiency | .28 | .08 (.007) | (2, 68) 13.36 | .000 |
| B- 3 | Memory Puzzle | .31 | .03 (.090) | (3, 65) 9.89 | .000 |
| B- 4 | w | .43 | .12 (.001) | (4, 64) 12.06 | .000 |
| C- 1 | CNT efficiency | .20 | .20 (.000) | (1, 69) 17.56 | .000 |
| C- 2 | Memory Puzzle | .25 | .05 (.035) | (2, 66) 11.27 | .000 |
| C- 3 | w | .42 | .17 (.000) | (3, 65) 15.50 | .000 |
| C- 4 | cv | .43 | .01 (.235) | (4, 64) 12.06 | .000 |
| D- 1 | Memory Puzzle | .06 | .06 (.048) | (1, 67) 4.07 | .048 |
| D- 2 | w | .32 | .26 (.000) | (2, 66) 15.15 | .000 |
| D- 3 | cv | .36 | .04 (.030) | (3, 65) 12.35 | .000 |
| D- 4 | CNT efficiency | .43 | .07 (.008) | (4, 64) 12.06 | .000 |
| E- 1 | Memory Puzzle | .06 | .06 (.048) | (1, 67) 4.07 | .048 |
| E- 2 | cv | .22 | .16 (.000) | (2, 66) 9.53 | .000 |
| E- 3 | w | .36 | .14 (000) | (3, 65) 12.35 | .000 |
| E- 4 | CNT efficiency | .43 | .07 (.008) | (4, 64) 12.06 | .000 |
As sole predictors of TEMA-2 scores, w, cv, CNT, and Memory Puzzle each predicted a significant amount of variance in mathematics achievement (20%, 23%, 21%, and 5%, respectively). Of the four predictors examined, w was the most consistent in accounting for the greatest variability in mathematics performance, regardless of whether the preceding regression model include none, one, two, or three of the remaining variables, each time accounting for 9% to 23%, of variability. Memory Puzzle accounted for the least variability (≤ 5%), and its contribution to the models was not statistically significant. Similar results emerged from models predicting average WJ-R Calculation performance, as summarized in Table 4.
Shared variance was indicated for cv and w, as expected, because while each variable contributed > 20% of performance variance as a sole predictor (Table 3, Model A-1 and B-1, respectively), each contributed only 2 to 12% of the variance if the other variable appeared in a previous model (e.g., Table 3, Models A-2, C-4). This was tested further with Model E. Likewise, an association between cv and CNT was implicated, and was tested subsequently via correlations. We found, as expected, that w and cv are significantly positively correlated with each other, r = .399, p = .001. We also found that neither is correlated with Memory Puzzle, rs = .039 and -.187, respectively, while each is correlated with CNT efficiency, but to different degrees, r = -.297 (p = .012) and -.431 (p < .001), for w and cv, respectively.
ANS and symbolic mathematics assessment scores
Our final analyses pertained to our hypothesis regarding the relationship between w, cv, and symbolic mathematics performance. Most (if not all) formal school mathematics measures that involve ANS representations also require the ANS representations to be translated into symbolic format (i.e., number words or Arabic numerals). Therefore, we predicted that the more heavily a skill relies on formal instruction, the more likely it would be to correlate with cv above and beyond any correlation with w. To test this prediction, we examined whether w or cv scores predicted performance on timed calculations on the fast math task (FMT), timed decomposition (CDN), and rank ordering of rational numbers (RPT), all of which rely heavily on symbolic mathematics ability. Measures of speed on the timed calculations (FMT-easy) and decomposition (CDN) tests correlated significantly with cv and not with w, as indicated by Spearman Rho values reported in Table 5 (speed was not examined for the FMT hard tasks, because all participants used the entire one minute permitted to complete this task). In contrast, accuracy on the harder subtest of the FMT, in which participants were explicitly asked to mentally calculate their responses, correlated with both w and cv, whereas percent accuracy on CDN, on which participants could use finger counting or other non-automatic strategies, was not correlated with either measure (Table 5). The pass/fail score of the RPT required use of a binary logistic regression, with the Pass/Fail score as the dependent variable, and both cv and w scores as independents. The model was significant for predicting participants who passed the RPT, R2 = .307, but, as predicted, only cv was a significant sole predictor, p = .003; adding w to the model did not increase prediction accuracy, p > .26. These results support the hypothesized relationship whereby more highly symbolic tasks correlate with cv more strongly than with w.
Table 5. Spearman Rho Correlations between w or cv and Grade 8 or 9 Mathematics Scores.
| w | cv | ||||
|---|---|---|---|---|---|
|
|
|||||
| Grade | Math Score | Correlation | p | Correlation | p |
| Grade 8 | |||||
| Fast Math Task (FMT) | |||||
| Timed calculations | |||||
|
| |||||
| Easy problems RT - speed | .191 | .110 | .336 | .004 | |
| Easy problems - accuracy | -.208 | .081 | -.305 | .010 | |
| Hard problems - accuracy | -.299 | .011 | -.479 | .000 | |
| Grade 9 | |||||
| Composing and Decomposing Numbers (CDN) | |||||
|
| |||||
| # correct/60 sec - speed | -.149 | .215 | -.294 | .013 | |
| % correct - accuracy | .053 | .660 | -.067 | .580 | |
Discussion
The primary questions motivating our research concerned whether a less precise Approximate Number System (ANS) underlies persistently deficient mathematics achievement. While statistically controlling for concurrent levels of domain-general skills, we found that ANS acuity distinguishes children with mathematical learning disabilities (MLD) from their peers without MLD, including children with low, typical, or high mathematics achievement. These results are consistent with findings of reduced intraparietal sulcus (IPS) activation in children with vs. without dyscalculia during nonsymbolic magnitude comparison (Price, Holloway, Räsänen, Vesterinen, & Ansari, 2007), and extend these neurobiological findings to behavioral assessments (i.e., w and cv). Moreover, two distinct features of numerical processing differentiated students with MLD from their peers: an imprecise ANS (w) and imprecision in the mapping between the nonverbal ANS and the verbal number system (cv). Thus, although domain-general deficits likely play a role in children's mathematical learning and performance, our results suggest that MLD derives, at least in part, from a domain-specific deficit in the ANS. This contrasts with several reports that children with dyscalculia have unimpaired ANS acuity (e.g., Holloway & Ansari, 2009; Iuculano, Tang, Hall, & Butterworth, 2008; Rousselle & Noël, 2007); however, none of these other studies estimated individual Weber fractions (w) or coefficients of variation (cv), which may be more sensitive measures of ANS precision than coarser measures of group differences.
Is a deficient ANS responsible for most cases of poor mathematics achievement? Empirical support for domain-general influences on mathematics achievement (e.g., Geary et al., 2007) suggests otherwise. In the present study, we found that an impaired ANS differentiated only those children with deficient mathematics achievement and not those children with moderately low achievement. Remarkably, ANS-acuity (w) and mapping-precision (cv) among children with low and typical mathematics achievement levels were indistinguishable. Thus, collapsing across two groups of children with mathematical difficulties (children with MLD and children with low achievement) inappropriately combines children whose challenges with mathematics may have different etiologies. This practice should be avoided as it may obscure the core deficits of MLD and hinder efforts to identify appropriate educational support. Thus, our results contribute to ongoing debates concerning definitional and research criteria for MLD, and distinctions between MLD and the broader construct of mathematical learning difficulties.
If deficient ANS-acuity is one core aspect of MLD, this implicates some mechanism by which ANS representations interface with and affect more symbolic mathematics skills acquired through school mathematics. For this reason, our secondary research questions indirectly concerned possible mechanisms underlying the association between ANS-acuity (w) and formal mathematics achievement. We found that both ANS-acuity (w) and mapping-precision (cv) correlate with symbolic mathematics performance, supporting the notion that the ANS is activated during formal, symbolic mathematics (Dehaene et al., 2003). However, although regression analyses revealed an association between w and cv, we found that each of these measures uniquely accounted for a significant degree of variation in performance on a range of mathematical tasks.
Moreover, for tasks that seem significantly removed from intuitive computations, such as the RPT that involves rank ordering fractions and decimals, mapping-precision (cv) is more predictive of performance than is ANS-acuity (w), as we predicted. This supports the notion that the mapping between the ANS and the verbal number system (as measured by cv) may mediate the relationship between ANS-acuity (w) and computational skills involving symbolic numbers. For instance, domain-general cognitive skills (such as working memory) may mediate mapping precision, independent of pure ANS skills. This hypothesis is consistent with our findings that children in the high achieving (HA) group had more precise mappings between ANS and verbal number representations (i.e., smaller cv) than their typically achieving peers, but only when domain-general covariates were not statistically controlled. Further prospective studies, rather than the retrospective and concurrent associations examined in the present study, are needed to delineate these relationships and how they contribute not only to MLD but also to successful or even superior mathematics achievement.
Efficient differentiation of students likely to experience significantly poor mathematics achievement outcomes has important implications for identification and, possibly, for appropriate educational interventions. Current policy recommendations address the need to diminish the high proportion of American students performing very poorly in mathematics, and the need to understand the mechanisms underlying mathematical learning (National Mathematics Advisory Panel, 2008). Our findings that a subset of children with mathematical difficulties have domain-specific impairment of the ANS motivate important questions regarding whether training can improve ANS-acuity (w) or mapping-precision (cv), and if such training improves school outcomes (Wilson, Revkin, Cohen, Cohen & Dehaene, 2006).
Finally, our results support the suggestion that large individual differences exist in the acuity of the Approximate Number System (ANS), a representational system that is widespread across both development and species (Feigenson et al., 2004). These individual differences interact with the uniquely human ability to perform formal, symbolic mathematics typically supported by instruction. How best to characterize this relationship remains a question ripe for future inquiry. Perhaps individuals with MLD begin schooling with poor ANS-acuity, which underlies their difficulty in acquiring symbolic mathematics concepts and leads to low mathematics achievement. Alternatively, children with pervasive MLD may have a reduced quality or quantity of formal mathematics experiences and opportunities, thereby resulting in a more poorly honed ANS. These two possibilities are not mutually exclusive, and both are consistent with evidence that development of ANS acuity follows a protracted trajectory from preschool to adolescence (Halberda & Feigenson, 2008). Ongoing prospective studies are beginning to address these two routes (e.g., de Smedt, Verschaffel, & Ghesquière, 2009), and may further elucidate the complex relationship between a remarkably basic form of numerical knowledge shared across species and acquired mathematical capacities that emerge with formal schooling.
Acknowledgments
This research was supported by grant RO1 HD34061-01-09 from the National Institute of Child Health and Human Development.
Contributor Information
Michèle M. M. Mazzocco, Department of Psychiatry and Behavioral Sciences, Johns Hopkins University School of Medicine, and Kennedy Krieger Institute
Lisa Feigenson, Department of Psychological and Brain Sciences, Johns Hopkins University.
Justin Halberda, Department of Psychological and Brain Sciences, Johns Hopkins University.
References
- Anderson P, Anderson V, Northam E, Taylor HG. Standardization of the contingency naming test (CNT) for school-aged children: A measure of reactive flexibility. Clinical Neuropsychological Assessment. 2000;1:247–273. [Google Scholar]
- Ansari D, Dhital B. Age-related changes in the activation of the intraparietal sulcus during nonsymbolic magnitude processing: An event-related functional magnetic resonance imaging study. Journal of Cognitive Neuroscience. 2006;18:1820–1828. doi: 10.1162/jocn.2006.18.11.1820. [DOI] [PubMed] [Google Scholar]
- Barbaresi WJ, Katusic SK, Collagin RC, Weaver AL, Jacobsen SJ. Math learning disorder: Incidence in a population-based birth cohort, 1976-82, Rochester, Minn. Ambulatory Pediatrics. 2005;5:281–289. doi: 10.1007/s10803-008-0645-8. [DOI] [PubMed] [Google Scholar]
- Baroody AJ, Gatzke MR. The estimation of set size by potentially gifted kindergarten-age children. Journal for Research in Mathematics Education. 1991;22:59–68. doi: 10.2307/749554. [DOI] [Google Scholar]
- Bull R, Scerif G. Executive functioning as a predictor of children's mathematics ability: Inhibition, switching, and working memory. Developmental Neuropsychology. 2001;19:273–293. doi: 10.1207/S15326942DN1903_3. [DOI] [PubMed] [Google Scholar]
- Cronbach LJ. Coefficient alpha and the internal structure of tests. Psychometrika. 1951;16(3):297–334. doi: 10.1007/BF02310555. [DOI] [Google Scholar]
- De Smedt B, Verschaffel L, Ghesquière P. The predictive value of numerical magnitude comparison for individual differences in mathematics achievement. Journal of Experimental Child Psychology. 2009;103:469–479. doi: 10.1016/j.jecp.2009.01.010. [DOI] [PubMed] [Google Scholar]
- Dehaene S, Bossini S, Giraux P. The mental representation of parity and number magnitude. Journal of Experimental Psychology: General. 1993;122(3):371–396. doi: 10.1037/0096-3445.122.3.371. [DOI] [Google Scholar]
- Dehaene S, Piazza M, Pinel P, Cohen L. Three parietal circuits for number processing. Cognitive Neuropsychology. 2003;20:487–506. doi: 10.1080/02643290244000239. [DOI] [PubMed] [Google Scholar]
- Denckla MB, Rudel RG. Rapid automatized naming (R.A.N.): Dyslexia differentiated from other learning disabilities. Neuropsychologia. 1976;14:471–479. doi: 10.1016/0028-3932(76)90075-0. [DOI] [PubMed] [Google Scholar]
- Feigenson L, Dehaene S, Spelke ES. Core systems of number. Trends in Cognitive Sciences. 2004;8:307–314. doi: 10.1016/j.tics.2004.05.002. [DOI] [PubMed] [Google Scholar]
- Geary DC. Mathematical disabilities: Cognitive, neuropsychological, and genetic components. Psychological Bulletin. 1993;114:345–362. doi: 10.1037/0033-2909.114.2.345. [DOI] [PubMed] [Google Scholar]
- Geary DC, Hoard MK, Byrd-Craven J, DeSoto MC. Strategy choices in simple and complex addition: Contributions of working memory and counting knowledge for children with mathematical disability. Journal of Experimental Child Psychology. 2004;88:121–151. doi: 10.1016/j.jecp.2004.03.002. [DOI] [PubMed] [Google Scholar]
- Geary DC, Hoard MK, Byrd-Craven J, Nugent L, Numtee C. Cognitive mechanisms underlying achievement deficits in children with mathematical learning disability. Child Development. 2007;78:1343–1359. doi: 10.1111/j.1467-8624.2007.01069.x. [DOI] [PMC free article] [PubMed] [Google Scholar]
- Ginsburg HP, Baroody AJ. Test of Early Mathematics Ability. Second. Austin, TX: PRO-ED; 1990. [Google Scholar]
- Halberda J. PANAmath: The psychological assessment of number-sense acuity. Manuscript in preparation 2010 [Google Scholar]
- Halberda J, Feigenson L. Developmental change in the acuity of the “number sense”: The approximate number system in 3-, 4-, 5-, and 6-year-olds and adults. Developmental Psychology. 2008;44:1457–1465. doi: 10.1037/a0012682. [DOI] [PubMed] [Google Scholar]
- Halberda J, Mazzocco MM, Feigenson L. Individual differences in non-verbal number acuity correlate with maths achievement. Nature. 2008;455(2):665–668. doi: 10.1038/nature07246. [DOI] [PubMed] [Google Scholar]
- Hammill D, Pearson N, Voress J. Developmental Test of Visual Perception. 2nd. Austin, TX: PRO-ED; 1993. [Google Scholar]
- Hibbard JH, Peters E, Dixon A, Tusler M. Consumer competencies and use of comparative quality information: It isn't just about literacy. Medical Care Research and Review. 2007;64:379–394. doi: 10.1177/1077558707301630. [DOI] [PubMed] [Google Scholar]
- Hoard MK, Geary DC, Byrd-Craven J, Nugent L. Mathematical cognition in intellectually precocious first graders. Developmental Neuropsychology. 2008;33:251–276. doi: 10.1080/87565640801982338. Special Issue. [DOI] [PubMed] [Google Scholar]
- Holloway ID, Ansari D. Mapping numerical magnitudes onto symbols: The numerical distance effect and individual differences in children's mathematics achievement. Journal of Experimental Child Psychology. 2009;103:17–29. doi: 10.1016/j.jecp.2008.04.001. [DOI] [PubMed] [Google Scholar]
- Iuculano T, Tang J, Hall CWB, Butterworth B. Core information processing deficits in developmental dyscalculia and low numeracy. Developmental Science. 2008;11:669–680. doi: 10.1111/j.1467-7687.2008.00716.x. [DOI] [PubMed] [Google Scholar]
- Kaufman E, Lord M, Reese T, Volkmann J. The discrimination of visual number. American Journal of Psychology. 1949;62:498–525. [PubMed] [Google Scholar]
- Mazzocco MMM, Bhatia NS, Lesniak-Karpiak K. Visuospatial skills and their association with math performance in girls with fragile X or Turner Syndrome. Child Neuropsychology. 2006;12:87–110. doi: 10.1080/09297040500266951. [DOI] [PubMed] [Google Scholar]
- Mazzocco MMM, Devlin KT. Parts and ‘holes’: Gaps in rational number sense in children with vs. without mathematical learning disability. Developmental Science. 2008;11:681–691. doi: 10.1111/j.1467-7687.2008.00717.x. Special Section. [DOI] [PubMed] [Google Scholar]
- Mazzocco MMM, Devlin KT, McKenney SL. Is it a fact? Timed arithmetic performance of children with mathematical learning disabilities (MLD) varies as a function of how MLD is defined. Developmental Neuropsychology. 2008;33:318–344. doi: 10.1080/87565640801982403. Special Issue. [DOI] [PubMed] [Google Scholar]
- Mazzocco MMM, Hanich LB. Math achievement, numerical processing, and executive functions in girls with Turner syndrome: Do girls with Turner syndrome have math learning disability? Learning and Individual Differences. 2010;20:70–81. doi: 10.1016/j.lindif.2009.10.011. Special Issue. [DOI] [Google Scholar]
- Mazzocco MMM, Kover ST. A longitudinal assessment of the development of executive function and their association with math performance. Child Neuropsychology. 2007;13:18–45. doi: 10.1080/09297040600611346. [DOI] [PubMed] [Google Scholar]
- Mazzocco MMM, Myers GF. Complexities in identifying and defining mathematics learning disability in the primary school-age years. Annals of Dyslexia. 2003;53:218–253. doi: 10.1007/s11881-003-0011-7. [DOI] [PMC free article] [PubMed] [Google Scholar]
- Mazzocco MMM, Thompson RE. Kindergarten predictors of math learning disability. Learning Disabilities Research & Practice. 2005;20:142–155. doi: 10.1111/j.1540-5826.2005.00129.x. [DOI] [PMC free article] [PubMed] [Google Scholar]
- McCloskey M. In: Why is math so hard for some children? The nature and origins of children's mathematical learning difficulties and disabilities. Berch DB, Mazzocco MMM, editors. Baltimore, MD: Brookes Publishers; 2007. [Google Scholar]
- Murphy MM, Mazzocco MMM, Hanich L, Early M. Cognitive characteristics of children with Mathematics Learning Disability (MLD) varies as a function of criterion used to define MLD. Journal of Learning Disabilities. 2007;40:467–487. doi: 10.1177/00222194070400050901. [DOI] [PubMed] [Google Scholar]
- National Mathematics Advisory Panel. Foundations for Success: Final Report of the National Mathematics Advisory Panel. U.S. Department of Education; 2008. [Google Scholar]
- National Reading Panel. Teaching children to read: An evidence-based assessment of the scientific research literature on reading and its implications for reading instruction (NIH Pub 00-4769) Rockville, MD: National Institute of Child Health and Human Development; 2000. [Google Scholar]
- Ostad SA. Developmental differences in addition strategies: A comparison of mathematically disabled and mathematically normal children. British Journal of Educational Psychology. 1997;67:345–357. doi: 10.1111/j.2044-8279.1997.tb01249.x. [DOI] [PubMed] [Google Scholar]
- Parsons S, Bynner J. Numeracy and Employment. Education & Training. 1997;39(2):43–51. doi: 10.1108/00400919710164125. [DOI] [Google Scholar]
- Price GR, Holloway I, Räsänen P, Vesterinen M, Ansari D. Impaired parietal magnitude processing in developmental dyscalculia. Current Biology. 2007;17(24):R1042–R1043. doi: 10.1016/j.cub.2007.10.013. [DOI] [PubMed] [Google Scholar]
- Rivera-Batiz FL. Quantitative literacy and the likelihood of employment among young adults in the United States. The Journal of Human Resources. 1992;27:313–328. [Google Scholar]
- Rousselle L, Noël MP. Basic numerical skills in children with mathematics learning disabilities: A comparison of symbolic vs. non-symbolic magnitude processing. Cognition. 2007;102:361–395. doi: 10.1037/0012-16-49.44.2.544. [DOI] [PubMed] [Google Scholar]
- Siegel LS, Ryan EB. The development of working memory in normally achieving and subtypes of learning disabled children. Child Development. 1989;60:973–980. doi: 10.1111/j.1467-8624.1989.tb03528.x. [DOI] [PubMed] [Google Scholar]
- Siegler RS. The birth of a new discipline. In: Berch D, Mazzocco MMM, editors. Why is Math So Hard for Some Children? The Nature and Origins of Mathematical Learning Difficulties and Disabilities. Baltimore, MD: Brookes Publishers; 2007. pp. xvii–xxii. [Google Scholar]
- Whalen J, Gallistel CR, Gelman R. Nonverbal counting in humans: The psychophysics of number representation. Psychological Science. 1999;10:130–137. doi: 10.1111/1467-9280.00120. [DOI] [Google Scholar]
- Willburger E, Fussenegger B, Moll K, Wood G, Landerl K. Naming speed in dyslexia and dyscalculia. Learning and Individual Differences. 2007;18:224–236. doi: 10.1016/j.lindif.2008.01.003. [DOI] [Google Scholar]
- Wilson AJ, Revkin SK, Cohen D, Cohen L, Dehaene S. An open trial assessment of “The Number Race,” an adaptive computer game for remediation of dyscalculia. Behavioral and Brain Functions. 2006;2:20. doi: 10.1186/1744-9081-2-20. [DOI] [PMC free article] [PubMed] [Google Scholar]
- Wilson KM, Swanson HL. Are mathematics disabilities due to domain general or domain-specific working memory deficit? Journal of Learning Disabilities. 2001;34:237–248. doi: 10.1177/002221940103400304. [DOI] [PubMed] [Google Scholar]
- Woodcock RW, Johnson MB. Woodcock–Johnson Psycho-Educational Battery-Revised. Allen, TX: DLM Teaching Resources; 1990. [Google Scholar]
- Woodcock RW, Mather N. WJ-R Tests of Achievement: Examiner's Manual. In: Woodcock RW, Johnson MB, editors. Woodcock-Johnson Psycho-Educational Battery-Revised. Itasca, IL: Riverside; 1990. [Google Scholar]