Abstract
In this work, we studied the stretching of λ phage DNA molecules immobilized on an optical fiber tip attached to a force sensitive tuning fork under AC electric fields. We designed a two electrodes stretching system in a small chamber: one is a gold-coated optical fiber tip electrode, and the other is a gold-coated flat electrode. By applying a dielectrophoretic force, the immobilized λ DNA molecules on the tip are stretched and the stretching process is monitored by a fluorescent microscope. The DNA stretching in three-dimensional space is optimized by varying electrode shape, electrode gap distance, AC frequency, and solution conductivity. By observing the vibrational amplitude change of a quartz tuning fork, we measured the effects due to Joule heating and the dielectrophoretic force on the tethered DNA molecules in solution. This work demonstrates a method to manipulate and characterize immobilized λ DNA molecules on a probe tip for further study of single DNA molecules.
Keywords: DNA stretching, DNA manipulation, fluorescence imaging, dielectrophoretic force
1. Introduction
DNA is composed of 4 types of nucleotides with their sequence containing all the genetic information used in the development of organisms. DNA is one of the key molecules in biological research. The study of individual DNA molecules requires the manipulation of the molecule. DNA tends to coil in solution to reduce conformational entropy[1]. In some experiments especially single molecule studies, such as single molecule DNA sequencing, DNA molecules are often attached to a probe tip to manipulate and to study them more methodically with great precision [2, 3]. Stretching the attached DNA molecules can characterize the bonding between the tip and the DNA molecules and estimate the number of DNA molecules attached to the tip. There are several ways to manipulate DNA molecules such as optical traps, magnetic tweezers, hydrodynamic shear forces, and forces due to an electric field. Optical trapping needs a highly focused laser beam to trap and manipulate the DNA attached to a dielectric bead [4, 5]. Magnetic tweezers demand a fine-tuned magnetic field gradient to control DNA attached to a magnetic bead [6, 7]. A much simpler method is to flow liquid across DNA immobilized on a channel surface to stretch DNA using hydrodynamic shear force [8]. Electric fields can also manipulate DNA molecules using two electrodes [9–11].
When there is a non-uniform AC electric field, DNA molecules exhibit an induced dipole. The induced dipole will interact with the non-uniform external electrical field, and the molecules will move under the influence of the dielectrophoretic (DEP) force [12]. The strength and direction of the DEP force depends on the molecule, the solution containing the molecules, and the frequency of the applied AC electric field. If the molecules are more polarizable than the solution, then they will move toward a strong electric field gradient (positive dielectrophoreis); if the molecules are less polarizable, they move toward a weak electric field gradient (negative dielectrophoresis). Several reports had demonstrated DNA manipulation by the DEP force [13–15]. In these reports, fluid channels and electrodes on a flat surface using lithographical techniques were fabricated. On the flat channels, DNA will be confined in a two dimensional space. The nearly two dimensional channel is advantageous for imaging DNA molecules. However, the shallow fluid channel does not provide enough space to contain a tip, nor does it allow the DNA to move freely in three dimensions which may change its response to the DEP force. To allow the DNA to move in all 3 dimensions, we have constructed a small chamber for housing the tip and another electrode as illustrated in Figure 1.
Figure 1.
Diagram of dielectrophoretic DNA stretching. (a) A tip electrode and bottom electrode is inside a glass chamber. Objective lens, notch filter, optical band pass filter, and CCD camera are housed in one piece of machined cylinder. A 488 nm laser is focused on to the tip electrode. Only an optical fiber is immersed in solution. (b) CCD image of a tip electrode and bottom electrode in solution.
Some Scanning Probe Microscope (SPM) setups are capable of sensing pico-newton range forces and have the spatial resolution of sub-nanometer with the help of piezoelectric actuator [16]. After the invention of scanning probe microscopy in the 1980’s, the technique has been used in many applications including a dielectrophoretic force microscopy [17]. There are many reports on the work of attaching short length of DNA to a tip [18, 19]. however, manipulation of tens of micrometer long DNA on a tip have not been well studied. In this work, we used dielectrophoresis to stretch λ DNA, 48.5 kbp (~16.5 µm) long, tethered to a force sensitive fiber tip and the stretching process is monitored by a fluorescent microscope. We measured the dielectrophoretic force on the tethered DNA in solution by observing the vibrational amplitude change of a quartz tuning fork.
2. Experimental setup details
2.1 Electrodes and Chamber
The two electrodes that generate electric field for dielectrophoretic stretching of DNA are composed of a gold plated tip and a bottom electrode as shown in Figure 1. The tip was made from a single mode optical fiber (Corning Optical fiber, SMF-28(TM), core diameter 125 µm, cladding diameter 245 µm) using a micropipette puller (Sutter Instrument, P-2000). The pulled fiber tip was cleaned by Piranha solution (sulfuric acid: hydrogen peroxide= 3:1) for 10 min, and then washed with DI water. For the dielectrophroresis stretching of DNA experiments in this work, the tip was coated with chromium and gold using a sputter coater (Cressington, 108 auto). Under the conditions of 0.07 mbar pressure and 20 mA current, Cr was coated for 20 sec as a sacrificial layer, then gold was coated for 9 min. The coated metal thickness was measured to be 300 nm with a Scanning Electron Microscope as shown in Figure S1 (Supporting Information). The bottom electrode was made from a 1 mm diameter brass rod. The brass rod was coated with Cr and Au using the same conditions as coating the tip. The chamber that contains the tip and the bottom electrode in electrolyte solution has a volume roughly 1 cm3 cubic as shown in Figure 1(a). A Teflon support was machined for holding the glass pieces. The glass and the Teflon were glued with epoxy. The Teflon support was further drilled to have a hole for the bottom electrode. Polydimethylsioxane (PDMS) was finally used to seal the chamber.
2.2 DNA stretching experiment setup and Fluorescent imaging
The 48kbps λ DNA (New England Bio laboratory, N3011S) used in this experiment were biotinlated at one end following the procedure of Keyser et al. [20]. The biontinlated oligonucleodites (Integrated DNA Technologies) was purchased with their sequence matching for the “overhang” of λ DNA. The λ DNA and the oligonucleotides containing biotins were ligated with T4 ligase enzyme (New England Bio laboratory). A DNA gel-extraction kit (QIAGEN, QIAEX II gel extraction kit) was used to filter only the biotinlated λ DNA after the ligation. Streptavidin was then attached to the tip by dipping the tip 10–20 µm deep in 10 mg/ml streptavidin (Invitrogen, 434301) solution for 10 min. The tip was then washed by DI water a few times to remove weakly adsorbed streptavidins. The streptavidin adsorbed tip was soaked in the biotinlabeled λ DNA for 10 min. After soaking the tip in λ DNA solution, the tip’s end was kept in solution during the experiments to avoid DNA detachment. The solution containing the tip was then exchanged with diluted TAE buffer. After attaching λ DNA to the tip by streptavidin-biotin bonding, the tip was moved into the electrode chamber filled with the same diluted TAE buffer. The tip and electrode chamber were positioned by two manual XYZ micro-manipulators as shown in the Figure 1(b). The AC voltage between the two electrodes was produced by a function generator (Agilent Technologies, 33250A) and power amplifier (HP, 467A Instrumentation Power Amplifier).
Fluorescent imaging
A 488 nm wave length laser has been used to excite Ethidium bromide (EtBr) (Sigma Aldrich, E1510-10ML) mixed with λ DNA at a ratio of 1200 EtBr molecules per λ DNA. The power of the laser (Coherent, HighLight laser) was varied from 1 mW to 10 mW to get an optimal fluorescent image. A long working distance (6 mm) of Mitutoyo 100× objective lens was used since the distance from the bottom electrode to the object lens was 5 mm. A notch filter (Kaiser, HNPF-488-1.0) for the 488 nm laser and an optical band pass filter (Edmundoptics, 550nm CWL, 80nm Bandwidth, NT65-744) located between the object lens and a cooled CCD (Sony ICX285AL Monochrome Sensor) were used to minimize background light. The objective lens, notch filter, optical band pass filter, and CCD camera were housed in one piece of machined aluminum tube to reduce background light. The contrast of the captured images was enhanced using ImageJ software [2]. The CCD image size was calibrated with a 125µm diameter optical fiber and pixel distance was measured by the ImageJ.
2.3 Tuning fork sensor
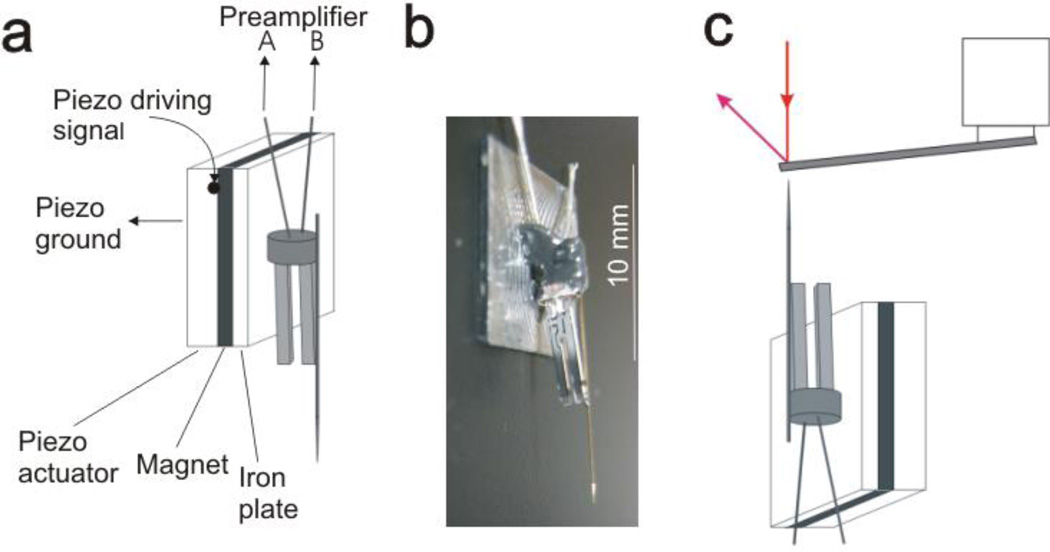
A quartz tuning fork can be used as a force detector [21, 22]. By attaching the tip to one prong of the fork, this device can be used as a force sensors [23, 24]. Quartz is a piezoelectric material; mechanical deformation of the quartz tuning fork generates a voltage, and vice versa. The quartz tuning fork has a resonant frequency, and can be driven by both mechanical and electrical methods. The resulting voltage or current signal from the oscillating tuning fork can be electronically measured [25]. We adopted the mechanical driving method using a piezo actuator. Figure 2(a) shows schematic diagram of the driving piezo, a magnet, an iron disk, and a tuning fork. Figure 2(b) is a photo of a tuning fork (Fox electronics, NC38LF-327) glued to the iron disk. An optical fiber coated with Au was glued to one prong of the tuning fork as shown in Figure 2(b). The magnet and iron disk were used so that the apparatus can be attached or detached from the piezo actuator easily. The voltage signal from the tuning fork was 1000 times pre-amplified using a home-made amplifier. A lock-in amplifier (Standford Reserach Systems, SR850) was used to generate the driving signal for the piezo and locked-in the pre-amplified voltage signal. The driving amplitude was 20–70 mVrms to get the resonant amplitude of ~0.5 Vrms after pre-amplification.
Figure 2.
(a) Diagram of tuning fork sensor setup. Tuning fork is mechanically driven by a piezo actuator, and the tuning fork’s oscillation voltage signal is measured. (b) Photograph of tip-attached tuning fork sensor. The fork is glued to the iron plate. (c) Diagram of calibrating force sensitivity of a tuning fork sensor using Bruker AFM and a tipless cantilever (not to scale).
Karrai et al [26] suggested an additional frictional force (Ffric) on a tuning fork sensor by the equation
| (1) |
Where V is piezoelectric signal amplitude during the frictional force interaction, and V0, k, x0, and Q are piezoelectric signal amplitude, spring constant, oscillation amplitude and quality factor before the additional frictional force exerts. The spring constant can be calculated by k = EWT3/(4L3)=21000 Nm−1, where E(Young’s modulus for quartz), W(fork’s width), T(fork’s thickness), and L(fork’s length) are 7.87 × 10¹⁰ Nm−2, 4 mm, 0.32 mm, and 0.6 mm respectively [26]. The oscillation amplitude of the tuning fork is estimated by using following equation [27]
| (2) |
where R=35 kΩ, d21 = 2.31 × 10⁻¹² CN−1 for quartz, and Le = 3.5 mm. The calculated output voltage/displacement is 0.18 mV/nm. When a resonant amplitude is 0.5 V after 1000 times amplification, the corresponding oscillation amplitude is estimated to be 2.8 nm. The Quality factor (f0/Δf) of this tuning fork sensor is about 100. We assume that the DNA stretching dielectrophoretic force is parallel to the prong’s long axis (a normal exerting force) and the stretching force is regarded as a frictional force.
The vibration amplitude change of a tuning fork vs normal exerting force was calibrated empirically as shown in figure 2(c). The vibration amplitude of a tuning fork was reduced when the tuning fork-attached tip was pressed by a tipless cantilever (MIKROMASCH, CSC12/tipless). When the tipless cantilever pressed the vibrating tip, we measured simultaneously the cantilever’s bending and the tuning fork’s vibration amplitude reduction using a Bruker-nano AFM system. Cantilver’s spring constant was calibrated as 0.046 N/m by measuring thermal vibration of the cantilever [28]. With the conditions of 70 mVrms driving amplitude of piezo-actuator and 1000 times pre-amplification, the calibrated indenting force vs vibration amplitude reduction was 0.87 nN/mV.
3. Results and discussion
3.1 Dielectrophoretic force on DNA
The DEP force for a polarizable molecule can be described by the following formula,
| (3) |
where α is the molecule’s polarizability and E is the magnitude of an applied electrical field [12]. The relationship between the polarizability α and the dielectric constant of the molecule εp or the medium εm is determined by the Clausius-Mossotti equation: α ∝ Re(K(ω)) [29], where the Clausius-Mossotti factor K(ω) indicates the relative polarizability of the particle with respect to its suspending medium. The Clausius-Mossotti factor K(ω) is constant for a given frequency and can be written as
| (4) |
where εp* or εm* is the dielectric constant of the molecule or medium respectively. The Clausius-Mossotti factor K(ω) affects whether molecules will be attracted or repelled from a strong electric field gradient region. If a molecule’s dielectric constant is greater than the medium’s, it is positive DEP. If molecule’s dielectric constant is less than the medium’s, it is negative DEP. Dielectric constant of DNA is quite large relative to water at low frequency, but it is close or small at high frequency (~100 kHz) [30]. At low frequency (<2 kHz), DNA was manipulated by positive DEP [31]. However, DNA exhibited negative dieletrophoretic behavior at 1 MHz [10, 11, 32]. Although DNA always has surface charge and the electrophoresis force may affect DNA’s stretch, at high frequency the surface charge does not have enough time to follow the change in sign of the AC electric field [33]. Therefore, we assume such electrophoretic force is negligible in our work. In our experimental setup, λ DNA are stretched from a strong electric field gradient region (negative dielectrophoresis) at 1 MHz. From Eq. (3), the DEP force increases as the magnitude of the electric field gradient increases. However, too much electrical voltage causes Joule heating and bubble generation around the electrodes. To minimize these problems, the solution conductivity should be low and geometry of the electrode should be optimized [14, 34].
3.2 Bubble generation
Applying an AC voltage between the tip and the bottom electrode can generate bubbles at low frequency or in highly concentrated ionic solution. This bubble generation problem also depends on the geometry of the electrodes. Most bubbles generated in these experiments were at the bottom electrode. We tested two geometries at the end of the bottom electrode. One was a hemi-spherically shaped Au-coated brass rod as shown in figure 1(b). The other was made by gluing a flat piece of Au-coated glass on a brass rod with silver epoxy. The hemi-spherical shaped electrode produced bubbles around 100 kHz at 30 Vpp in 2× diluted TAE buffer when a tip was 20 µm away from the bottom electrode. However, the flat electrode did not produce bubbles even at 1 kHz with all other conditions the same. Therefore, we used the flat electrode at the following DNA stretching experiments.
3.3 DEP λ DNA stretching
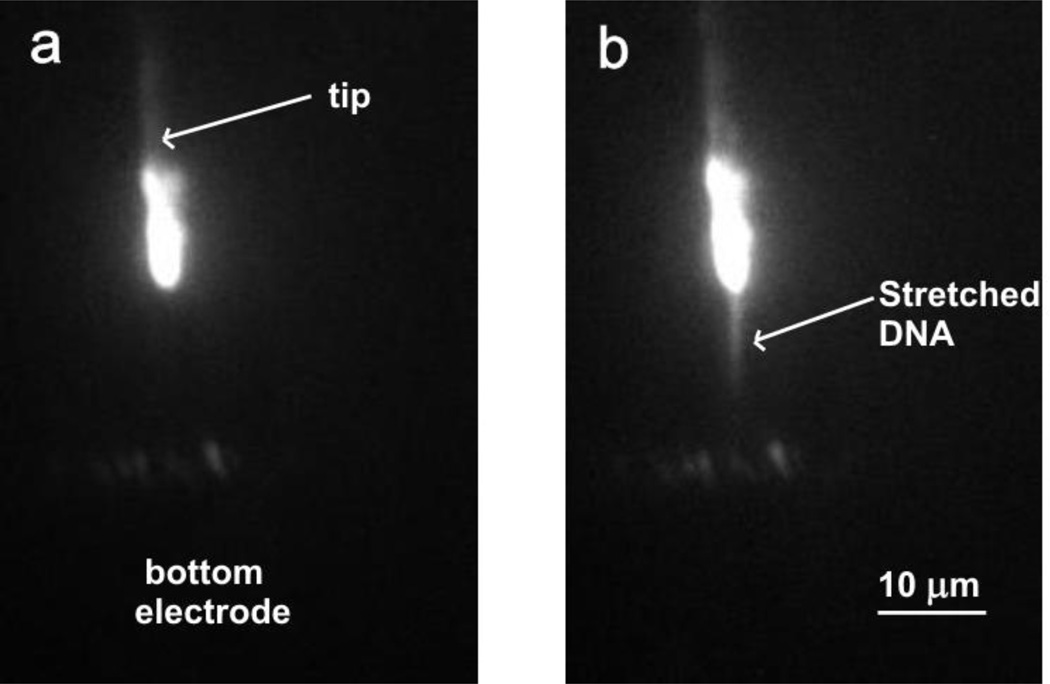
If there is a weak electric field gradient generated by 30 Vpp voltage between electrodes in 2× diluted TAE buffer, λ DNA are still at coiled state as shown in Fig. 3(a). The fluorescent image of a tip in Fig. 3(a) also shows where DNA was immobilized on the tip. Fig. 3(a) also shows that a small amount of λ DNA stuck to the bottom electrode surface below the tip. Most likely some immobilized DNA on a tip were detached from the tip by strong DEP force in the experiment, and adhered to the bottom electrode, causing fluorescence background from the bottom metal electrode. According to Eq (3), a higher magnitude electric field gradient allows the DEP force to stretch DNA from its coiled state. Fig. 3(b) shows stretched λ DNA when the applied voltage is 37 Vpp at 1 MHz. To find the best frequency for stretching λ DNA in our setup, we varied the AC field frequency from 1 kHz to 1 MHz. Our experimental setup showed the best DNA stretching without bubble generation was at 1 MHz as shown in Fig. 3(b). Therefore, all DNA stretching experiments were performed at 1 MHz in this report.
Figure 3.
(a) Fluorescent image of a tip and bottom electrode when applied voltage is 30 Vpp at 1 MHz in 2× diluted TAE buffer. (b) DNA stretching image at the applied voltage of 37 Vpp.
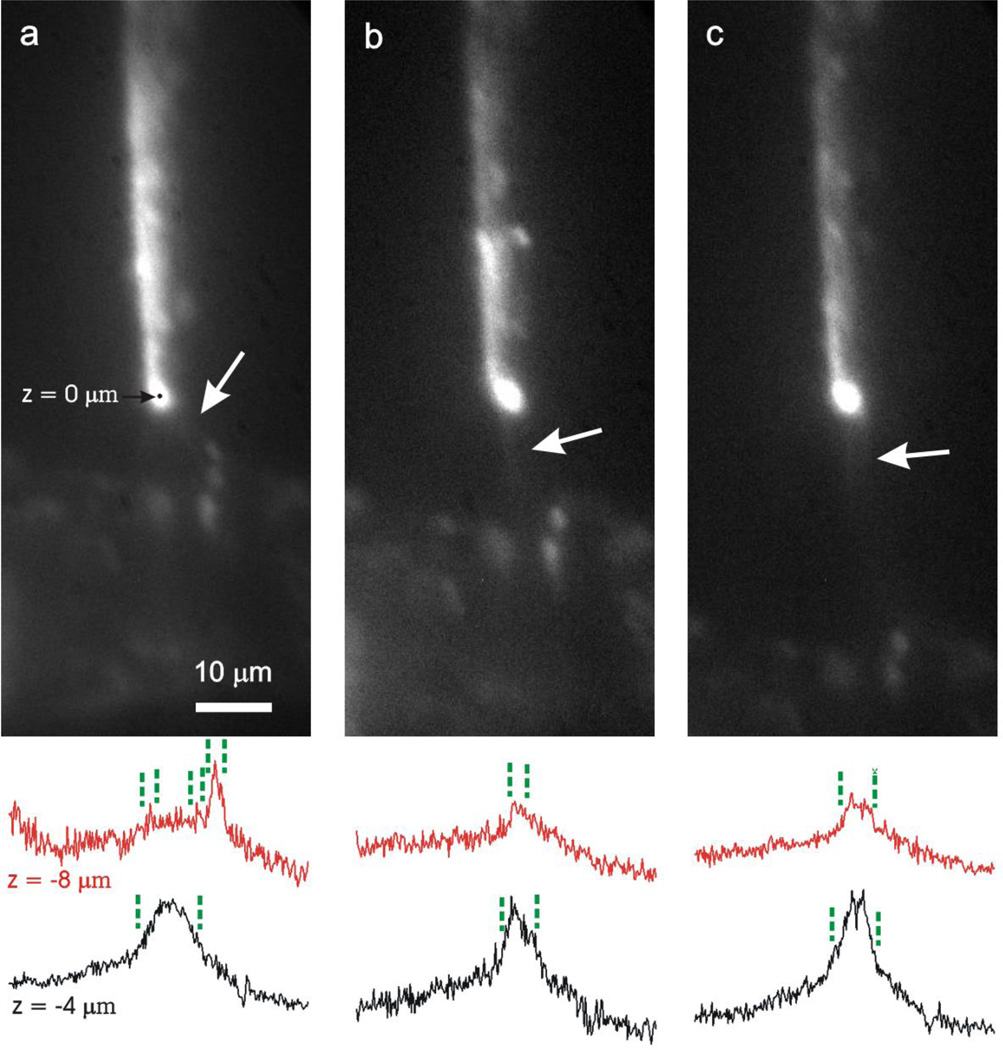
The gap distance between the tip and the bottom electrode also affects the DEP force and therefore DNA stretching. The short gap distance needs smaller voltages between the two electrodes for stretching λ DNA. In Fig. 4(a), at the gap distance of 9 µm, only 23.4 Vpp was required to stretch λ DNA in 2× diluted TAE buffer. The DNA stretching voltage increased to 33.3, 35.7, 45.4 Vpp when the gap distance was 15, 30, 50 µm respectively. However, the shortest gap geometry (9 µm) made the DNA molecules stretched in a solid angle along the electric field gradient rather than in the shortest path from the tip to the bottom electrode. In our setup, a gap of about 15 µm is an optimal distance for DNA stretching. At this gap distance, we observed the tightest bundle of λ DNA stretching from the tip to the bottom electrode according to the fluorescence images as well as the cross-sectional plots of fluorescence intensity (Fig. 4). At longer gap distances (30 µm and 50 µm), DNA molecules stretch diffusely as shown in Fig. 4(c). Brightness and contrast of each fluorescence image was optimized to visualize DNA, so there was variability in the fluorescence intensity. The longer gap distances make DNA molecules more vulnerable to Brownian motion, the solution’s convective flow, temperature rise and temperature gradient in the solution due to Joule heating. When an electric voltage (V) is applied across a resistor (R), the power dissipation of the resistance medium is V2/R. A longer gap distance requires more voltage for DNA stretching; this could cause more Joule heating at longer gap distance since the power dissipation increases quadratically with the applied voltage but decreases linearly with the gap distance.
Figure 4.
Fluorescent images of λ DNA stretching with a gap distance of 9 µm (a), 15 µm (b), and 30 µm (c) in 2× diluted TAE buffer and selected cross-sectional plots of fluorescence intensity at z = −4 µm and −8 µm. White arrows indicate stretched DNA. The applied AC voltage is 23.4 Vpp(a), 33.3 Vpp(b), and 41.1 Vpp(c).
3.4 Simulation
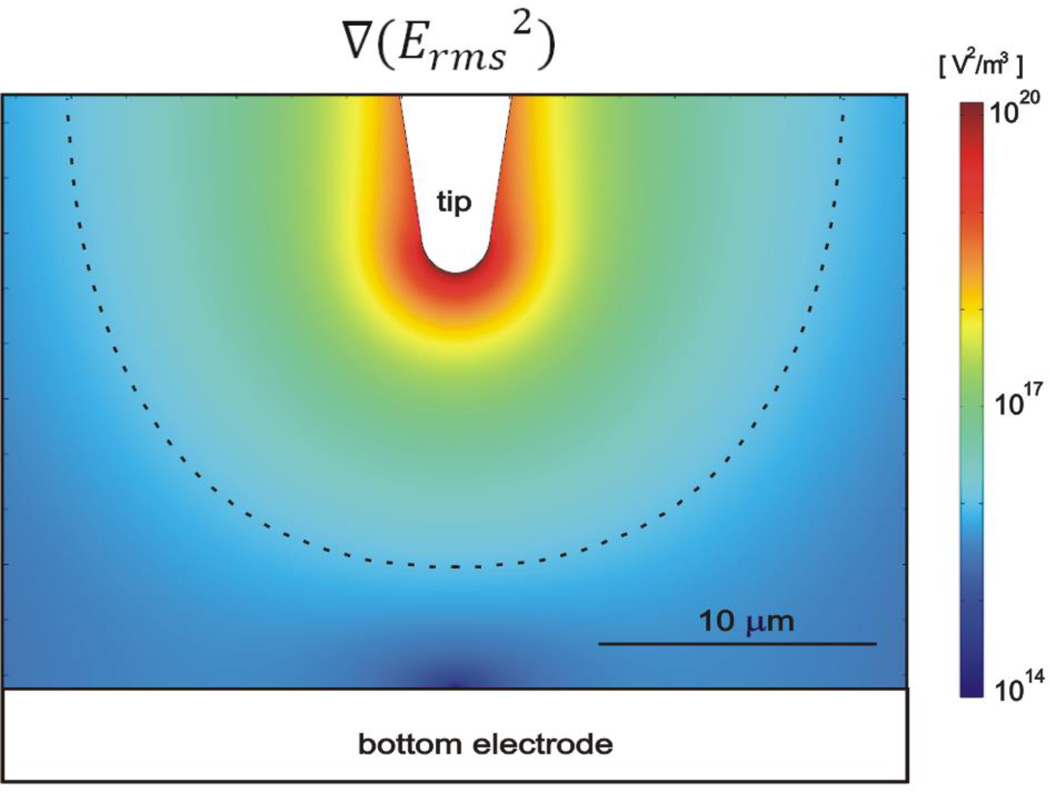
Using magnetic tweezers and optical tweezers, the λ DNA stretching experiment had been studied by other researchers previously [4, 6]. From these studies, 10 pN are required to stretch a single λ DNA molecule completely. However, in order to calculate DEP force, we need to know both field gradient and DNA’s polarizability from Eq (3). DNA’s polarizability has been reported by other groups [35, 36]. The electrical field gradient cannot be easily calculated analytically, but it can be simulated using a finite element analysis software (COMSOL, Multiphysics) as shown in Fig. 5. We simulated electric field gradient with the same experimental conditions shown in Fig. 4(b) with 2× diluted TAE buffer (conductivity = 0.1 S/m) and a gap distance of 15 µm. A flat shaped bottom electrode described earlier was used in the simulation. The simulation was done in 3D, but only a cross-sectional view is shown in Fig. 5 since all geometries have cylindrical symmetry. The Fig. 5 presents the value of ∇(Erms2). Fig. The dashed line in Fig. 5 corresponds to the value of 1016 V2/m3. If we estimate DNA’s polarizability [36] per base pair at 1 MHz as 1×10⁻³⁴ Fm2, the dashed line corresponds to the DEP stretching force of ~0.1 pN.
Figure 5.
Contour plots of the gradient of the electric field square. The tip-electrode gap distance is 15 µm. The DEP force is the maximum at the tip, and the dashed line corresponds to the value of 1016 V2/m3.
3.5 Joule heating effects measured by tuning fork sensor
The DEP force needed to manipulate and to stretch DNA molecules requires relatively high electrical voltage. However, a high voltage causes Joule heating. The power dissipation raises the fluid’s temperature around the electrodes. The temperature rise (ΔT) due to the Joule heating can be estimated as ΔT ~ σVrms2/k, where σ is the electric conductivity of the medium, Vrms is the root mean square of the applied voltage, and k is the thermal conductivity of the solution [34]. In the case of σ= 0.2 S/m, Vrms =14.1 V, and kwater = 0.6 Jm−1s−1K−1 [37]. the temperature rise is estimated to be ΔT =66 °C. We assume that a real temperature rise will be less than 66 °C since our experimental set up has only one heating source enclosed by the solution in the chamber compared to Dalir et al [34]. When the solution’s temperature rises, the solution’s viscosity will decrease. Therefore an increase in the tuning fork’s vibration amplitude is expected.
Due to the ~10 µm short gap distance between the tip and the bottom electrode, we were not able to measure the solution temperature rise and the temperature gradient around the tip and DNA molecules. It has been reported that Joule heating in solution could be measured by using temperature-dependent fluorescent intensity of dye [38]. But this method requires a single dye to determine Joule heating in the region immediately adjacent to a tip, and our fluorescent imaging system does not have the high resolution to measure it. However, at the solution condition used in this work, the λ DNA should remain double stranded when the solution temperature was less than 80°C. In addition, we performed a series control experiments without DNA attached to the tip at the same experimental conditions to characterize the Joule heating effects on the measurements as described next.
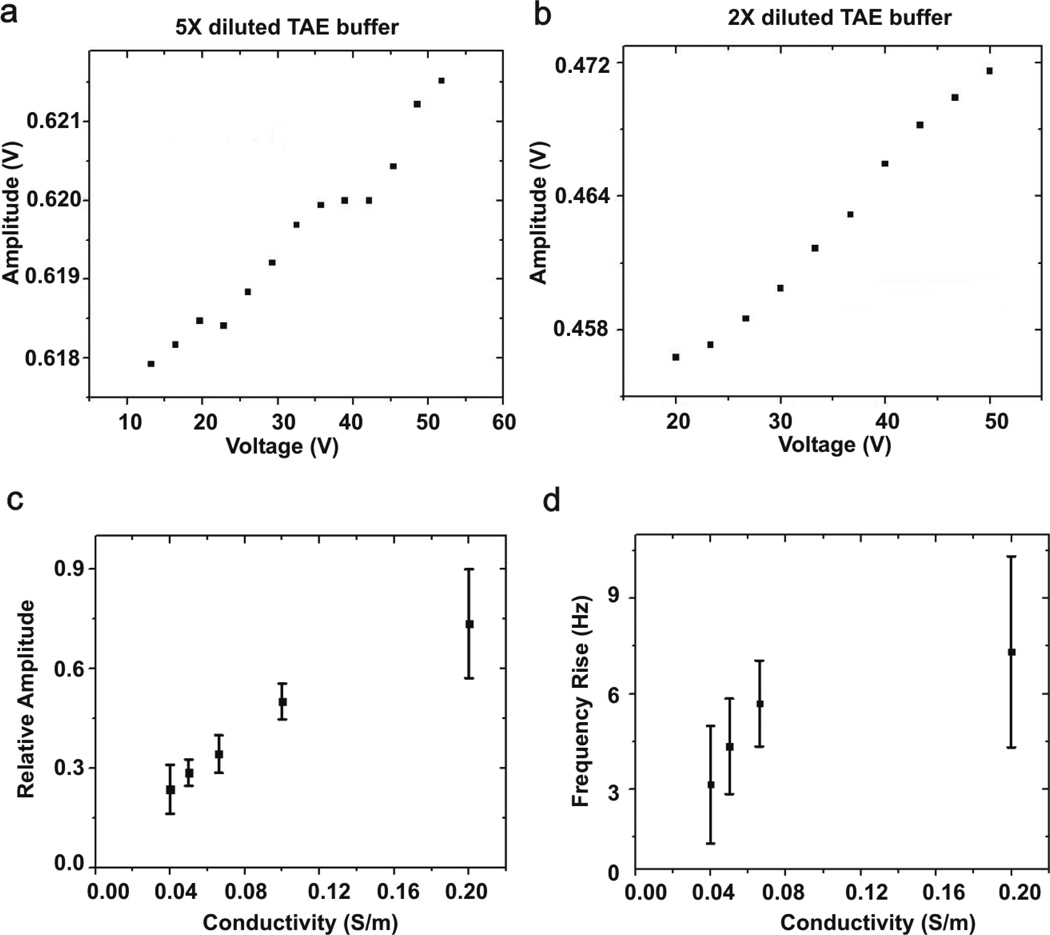
The tuning fork’s resonance frequency and amplitude increase when a tip, which is attached to one prong of the tuning fork, is inside a liquid when the liquid is less viscous and denser when its temperature rises [39]. We measured the tuning fork’s resonance frequency and amplitude increase due to the decrease in solution viscosity due to Joule heating. The tuning fork’s amplitude increases linearly when we ramp up the applied voltage (Fig.6a and 6b). To monitor how much solution’s conductivity affects Joule heating, we set the gap distance between the tip electrode and the bottom electrode as 15 µm, and a tip’s insertion depth as ~ 1.5mm; only the fiber tip was immersed in the solution. We then varied the solution conductivity as 0.04 S/m, 0.05 S/m, 0.067 S/m, 0.1 S/m and 0.2 S/m and the relative changes in amplitude and frequency of the tuning fork were measured. Figure 6(c) shows relative amplitude, which is calculated from the following formula (A45V−A0V)/A0V where A45V and A0V are tuning fork’s amplitude at 45V and 0V around a resonant frequency, increases as the solution conductivities are higher. Figure 6(d) represents more frequency increases of the sensor’s resonant frequency from the original 34,391 Hz at higher solution conductivities.
Figure 6.
Joule heating effects without DNA attachment. Tuning fork’s amplitude vs. applied voltage in (a) 5× diluted TAE buffer (σ=0.04 S/m) and (b) 2× diluted TAE buffer (σ=0.1 S/m). The tuning fork’s amplitude increases linearly with the applied voltage. Relative amplitude change (c) and frequency rise (b) of tuning fork when the fluid’s conductivity varies from 0.04 S/m to 0.2 S/m. The tip-bottom electrode gap distance is 15 µm. The relative amplitude is (A45V−A0V)/A0V, where A45V is tuning fork’s amplitude at 45 Vpp, and A0V is amplitude at 0 Vpp. Both the amplitude (c) and frequency (d) increases as medium’s conductivity increases.
3.6 Measurement of DNA stretching by tuning fork sensor
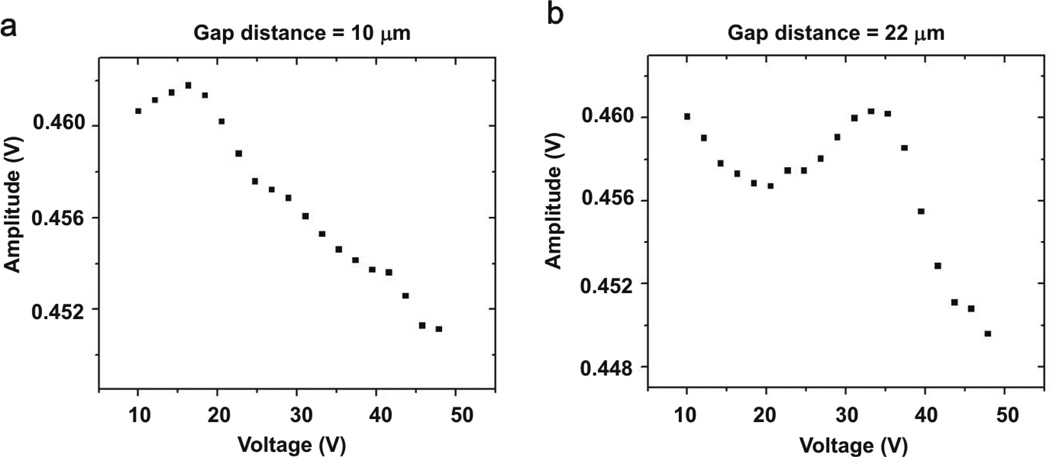
The Joule heating effects described above on the tuning fork sensor indicate that a low conductive solution (σ= 0.04 S/m) is a better condition for measuring the DEP force using a tuning fork. The experimental procedure can be described briefly as following. We put a gold coated tip on the tuning fork and attached λ DNA to the tip in the same way described in the earlier section. In this experiment, a blunt end tip was used to attach several hundreds of λ DNA molecules on the tip. The piezo’s driving amplitude was 40 mVrms, and pre-amplification was 1000. Five times diluted TAE buffer was used (σ= 0.04 S/m for the 5× diluted TAE). We first set the tip-bottom electrode distance as 10 µm, and tip’s insertion depth as ~1.5 mm. The tuning fork’s vibration amplitude at resonant frequency while increasing the electrical voltage between the two electrodes as shown in Figure 7(a). We then increased the tip-bottom electrode distance to 22 µm and repeated the same measurements and the results are shown in Figure 7(b). The Joule heating effects are subtracted in Figure 7 since tuning fork’s amplitude increases linearly according to Figure 6(a)–(b). At the shorter gap distance of 10 µm, the sensor’s oscillation amplitude starts to decrease around 17 Vpp; this indicates that λ DNA molecules started to be stretched by the DEP force at around 17 Vpp. At the longer gap distance of 22 µm, the onset of amplitude’s decrease was 36 Vpp. We expected that the DNA-stretching start voltage would increase as the gap distance increased as the electric field strength E=Vpp/dgap = 36Vpp/22 ≈17Vpp /10µm were approximately the same, and this trend was consistent with our observations shown in Figure 4. When DNA molecules were stretched from a tip by a DEP force in solution, the stretched DNA molecules moving in solution would increase the frictional force on the DNA. Therefore the vibration amplitude would be reduced as the applied voltage increased when DNA molecules were stretched in Figure 7. According to our force calibration, the normal exerting force vs. tuning fork’s vibration amplitude reduction was 870 nN/V, so 0.015 V change from the original 0.460 V at 36 Vpp to 0.445 V at 48 Vpp of the tip’s amplitude in Fig. 7(b) is estimated to 13 nN of stretching force.
Figure 7.
Tuning fork’s amplitude vs. applied ac voltage with immobilized DNA. The Joule heating effects are subtracted in the amplitudes. The gap distance changes from 10 µm (a) to 22 µm (b) in 5× diluted TAE buffer. At the shorter gap distance, the amplitude starts to decrease around 17 Vpp. At the longer gap distance, the amplitude decreases from 36 Vpp.
Our computer simulation predicted the DEP force at the level of ~10 pN for one DNA, but the actual measurement was about ~10nN. Most likely this was caused by that there could have many DNA molecules attached to the tip as observed from the fluorescence images, so the measured force was multiplied by the number of the attached DNA molecules.
4. Conclusions
In this work we have demonstrated that λ DNA molecules immobilized on a gold coated fiber tip can be stretched using a dielectrophoretic force applied by an AC voltage between the tip and a bottom electrode. Experimental results and computer simulation show that the optimal gap distance between the tip and a bottom electrode is ~15 µm. A highly conductive solution causes Joule heating and temperature rise in solution, and they must be considered in interpreting the results. We measured this DEP Joule heating effect using a tuning fork sensor that is sensitive to thermally induced viscosity change in solution. This work also has demonstrated that a force sensing probe tip can detect the dielectrophoretic force directly. The combination of DEP DNA stretching and SPM technique provide a useful tool to manipulate and control DNA molecules for studying DNA’s properties and functions. As a result, Our group has already developed a SPM working with a solid-state nanopore system in order to control DNA translocation speed through a nanopore by immobilizing DNA on a SPM tip [3, 40].
Supplementary Material
Acknowledgement
Scanning electron microscope work was supported by the Electron Optical Facility at the University of Arkansas. The authors give special thanks to Ryan Rollings for discussion during experiments and paper preparation and to Prof. Jeffrey Silberman for his support of using sputter coater. This work was supported by the NIH (R21HG004776) and ABI-1114.
References
- 1.Marko JF, Siggia ED. Stretching DNA. Macromolecules. 1995;28:8759–8770. [Google Scholar]
- 2.Clarke J, Wu H, Jayasinghe L, Patel A, Reid S, Bayley H. Single nucleotide discrimination in immobilized DNA oligonucleotides with a biological nanopore. Proc. Natl. Acad. Sci. USA. 2009;106:7702–7707. doi: 10.1073/pnas.0901054106. [DOI] [PMC free article] [PubMed] [Google Scholar]
- 3.Hyun C, Kaur H, Rollings R, Xiao M, Li J. Threading Immobilized DNA Molecules through a Solid-State Nanopore at >100 µs per Base Rate. Acs nano. 2013;7:5892–5900. doi: 10.1021/nn4012434. [DOI] [PMC free article] [PubMed] [Google Scholar]
- 4.Wang MD, Yin H, Landick R, Gelles J, Block SM. Stretching DNA with Optical Tweezers. Biophys. J. 1997;72:1335–1346. doi: 10.1016/S0006-3495(97)78780-0. [DOI] [PMC free article] [PubMed] [Google Scholar]
- 5.Keyser UF, Koeleman BN, Dorp Sv, Krapf D, Smeets RM, Lemay SG, Dekker NH, Dekker C. Direct force measurements on DNA in a solid-state nanopore. Nature Physics. 2006;2:473–477. [Google Scholar]
- 6.Smith SB, Finzi L, Bustamante C. Direct Mechanical Measurements of the Elasticity of Single DNA Molecules by Using Magnetic Beads. Science. 1992;258:1122–1126. doi: 10.1126/science.1439819. [DOI] [PubMed] [Google Scholar]
- 7.Bustamante C, Smith SB, Liphard J, Smith D. Single-molecule studies of DNA mechanics. Current Opinion in Structural Biology. 2000;10:279–285. doi: 10.1016/s0959-440x(00)00085-3. [DOI] [PubMed] [Google Scholar]
- 8.Schroeder CM, Blainey PC, Kim S, Xie XS. In: Single-Molecule Techniques: A Laboratory Manual. Selvin PR, Ha T, editors. New York: Cold Spring Harbor; 2008. pp. 461–492. [Google Scholar]
- 9.Ferree S, Blanch HW. Electrokinetic Stretching of Tethered DNA. Biophys. J. 2003;85:2539–2546. doi: 10.1016/s0006-3495(03)74676-1. [DOI] [PMC free article] [PubMed] [Google Scholar]
- 10.Namasivayam V, Larson RG, Burke DT, Burns MA. Electrostretching DNA Molecules Using Polymer-Enhanced Media within Microfabricated Devices. Anal. Chem. 2002;74:3378–3385. doi: 10.1021/ac025551h. [DOI] [PubMed] [Google Scholar]
- 11.Dukkipati VR, Pang SW. Precise DNA placement and stretching in electrode gaps using electric fields in a microfluidic system. Appl. Phys. Lett. 2007;90:083901. [Google Scholar]
- 12.Pohl HA. Dielectrophoresis: The behavior of neutral matter in nonuniform electric fields. Cambridge: Cambridge University Press; 1978. [Google Scholar]
- 13.Chou C-F, Tegenfeldt JO, Bakajin O, Chan SS, Cox EC, Darnton N, Duke T, Austin RH. Electrodeless Dielectrophoresis of Single- and Double-Stranded DNA. Biophys. J. 2002;83:2170–2179. doi: 10.1016/S0006-3495(02)73977-5. [DOI] [PMC free article] [PubMed] [Google Scholar]
- 14.Sung KE, Burns MA. Optimization of Dielectrophoretic DNA Stretching in Microfabricated Device. Anal. Chem. 2006;78:2939–2947. doi: 10.1021/ac051662f. [DOI] [PMC free article] [PubMed] [Google Scholar]
- 15.Dukkipati VR, Pang SW. The immobilization of DNA molecules to electrodes in confined channels at physiological PH. Nanotechnology. 2008;19:465102. doi: 10.1088/0957-4484/19/46/465102. [DOI] [PubMed] [Google Scholar]
- 16.Binnig G, Quate CF, Gerber C. Atomic Force Microscope. Phys. Rev. Lett. 1986;56:930–933. doi: 10.1103/PhysRevLett.56.930. [DOI] [PubMed] [Google Scholar]
- 17.Li J, Coleman WJ, Youvan DC, Gunner MR. Characterization of a symmetrized mutant RC with 42 residues from the QA site replacing residues in the QB site. Photosynth. Res. 2000;64:41–52. doi: 10.1023/A:1026531925602. [DOI] [PubMed] [Google Scholar]
- 18.Florin E-L, Rief M, Lehmann H, Ludwig M, Dornmair C, Moy VT, Gaub HE. Sensing specific molecular interactioins with the atomic force microscope. Biosens. Bioelectron. 1995;10:895–901. [Google Scholar]
- 19.Kim JS, Jung YJ, Park JW, Shaller AD, Wan W, Li ADQ. Mechanically Stretching Folded Nano-pi-stacks Reveals Pico-Newton Attractive Froces. Adv. Mater. 2008;20:1–4. [Google Scholar]
- 20.Keyser UF, Does Jvd, Dekker C, Dekker NH. In: Micro and Nano Technologies in Bioanalysis: Methods and Protocols. Lee JW, Foote RS, editors. New York: Humana Press; 2009. pp. 95–112. [Google Scholar]
- 21.Grober RD, Acimovic J, Schuck J, Hessman D, Kindlemann PJ, Karrai K, Tiemann I, Manus S. Fundamental limits to force detection using quartz tuning forks. Rev. Sci. Instrum. 2000;71:2776–2780. [Google Scholar]
- 22.Friedt JM, Barry E. Introduction to the quartz tuning fork. Am. J. Phys. 2007;75:415–422. [Google Scholar]
- 23.Edwards H, Taylor L, Duncan W, Melmed AJ. Fast low-cost phase detection setup for tapping-mode atomic force microscopy. Rev. Sci. Instrum. 1997;70:3614–3619. [Google Scholar]
- 24.King GM, Lamb JS, G Nunes J. Quartz tuning forks as sensors for attractive-mode force microscopy under ambient conditions. appl. Phys. Lett. 2001;79:1712–1714. [Google Scholar]
- 25.Jahncke CL, Brandt O, Fellows KE, Hallen HD. Choosing a preamplifier for tuning fork signal detection in scanning force microscopy. Rev. Sci. Instrum. 2004;75:2759–2761. [Google Scholar]
- 26.Sirimulla S, Lerma M, Herndon WC. Prediction of Partial Molar Volumes of Amino Acids and Small Peptides: Counting Atoms versus Topological Indices. J. Chem. Inf. Model. 2010;50:194–204. doi: 10.1021/ci900318c. [DOI] [PubMed] [Google Scholar]
- 27.Zamyatnin AA. AMINO ACID, PEPTIDE, AND PROTEIN VOLUME IN SOLUTION. Ann. Rev. Biophys. Bioeng. 1984;13:145–165. doi: 10.1146/annurev.bb.13.060184.001045. [DOI] [PubMed] [Google Scholar]
- 28.Li J, Gilroy D, Tiede DM, Gunner MR. Kinetic Phases in the Electron Transfer from P+QA−QB to P+QAQB− and the Associated Processes in Rhodobacter sphaeroides R-26 Reaction Centers. Biochemistry. 1998;37:2818–2829. doi: 10.1021/bi971699x. [DOI] [PubMed] [Google Scholar]
- 29.Jones TB. Electromechanics of particles. New York: Cambridge University Press; 1995. [Google Scholar]
- 30.Takashima S. Study of Helix-Coil Transition of DNA by Dielectric Constant Measurement. Biopolymers. 1966;4:663–676. doi: 10.1002/bip.1966.360040606. [DOI] [PubMed] [Google Scholar]
- 31.Asbury CL, Diercks AH, Engh Gvd. Trapping of DNA by dielectrophoresis. Electrophoresis. 2002;23:2658–2666. doi: 10.1002/1522-2683(200208)23:16<2658::AID-ELPS2658>3.0.CO;2-O. [DOI] [PubMed] [Google Scholar]
- 32.Washizu M, Kurosawa O. Electrostatic Manipulation of DNA in Microfabricated Structures. IEEE TRANSACTIONS ON INDUSTRY APPLICATIONS. 1990;26:1165–1172. [Google Scholar]
- 33.Velev OD, Gangwala S, Petsev DN. Annu. Rep. Prog. Chem. Sect C. 2009;105:213–246. [Google Scholar]
- 34.Dalir H, Yanagida Y, Hatsuzawa T. Probing DNA mechanical characteristics by dielectrophoresis. Sens. Actuators, B. 2009;136:472–478. [Google Scholar]
- 35.Bakewell DJ, Morgan H. Dielectrophoresis of DNA: Time- and Frequency-Dependent Collections on Microelectrodes. IEEE Trans. NanoBiosci. 2006;5:1–8. [PubMed] [Google Scholar]
- 36.Tuukkanen S, Toppari JJ, Kuzyk A, Hirviniemi L, Hytonen VP, Ihalainen T, Torma P. Carbon Nanotubes as Electrodes for Dielectrophoresis of DNA. Nano. Lett. 2006;6:1339–1343. doi: 10.1021/nl060771m. [DOI] [PubMed] [Google Scholar]
- 37.Haynes WM. Handbook of Chemistry and Physics. Boca Raton: CRC Press; 2011. [Google Scholar]
- 38.Williams SJ, Chamarthy P, Wereley ST. Comparison of Experiments and Simulation of Joule Heating in ac Electrokinetic Chips. J. of Fluids Engineering. 2010;132:021103. [Google Scholar]
- 39.Zhang J, Dai C, Su X, O'Shea SJ. Determination of liquid density with a low frequency mechanical sensor based on quartz tuning fork. Sens. Actuators, B. 2002;84:123–128. [Google Scholar]
- 40.Hyun C, Rollings R, Li J. Probing access resistance of solid-state nanopores with a scanning probe microscope tip. Small. 2012;8:385–392. doi: 10.1002/smll.201101337. [DOI] [PMC free article] [PubMed] [Google Scholar]
Associated Data
This section collects any data citations, data availability statements, or supplementary materials included in this article.


