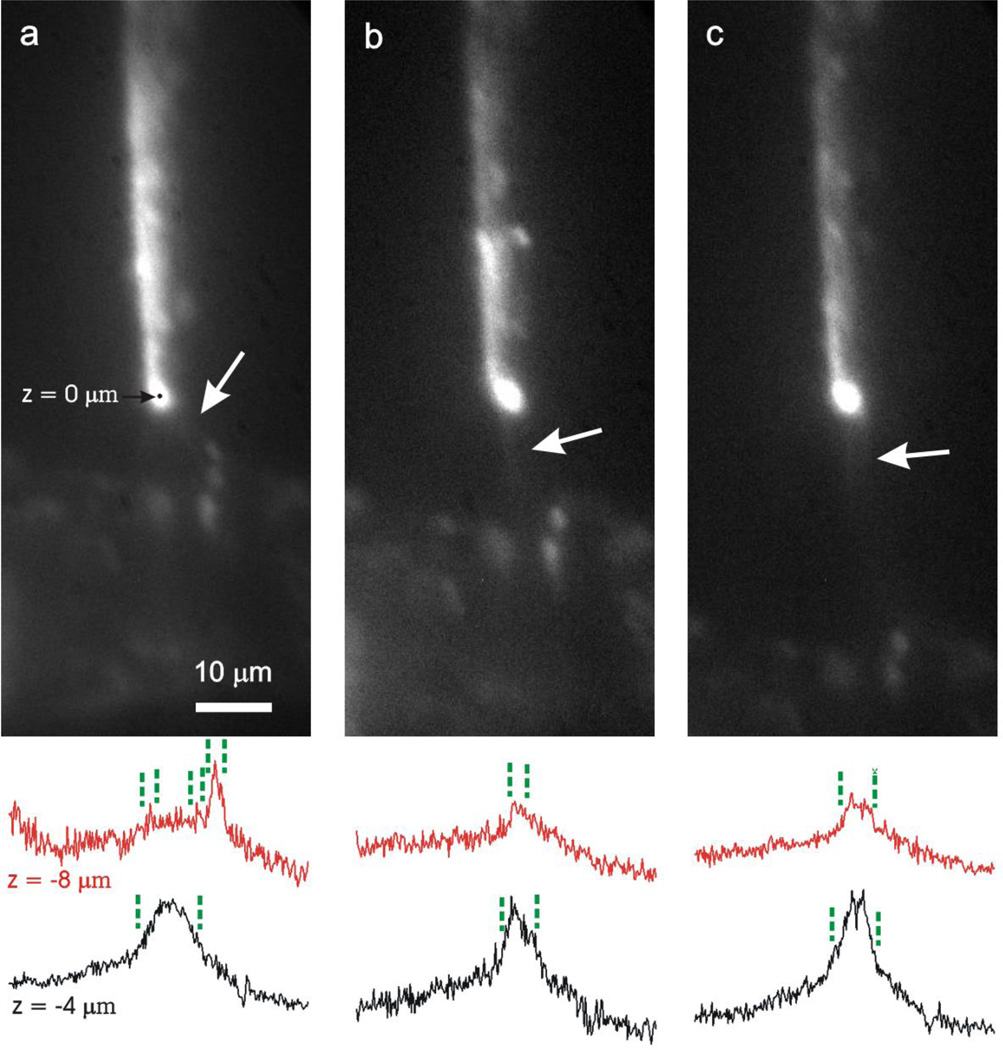
Figure 4.
Fluorescent images of λ DNA stretching with a gap distance of 9 µm (a), 15 µm (b), and 30 µm (c) in 2× diluted TAE buffer and selected cross-sectional plots of fluorescence intensity at z = −4 µm and −8 µm. White arrows indicate stretched DNA. The applied AC voltage is 23.4 Vpp(a), 33.3 Vpp(b), and 41.1 Vpp(c).

