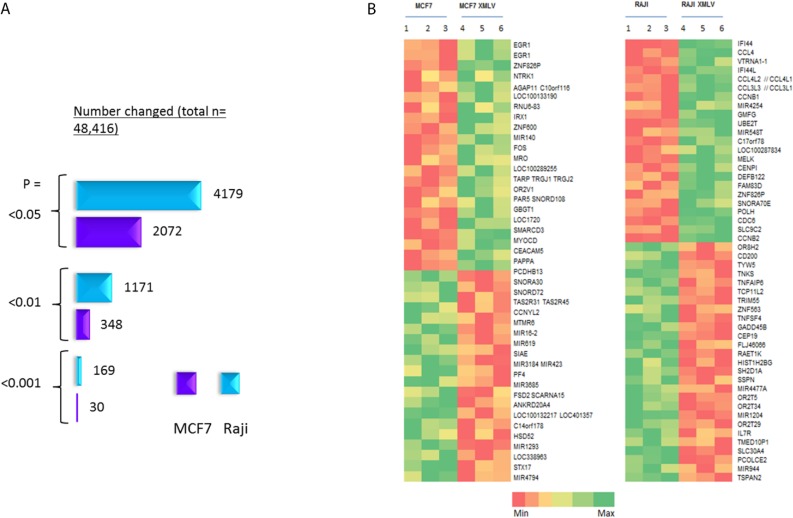
Figure 4.
Gene expression microarray analysis (Affymetrix HuGene 2.0ST) of XMLV infected MCF7 and Raji cells. (A) Number of changed probe sets at different P value cut-offs; (B) Heat map of the most highly up- and down-regulated genes in XMLV-infected MCF and Raji cells, based on a p = <0.05 and fold change >1.5 cut-off.

