

Abstract
Findings from clinical and preclinical studies converge to suggest that increased adiposity and/or exposure to a high fat diet are associated with alterations in dorsal striatal (DS) circuitry. In humans there is a reliable inverse relationship between body mass index (BMI) and response to palatable food consumption in the dorsal striatum (DS). Positron emission tomography (PET) studies also suggest altered DS dopamine type 2/3 receptor (D2R/D3R) availability in obesity; however, the direction of the association is unclear. It is also not clear whether dopamine receptor levels contribute to the lower blood oxygen level dependent (BOLD) response because PET studies have targeted the morbidly obese and, functional magnetic resonance imaging (fMRI) studies rarely include individuals with BMIs in this range. Therefore we examined whether the fMRI BOLD response in the DS to milkshake is associated with D2R/D3R availability measured with [11C]PHNO and PET in individuals with BMI ranging from healthy weight to moderately obese. Twenty-nine subjects participated in the fMRI study, twelve in the [11C]PHNO PET study, eight of whom also completed the fMRI study. As predicted there was a significant negative association between DS BOLD response to milkshake and BMI. In contrast, BMI was positively associated with D2R/D3R availability. Dorsal striatal BOLD response was unrelated to D2R/D3R availability. Considered in the context of the larger literature our results suggest the existence of a non-linear relationship between D2R/D3R availability and BMI. Additionally, the altered BOLD responses to palatable food consumption observed in obesity are not clearly related to D2R/D3R receptor availability.
Keywords: [11C]-(+)-PHNO, PET, BMI, BOLD, fMRI, human, dopamine D2/3 receptor
INTRODUCTION
There is a general consensus that the obesity epidemic results from the combination of a vulnerable brain in an unhealthy environment. As such, identification of ways in which brain functions interact with environmental variables has been a major theme of obesity research. One of the most consistent findings to emerge from the neuroimaging literature is a reliable negative association between body mass index (BMI) and the blood oxygen level dependent (BOLD) response to palatable food consumption in the dorsal striatum (DS) (1–6). This association appears to be a consequence, rather than a cause of initial obesity, since reduced responses are associated with gaining weight(6) but not with risk for developing obesity in lean youth (7). Critically, DS BOLD response to milkshake has recently been reported to be inversely related to a self-report measure of impulsivity in overweight but not lean individuals (1). This raises the possibility that adiposity- or diet-induced changes in DS may result in increased impulsivity, which could increase risk for weight gain (1). It is therefore of significant interest to determine the mechanism supporting the DS BMI-BOLD association.
One possibility, supported by preclinical and clinical studies, is that D2R density may contribute to lower DS BOLD responses (4, 7–13). First, the relationship between BOLD DS response and BMI is stronger in individuals who posses a copy of the A1 allele of the Taq1A A1 polymorphism, which links the BOLD response to D2R because A1 carriers have lower D2R density (4). Second, in rodents, weight gain is associated with down regulation (9, 14) and weight loss with up regulation of D2R expression (15). Moreover, a biological reduction in D2Rs, by lentivirus-mediated knockdown, increased the development of compulsive food seeking in rats with access to high fat palatable food (16). This latter finding supports an association between D2R and BOLD because BOLD response in the caudate to milkshake has been associated with impulsivity in overweight/obese individuals, which like compulsive responding is an example of increased non-goal directed behavior (1).
In humans the relationship between D2R/D3R and obesity is less clear. Wang and colleagues first reported lower D2R/D3R receptor availability measured with [11C]raclopride and positron emission tomography (PET) in a group of morbidly obese individuals (BMI > 40) compared to individuals ranging in BMI from 21–28. For reference, a BMI > 40 is defined as morbidly obese, > 30 is obese, >25 is overweight, 18.5–25 is healthy, and <18.5 is underweight. This effect was replicated using [123I]IBZM SPECT(17) but not (N-[11C]methyl)benperidol PET (18). Contradictory findings are also present in studies of weight change and D2R/D3R density in humans. One study reported D2R expression, roughly proportional to weight loss post vs. pre bariatric surgery (19) while a second reported the opposite finding with an 8–10% decrease in D2R expression (20). In addition to contradictory results, studies have been mostly limited to the morbidly obese. In fact, the Wang study failed to observe an inverse relationship between BMI and D2R/D3R density in the control group, which included overweight individuals (13). This is an important consideration because there is evidence that DA related functions, such as reward sensitivity, have a non-linear relationship with BMI(21). Moreover, due to the constraints imposed by the bore size, morbidly obese subjects are rarely included in the fMRI studies of food reward. Rather, average BMI’s in the higher BMI groups tend to range from overweight to mildly obese. The lack of studies relating D2R/D3R to healthy and moderately elevated BMI not only represents a significant gap in the literature but also opens the possibility that lower BOLD responses may result from either higher or lower D2R density. To address this gap we examined the relationship in the DS between the BOLD response to palatable food and D2R/D3R availability in participants ranging from healthy weight to moderately obese.
MATERIALS AND METHODS
Subjects
Thirty-three physically and mentally healthy nonsmokers, aged 26.9 ± 5.9 years (range: 19 to 39 years), participated in the study (Table 1). BMI ranged from 20.8 to 36.5. Height and weight were measured using a Detecto 439 Mechanical Scale (footwear and coats removed) and BMI was calculated [BMI= weight (kg)/height (m) 2]. Eligibility was determined as follows: subjects were examined by a study physician to exclude major medical issues or neurological disorders; electrocardiogram, serum chemistries, thyroid function studies, complete blood count, urinalysis, and urine toxicology screening were performed; the Structured Clinical Interview for Diagnostic and Statistical Manual of Mental Disorders was administered to rule out Axis I psychiatric disorders. Participants had no history of significant medical illness, major head trauma, or loss of consciousness. Females had negative pregnancy tests at intake and on each PET scan day prior to radiotracer injection. All subjects gave written informed consent to participate in our study that was approved by Yale University School of Medicine Human Investigation Committee.
A subset of twenty-nine subjects participated in an fMRI paradigm in which neural response to milkshake was measured. Data from twenty-three of these subjects was reported previously in a study examining brain responses to milkshake that predict subsequent milkshake intake (22), and data from six subjects was reported in a study describing the relationship between DS response to milkshake and impulsivity (1). The two studies used a nearly identical paradigm to that in the current study. We measured [11C]PHNO binding potential (BPND) in twelve out of thirty-three subjects. Eight subjects participated in both [11C]PHNO PET and fMRI.
Positron Emission Tomography (PET) Study
PET Data Acquisition
[11C]PHNO was prepared as previously described (23). The specific activity at the end of synthesis was 3.2 ± 1.2 mCi/nmol. Each participant had one [11C]PHNO PET scan at the Yale PET Center on the High Resolution Research Tomograph (HRRT) (Siemens/CTI, Knoxville, TN, USA). An initial 6-min transmission scan using an orbiting 137Cs point-source was acquired prior to radiotracer injection for attenuation correction. One venous catheter in the forearm antecubital vein was established for administration of [11C]PHNO. The injected dose for the test scan was 15.1 ± 4.8 mCi with a mass of 0.043 ± 0.020 μg/kg. For the radiotracer injection, [11C]PHNO was diluted with sterile saline solution and delivered as a bolus (n=9) or bolus plus constant infusion (n=3) (Kbol=80 min) by a syringe pump (Harvard PHD 22/2000, Harvard Apparatus, Holliston, Massachusetts, United States). List mode data were reframed into a dynamic sequence of 33 frames (6 x 30 sec, 3 x 1 min, 2 x 2 min, 22 x 5 min). Dynamic images (207 slices; pixel size = 1.2 mm) were reconstructed using OSEM including an event-by-event motion correction algorithm (MOLAR; Carson IEEE-NSS). The parameters used for motion correction were measured using an optical motion tracking tool fastened to the subjects head via a lycra swim-cap (Vicra, NDI systems, Waterloo, Canada).
PET Image Analysis
Each participant’s summed early PET image (0–10 min) was used for coregistration to the individual subject’s MRI, which was then coregistered to a template MRI (Automated Anatomical Labeling (AAL) template). Decay-corrected time activity curves were generated for region-of-interest (ROI) bilateral dorsal caudate as previously delineated (24).
PET Outcome Measures
Regional [11C] PHNO uptake was quantified as binding potential (BPND), which is proportional to the density of available receptors. BPND was calculated for both bolus and bolus plus constant infusion studies by the simplified reference tissue model (SRTM) (25). The cerebellum was used as a reference region.
Functional Magnetic Resonance Imaging (fMRI) Study: Experiment 1
These methods are described in detail in (22) and reproduced here in brief. Twenty-four out of twenty –nine subjects that participated in the fMRI study, as well as five out of eight subjects participating in both the PET and fMRI study participated in this experiment.
Stimuli and delivery
Stimuli included Nestlé’s chocolate milkshake and a tasteless baseline solution. Liquids were delivered as 1 ml of solution over 4 s using a gustometer system described previously (26). In brief, this system consists of computer controlled syringe pumps connected to an fMRI-compatible custom designed gustatory manifold via 25-foot lengths of beverage tubing (Saint-Gobain Performance Plastics). The manifold is mounted on the headcoil and liquids dripped from the manifold stylus onto the tongue.
Experimental Design
Subjects participated in one fMRI training session and one fMRI scanning session conducted on separate days. Subjects were instructed to arrive feeling neither hungry nor full and to abstain from eating or drinking anything (except water) for 1 h before both sessions.
fMRI Data Acquisition
Stimuli were delivered according to a long event-related design (27, 28). Either a milkshake or a tasteless solution was presented to the subject for 4 s. After a 3–10 s wait, the milkshake was followed by a 4 s tasteless rinse. Before the onset of the next trial, there was a 3–10 s wait. Subjects were instructed to hold the solution in their mouths until they had received the full amount of the liquid and then to swallow during the wait. Subjects participated in two functional runs (22 repeats of each stimulus) and one anatomical scan.
The images were acquired on a Siemens 3 T Trio magnetom scanner at Yale University Magnetic Resonance Research Center, using parameters similar to previous studies. Susceptibility-weighted single-shot echoplanar imaging was used to measure the blood oxygenation-level dependent (BOLD) signal as an indication of cerebral brain activation with TR, 2000 ms; TE, 20 ms; flip angle, 80°; FOV, 220 mm; matrix, 64 × 64; slice thickness, 3 mm; and acquisition of 40 contiguous slices, acquired in an interleaved mode. The MR signal was allowed to equilibrate at the beginning of each functional run over six scans for a total of 12 s, which were then excluded from analysis. A high-resolution T1-weighted three-dimensional anatomical scan was acquired with the following parameters: TR/TE, 2530/3.66 ms; flip angle, 20°; matrix, 256 × 256; 1 mm thick slices; FOV, 256; 176 slices.
Functional Magnetic Resonance Imaging (fMRI) Study: Experiment 2
These methods are described in detail (1) and differ only slightly from the procedure in fMRI experiment 1. Five out of twenty–nine subjects that participated in the fMRI study, as well as three out of eight subjects participating in both the PET and fMRI study participated in this experiment.
Stimuli
Stimuli included a 50/50% mixture of Chug “chocolate” and “cookies and cream” milkshake and a strawberry milkshake mixed from Hershey’s strawberry syrup and whole milk, and a tasteless baseline solution.
Experimental Design
Subjects participated in three fMRI scanning sessions conducted on separate days. One scan was performed after a fast of 4 hours, one was performed after a small meal that was intended to leave the subject neither hungry nor full and another scan was performed after the subject was instructed to eat the same meal to satiety. We only used the data from the scan in which subjects were neither hungry nor full.
fMRI Data Acquisition
Subjects participated in two functional runs (20 repeats of tasteless, 10 repeats of chocolate milkshake, and 10 repeats of strawberry milkshake) and one anatomical scan. These runs were presented in a scan in which there were also 4 runs in which odors were presented (not included in the analyses presented).
fMRI Data Analysis
Data were analyzed using SPM8 software (Statistical Parametric Mapping; Wellcome Department of Imaging Neuroscience, London, UK). Functional images were time-acquisition corrected to the slice obtained at 50% of the TR and realigned to the mean image. Excessive movement during scanning was defined as greater than 2 mm movement in any direction, a criterion that none of the subjects reported here met. Anatomical and functional images were normalized and segmented using the VBM toolbox. Functional time-series were detrended, a method that eliminates at each voxel any linear component matching the global signal (29). Functional images were smoothed using a 6 mm full-width at half maximum isotropic Gaussian kernel. A design matrix was created at the individual subject level, which identified the onset and duration of each event. Events of interest were defined as mini-blocks with a duration of 4 s after onset (when solution entered the subject’s mouth). All milkshake presentations (i.e. collapsed across chocolate and strawberry for fMRI experiment 2) were modeled as an event of interest, as well as the tasteless presentations. Rinses were modeled as nuisance events. A 270 s high-pass filter was applied to the time-series data with the aim to remove low-frequency noise and slow signal drifts, which reflected the maximum period between two presentations of the same event of interest. A general linear model was used to estimate, at each voxel, condition-specific effects. A canonical hemodynamic response function, including a temporal derivative, was used to model neural response to events.
Whole brain fMRI analyses
To assess group effects, the parameter estimate images for the conditions for each subject were entered into one-sample t-test contrasting Milkshake - Tasteless. T-map threshold was set at p uncorrected < 0.005 and a 5-voxel cluster size. The milkshake and tasteless solution differ in pleasantness, mouthfeel, flavor and caloric content. Differential activations evoked by these stimuli may reflect any of these factors. We corrected for multiple comparisons by using the family-wise error correction at p < 0.05. Predicted peaks were considered significant if the correction was performed across all voxels of the ROI, whereas unpredicted peaks were considered significant if the correction was performed across all voxels of the entire brain. The ROI included the left and right insula for the effect of Milkshake – Tasteless.
ROI and statistical analyses for PET and fMRI
We used the same ROI as for extraction of BP (as above; dorsal caudate). We used rfxplot (30) to extract % signal change in response to milkshake averaged over all voxels (no thresholding applied) in each of the ROIs, regardless of whether they showed a main effect of response to milkshake vs. tasteless, thereby avoiding “double dipping” (31). Rfxplot adjusts the extracted values for run regressors and nuisance events (rinses). Percent signal change is the standard for reporting magnitude of activation in fMRI experiments. Rfxplot rescales the parameter estimate for a regressor by taking the mean signal intensity in that particular voxel into account. As such it is a measure of percent local signal change, which expresses how much the peak voxel is activated by each experimental condition compared to its own baseline signal intensity.
Next, we used the partial correlation procedure in SPSS with gender as a covariate to determine whether there is a linear relation between BMI and BOLD or BPND. P-values of less than 0.05 for the regression were regarded as significant (uncorrected for multiple comparisons).
RESULTS
Main effect of Milkshake – Tasteless
Consistent with earlier reports, there was a main effect of Milkshake - Tasteless in the insula bilaterally (Figure 1), in the left hemisphere at MNI x y z coordinates −39, −4, −2, Z = 3.83, PFWEcorrected = .015, clustersize of 161 voxels, and a trend in the right hemisphere at 30, 26, −8, Z = 3.42, PFWEcorrected = .055, clustersize of 69 voxels. We did not expect to observe a main effect in the dorsal striatum, as our previous studies indicate that this response depends upon BMI.
Figure 1.
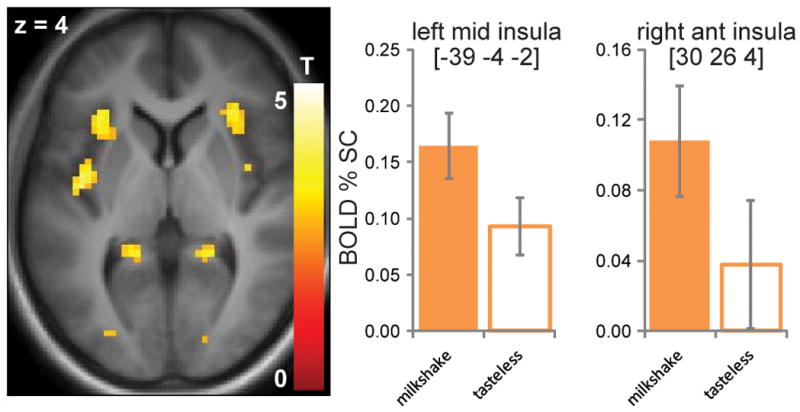
BOLD response to Milkshake – Tasteless in the left and right insula. Axial section displayed at p < 0.001. Color bar depicts T-values. Bar graphs show percent signal change for milkshake (orange) and tasteless solution (white) from the peak voxel.
Relationship between BOLD response and BMI
BOLD response to milkshake was inversely related to BMI in the right dorsal caudate (p=0.017) in the subgroup of eight subjects and we observed a significant inverse relationship between BMI and neural response in the left dorsal caudate (p=0.040) as well as a trend in right dorsal caudate (p=0.058) in the full group of 29 subjects (Figure 2). Overall, consistent with our prior work and our prediction, with BMI increases there is a decrease in response to milkshake.
Figure 2.

BOLD response to milkshake (middle section) and [11C]PHNO BP (upper section) as a function of BMI (kg/m2) in the left dorsal caudate (dCa L; left column) and right dorsal caudate (dCa R; right column). The total n=29 subjects participated in both PET and fMRI (n=8), PET (n=12), and fMRI (n=29). [11C]PHNO BP as a function of BOLD response to milkshake is depicted in the bottom section, with female subjects indicated by the label f. Pearson correlation coefficients and corresponding p-values are shown in each sector.
Relationship between D2/3 availability and BMI
[11C]PHNO BPND was significantly and positively correlated with BMI in the right dorsal caudate (p = 0.040) in the group of 12 subjects (Figure 2), as well as in the group of 8 subjects (p=0.042). No associations were observed in other striatal subregions.
Relationship between D2/3 availability and BOLD response
For the eight subjects that participated in both PET and fMRI studies, [11C]PHNO BPND and BOLD were not significantly correlated in any regions examined. We also performed a voxel wise correlation analysis in the striatum between ROI BP values and BOLD response and again did not observe significant effects.
Relationship between Age, BMI and D2/3 availability
There was no correlation found between BMI and age. There was no correlation between [11C]PHNO BPND and age in the right dorsal caudate (p=0.794, n=12), but there was a trend towards lower D2/3 availability with increased age in the left dorsal caudate of (p=0.095, n=12).
Relationship between Age and BMI and BOLD response
There was no significant correlation between age and BMI in the subjects participating in the BOLD response (n= 29 and n=8) studies. Age and BOLD response were not correlated in the left or right dorsal caudate (n= 29 and n=8).
DISCUSSION
The main finding of this study is the identification of a positive association between BMI and D2R/D3R availability in healthy subjects with BMIs ranging from 20.8 to 36.5. Taken together with the previous finding of a negative association between BMI and D2R/D3R in morbidly obese subjects (BMI>40) (13), this is consistent with the existence of a non-linear relationship between D2R/D3R availability and BMI. Specifically, we suggest that there is a positive association between BMI and D2R/D3R availability in the overweight to mildly obese range of BMI and a negative association between these factors in the morbidly obese range of BMIs.
An important consideration in interpreting the association between D2R/D3R and BMI is that the relationship may not be driven by adiposity. BMI is correlated not only with adiposity but also with glucose metabolism and diet. The only study to report no association between BMI and D2R availability in the morbidly obese performed oral glucose tolerance tests to exclude individuals who had altered glucose metabolism (18). The other studies excluded individuals who reported a diagnosis of diabetes but did not assess the possibility that participants had compromised glucose metabolism below the criteria for diabetes. Given that DS dopamine response to food is driven by glucose oxidation (32) and that striatal responses to food cues depends upon individual differences in glucose metabolism (33) it is possible that variation in glucose metabolism rather than adiposity drives the association with dopamine receptors. A second, and equally possible contributing variable is exposure to a high fat diet. Rodents that consume a high-fat diet exhibit decreased dopamine turnover independent of the development of obesity (34). In humans the relationship between fat intake and dopamine receptor levels has not been assessed; however, there is evidence that cognitive impairments associated with dopamine signaling are related to fat intake rather than BMI (35). In addition, self-reported frequency of ice-cream consumption, but not BMI in a lean sample is inversely related to DS BOLD response to milkshake in healthy weight individuals(36). Failure to evaluate diet or glucose metabolism is an important shortcoming of the current and past studies and may well account for discrepant results. Disambiguating the contribution of these related factors to dopamine receptor levels is therefore an important aim for future work.
In the current study we were able to replicate the negative relationship between BMI and DS BOLD response to the consumption of a palatable milkshake. However, in contrast to predictions, while BMI was significantly associated with both [11C]PHNO binding potential and BOLD response, these two variables were unrelated in this small sample. We acknowledge that this may reflect a false negative due to our relatively small sample size. However, while it is possible that a relationship might emerge with a larger sample, our results suggest that the relationship, if present, is not strong.
Additionally, our finding argues against the possibility that the negative association between DS BOLD response to milkshake and BMI can be explained by D2R/D3Rs. However, it does not rule out the possibility that dopamine signaling contributes to DS BOLD responses. Critically, BOLD measurements are assessed in response to the consumption of a palatable food. In contrast, binding potential is assessed at rest. As a result it reflects baseline receptor levels rather than dopamine release in response to a palatable food. Dopamine release upon food consumption has been demonstrated in humans with [11C]raclopride (37). Consistent with the specific involvement of DS, binding potential was significantly reduced in the dorsal aspect of the dorsal striatum post- versus pre- consumption of a favorite meal. To date no study has examined the effect of BMI on dopamine release but given that basal receptor levels do not correlate with BOLD response such studies are indicated.
A final consideration that we wish to highlight is that the negative relationship between BMI and DS BOLD response is specific to measurements taken during food consumption. In most of the studies reporting this association, response to distal food cues, such as the sight or smell of food, is also assessed and the opposite relationship with BMI is observed (1, 5). Corroborating these findings Nummenmaa and colleagues reported increased glucose uptake rate and increased BOLD response in the dorsal caudate in obese compared to normal weight subjects (38). These results raise the possibility that the positive association between D2R/D3R availability and BMI may be associated with BOLD responses to food cues. They also emphasize the multiple roles that dopamine signaling plays in appetitive behaviors and the possibility for independent effects of adiposity, diet, glucose metabolism or other factors on specific pathways.
In summary, we observed a positive relationship between BMI and D2R/D3R availability and a negative relationship between BMI and DS BOLD response to milkshake consumption. We further show that these associations are unrelated. The results suggest the existence of a non-linear relationship between D2R/D3R availability and BMI. The lack of association between binding potential and BOLD response indicates that dopamine release studies will be critical in determining potential dysfunction in the DS.
Acknowledgments
This publication was made possible by NIH grants K02 DA031750 and R01 DK085579 and by CTSA Grant Number UL1 RR024139 from the National Center for Research Resources (NCRR) and the National Center for Advancing Translational Science (NCATS), components of the National Institutes of Health (NIH), and NIH roadmap for Medical Research.
Footnotes
Author Roles: All authors participated in data collection, interpretation and writing of the manuscript. MV and CS analyzed the data.
Its contents are solely the responsibility of the authors and do not necessarily represent the official view of NIH.
The authors have no conflicts of interest to report.
References
- 1.Babbs RK, Sun X, Felsted J, Chouinard-Decorte F, Veldhuizen MG, Small DM. Decreased caudate response to milkshake is associated with higher body mass index and greater impulsivity. Physiol Behav. 2013;121:103–111. doi: 10.1016/j.physbeh.2013.03.025. [DOI] [PMC free article] [PubMed] [Google Scholar]
- 2.Frank GK, Reynolds JR, Shott ME, Jappe L, Yang TT, Tregellas JR, et al. Anorexia nervosa and obesity are associated with opposite brain reward response. Neuropsychopharmacology : official publication of the American College of Neuropsychopharmacology. 2012;37:2031–2046. doi: 10.1038/npp.2012.51. [DOI] [PMC free article] [PubMed] [Google Scholar]
- 3.Green E, Jacobson A, Haase L, Murphy C. Reduced nucleus accumbens and caudate nucleus activation to a pleasant taste is associated with obesity in older adults. Brain Res. 2011;1386:109–117. doi: 10.1016/j.brainres.2011.02.071. [DOI] [PMC free article] [PubMed] [Google Scholar]
- 4.Stice E, Spoor S, Bohon C, Small DM. Relation between obesity and blunted striatal response to food is moderated by TaqIA A1 allele. Science. 2008;322:449–452. doi: 10.1126/science.1161550. [DOI] [PMC free article] [PubMed] [Google Scholar]
- 5.Stice E, Spoor S, Bohon C, Veldhuizen MG, Small DM. Relation of reward from food intake and anticipated food intake to obesity: a functional magnetic resonance imaging study. J Abnorm Psychol. 2008;117:924–935. doi: 10.1037/a0013600. [DOI] [PMC free article] [PubMed] [Google Scholar]
- 6.Stice E, Yokum S, Bohon C, Marti N, Smolen A. Reward circuitry responsivity to food predicts future increases in body mass: moderating effects of DRD2 and DRD4. Neuroimage. 2010;50:1618–1625. doi: 10.1016/j.neuroimage.2010.01.081. [DOI] [PMC free article] [PubMed] [Google Scholar]
- 7.Stice E, Yokum S, Burger KS, Epstein LH, Small DM. Youth at risk for obesity show greater activation of striatal and somatosensory regions to food. J Neurosci. 2011;31:4360–4366. doi: 10.1523/JNEUROSCI.6604-10.2011. [DOI] [PMC free article] [PubMed] [Google Scholar]
- 8.Huang XF, Zavitsanou K, Huang X, Yu Y, Wang H, Chen F, et al. Dopamine transporter and D2 receptor binding densities in mice prone or resistant to chronic high fat diet-induced obesity. Behavioural brain research. 2006;175:415–419. doi: 10.1016/j.bbr.2006.08.034. [DOI] [PubMed] [Google Scholar]
- 9.Thanos PK, Michaelides M, Piyis YK, Wang GJ, Volkow ND. Food restriction markedly increases dopamine D2 receptor (D2R) in a rat model of obesity as assessed with in-vivo muPET imaging ([11C] raclopride) and in-vitro ([3H] spiperone) autoradiography. Synapse. 2008;62:50–61. doi: 10.1002/syn.20468. [DOI] [PubMed] [Google Scholar]
- 10.Johnson PM, Kenny PJ. Dopamine D2 receptors in addiction-like reward dysfunction and compulsive eating in obese rats. Nature neuroscience. 13:635–641. doi: 10.1038/nn.2519. [DOI] [PMC free article] [PubMed] [Google Scholar]
- 11.Hamdi A, Porter J, Prasad C. Decreased striatal D2 dopamine receptors in obese Zucker rats: changes during aging. Brain Res. 1992;589:338–340. doi: 10.1016/0006-8993(92)91296-q. [DOI] [PubMed] [Google Scholar]
- 12.South T, Huang XF. High-fat diet exposure increases dopamine D2 receptor and decreases dopamine transporter receptor binding density in the nucleus accumbens and caudate putamen of mice. Neurochem Res. 2008;33:598–605. doi: 10.1007/s11064-007-9483-x. [DOI] [PubMed] [Google Scholar]
- 13.Wang GJ, Volkow ND, Logan J, Pappas NR, Wong CT, Zhu W, et al. Brain dopamine and obesity. Lancet. 2001;357:354–357. doi: 10.1016/s0140-6736(00)03643-6. [DOI] [PubMed] [Google Scholar]
- 14.Michaelides M, Thanos PK, Kim R, Cho J, Ananth M, Wang GJ, et al. PET imaging predicts future body weight and cocaine preference. Neuroimage. 2012;59:1508–1513. doi: 10.1016/j.neuroimage.2011.08.028. [DOI] [PMC free article] [PubMed] [Google Scholar]
- 15.Steele KE, Prokopowicz GP, Schweitzer MA, Magunsuon TH, Lidor AO, Kuwabawa H, et al. Alterations of central dopamine receptors before and after gastric bypass surgery. Obes Surg. 2010;20:369–374. doi: 10.1007/s11695-009-0015-4. [DOI] [PubMed] [Google Scholar]
- 16.Johnson PM, Kenny PJ. Dopamine D2 receptors in addiction-like reward dysfunction and compulsive eating in obese rats. Nature neuroscience. 2010;13:635–641. doi: 10.1038/nn.2519. [DOI] [PMC free article] [PubMed] [Google Scholar]
- 17.de Weijer BA, van de Giessen E, van Amelsvoort TA, Boot E, Braak B, Janssen IM, et al. Lower striatal dopamine D2/3 receptor availability in obese compared with non-obese subjects. EJNMMI Res. 2011;1:37. doi: 10.1186/2191-219X-1-37. [DOI] [PMC free article] [PubMed] [Google Scholar]
- 18.Eisenstein SA, Antenor-Dorsey JA, Gredysa DM, Koller JM, Bihun EC, Ranck SA, et al. A comparison of D2 receptor specific binding in obese and normal-weight individuals using PET with (N-[(11)C]methyl)benperidol. Synapse. 2013;67:748–756. doi: 10.1002/syn.21680. [DOI] [PMC free article] [PubMed] [Google Scholar]
- 19.Steele KE, Prokopowicz GP, Schweitzer MA, Magunsuon TH, Lidor AO, Kuwabawa H, et al. Alterations of central dopamine receptors before and after gastric bypass surgery. Obesity Surgery. 2010;20:369–374. doi: 10.1007/s11695-009-0015-4. [DOI] [PubMed] [Google Scholar]
- 20.Dunn JP, Cowan RL, Volkow ND, Feurer ID, Li R, Williams DB, et al. Decreased dopamine type 2 receptor availability after bariatric surgery: preliminary findings. Brain Res. 2010;1350:123–130. doi: 10.1016/j.brainres.2010.03.064. [DOI] [PMC free article] [PubMed] [Google Scholar]
- 21.Davis C, Strachan S, Berkson M. Sensitivity to reward: implications for overeating and overweight. Appetite. 2004;42:131–138. doi: 10.1016/j.appet.2003.07.004. [DOI] [PubMed] [Google Scholar]
- 22.Nolan-Poupart S, Veldhuizen MG, Geha P, Small DM. Midbrain response to milkshake correlates with ad libitum milkshake intake in the absence of hunger. Appetite. 2013;60:168–174. doi: 10.1016/j.appet.2012.09.032. [DOI] [PMC free article] [PubMed] [Google Scholar]
- 23.Wilson AA, McCormick P, Kapur S, Willeit M, Garcia A, Hussey D, et al. Radiosynthesis and evaluation of [11C]-(+)-4-propyl-3,4,4a,5,6,10b-hexahydro-2H-naphtho[1,2-b][1,4]oxazin-9 -ol as a potential radiotracer for in vivo imaging of the dopamine D2 high-affinity state with positron emission tomography. J Med Chem. 2005;48:4153–4160. doi: 10.1021/jm050155n. [DOI] [PubMed] [Google Scholar]
- 24.Martinez D, Slifstein M, Broft A, Mawlawi O, Hwang DR, Huang Y, et al. Imaging human mesolimbic dopamine transmission with positron emission tomography. Part II: amphetamine-induced dopamine release in the functional subdivisions of the striatum. Journal of cerebral blood flow and metabolism : official journal of the International Society of Cerebral Blood Flow and Metabolism. 2003;23:285–300. doi: 10.1097/01.WCB.0000048520.34839.1A. [DOI] [PubMed] [Google Scholar]
- 25.Lammertsma AA, Hume SP. Simplified reference tissue model for PET receptor studies. Neuroimage. 1996;4:153–158. doi: 10.1006/nimg.1996.0066. [DOI] [PubMed] [Google Scholar]
- 26.Veldhuizen MG, Bender G, Constable RT, Small DM. Trying to Detect Taste in a Tasteless Solution: Modulation of Early Gustatory Cortex by Attention to Taste. Chemical Senses. 2007;32:569–581. doi: 10.1093/chemse/bjm025. [DOI] [PubMed] [Google Scholar]
- 27.Small DM, Gregory MD, Mak YE, Gitelman D, Mesulam MM, Parrish T. Dissociation of neural representation of intensity and affective valuation in human gustation. Neuron. 2003;39:701–711. doi: 10.1016/s0896-6273(03)00467-7. [DOI] [PubMed] [Google Scholar]
- 28.Small DM, Voss J, Mak YE, Simmons KB, Parrish T, Gitelman D. Experience-dependent neural integration of taste and smell in the human brain. J Neurophysiol. 2004;92:1892–1903. doi: 10.1152/jn.00050.2004. [DOI] [PubMed] [Google Scholar]
- 29.Macey PM, Macey KE, Kumar R, Harper RM. A method for removal of global effects from fMRI time series. Neuroimage. 2004;22:360–366. doi: 10.1016/j.neuroimage.2003.12.042. [DOI] [PubMed] [Google Scholar]
- 30.Glascher J. Visualization of group inference data in functional neuroimaging. Neuroinformatics. 2009;7:73–82. doi: 10.1007/s12021-008-9042-x. [DOI] [PubMed] [Google Scholar]
- 31.Kriegeskorte N, Simmons WK, Bellgowan PS, Baker CI. Circular analysis in systems neuroscience: the dangers of double dipping. Nature neuroscience. 2009;12:535–540. doi: 10.1038/nn.2303. [DOI] [PMC free article] [PubMed] [Google Scholar]
- 32.Tellez L, Ren X, Han W, Medina S, Ferreira J, Yeckel C, et al. Glucose utilization rates regulate intake levels of artificial sweeteners. Journal of Physiology. 2013 doi: 10.1113/jphysiol.2013.263103. In Press. [DOI] [PMC free article] [PubMed] [Google Scholar]
- 33.de Araujo IE, Lin T, Veldhuizen MG, Small DM. Metabolic regulation of brain response to food cues. Curr Biol. 2013;23:878–883. doi: 10.1016/j.cub.2013.04.001. [DOI] [PMC free article] [PubMed] [Google Scholar]
- 34.Davis JF, Tracy AL, Schurdak JD, Tschop MH, Lipton JW, Clegg DJ, et al. Exposure to elevated levels of dietary fat attenuates psychostimulant reward and mesolimbic dopamine turnover in the rat. Behav Neurosci. 2008;122:1257–1263. doi: 10.1037/a0013111. [DOI] [PMC free article] [PubMed] [Google Scholar]
- 35.Francis H, Stevenson R. The longer-term impacts of Western diet on human cognition and the brain. Appetite. 2013;63:119–128. doi: 10.1016/j.appet.2012.12.018. [DOI] [PubMed] [Google Scholar]
- 36.Burger KS, Stice E. Frequent ice cream consumption is associated with reduced striatal response to receipt of an ice cream-based milkshake. Am J Clin Nutr. 2012;95:810–817. doi: 10.3945/ajcn.111.027003. [DOI] [PMC free article] [PubMed] [Google Scholar]
- 37.Small DM, Jones-Gotman M, Dagher A. Feeding-induced dopamine release in dorsal striatum correlates with meal pleasantness ratings in healthy human volunteers. Neuroimage. 2003;19:1709–1715. doi: 10.1016/s1053-8119(03)00253-2. [DOI] [PubMed] [Google Scholar]
- 38.Nummenmaa L, Hirvonen J, Hannukainen JC, Immonen H, Lindroos MM, Salminen P, et al. Dorsal striatum and its limbic connectivity mediate abnormal anticipatory reward processing in obesity. PLoS One. 2012;7:e31089. doi: 10.1371/journal.pone.0031089. [DOI] [PMC free article] [PubMed] [Google Scholar]