

Abstract
Gold nanoparticles (Au NPs) are attractive for biomedical applications not only for their remarkable physical properties, but also for the ease of which their surface chemistry can be manipulated. Many applications involve functionalization of the Au NP surface in order to improve biocompatibility, attach targeting ligands or carry drugs. However, changes in cells exposed to Au NPs of different surface chemistries have been observed, and little is known about how Au NPs and their surface coatings may impact cellular gene expression. The gene expression of two model human cell lines, human dermal fibroblasts (HDF) and prostate cancer cells (PC3) was interrogated by microarray analysis of over 14,000 human genes. The cell lines were exposed to four differently functionalized Au NPs: citrate, poly(allylamine hydrochloride) (PAH), and lipid coatings combined with alkanethiols or PAH. Gene functional annotation categories and weighted gene correlation network analysis were used in order to connect gene expression changes to common cellular functions and to elucidate expression patterns between Au NP samples. Coated Au NPs affect genes implicated in proliferation, angiogenesis, and metabolism in HDF cells, and inflammation, angiogenesis, proliferation apoptosis regulation, survival and invasion in PC3 cells. Subtle changes in surface chemistry, such as the initial net charge, lability of the ligand, and underlying layers greatly influence the degree of expression change and the type of cellular pathway affected.
Introduction
Interest in gold nanoparticles (Au NPs) for biomedical applications has increased exponentially in recent decades due to their unique set of physical properties, as well as the ease of surface chemistry manipulation.1–4 Au NPs are relatively chemically inert, show plasmonic properties upon proper illumination and have high surface-to-volume ratios, making them ideally suited for biomedical applications such as biochemical sensing, drug and gene delivery, photothermal therapy, and in vivo and in vitro imaging.4–14 Given the widespread impact of Au NPs in nano-biotechnology, it is imperative to carefully characterize the influence of Au NPs on living systems at the cellular level.
While many studies have shown Au NPs to be non-toxic at various concentrations,15–16 they have still been shown to cause of structural changes in mammalian cells. A549 (human lung epithelial cancer) cells changed to a rounded morphology with nuclear condensation after exposure to 120 nM citrate-functionalized Au NPs, which indicates cell stress.17 Others report concentration-dependent disruption of actin fibers and tubulin cytoskeleton after Au NP uptake at 10–100 nM doses in a variety of cell lines, and after <1 mg/mL doses in human dermal fibroblasts.18–19 The surface charge influences NP affinity for cell membranes, with positively charged NPs being endocytosed more than negatively charged Au NPs.20 Surface charge-dependent binding of NPs to cell membranes has been shown to induce bilayer reconstruction.20–22 A variety of experiments show that Au NPs can affect cell morphology in different ways based on size, shape, surface coating, concentration and cell type.17–19, 23
Other changes to cells may not be as easily observed as morphological changes. An effective approach to determining cellular response to an outside stimulus is to analyze changes in gene expression. Previous studies in our lab have demonstrated the possibility that adsorption of soluble factors in cellular environments to NPs can “shift the equilibria” of cellular processes: adsorption of proteins to nanoparticles can make the proteins less bioavailable to cells and thereby influence cell response at the transcriptomic level.24 By measuring RNA transcript levels in cells upon exposure to differently-coated Au NPs, gene expression changes the NPs induce at the molecular level can be quantified. Previous studies have shown that Au NPs can activate different cellular pathways based on the size, shape and coating.25–27 One study with HeLa cells determined that citrate Au NPs caused changes in cell cycle gene expression and induce early apoptosis while nucleic acid-functionalized Au NPs did not cause any significant changes.28 Another study demonstrated that mercaptohexadecanoic acid-functionalized Au NPs induced more changes in the level of gene expression than polyethylene glycol (PEG)-coated Au NPs over the 84 genes probed in human keratinocyte cells.29
Another study proposed that the affinity of gold itself for thiol groups (this affinity would be modulated differently by different surface coatings) induced activation of inflammatory pathways in B-lymphocytes.30 These studies (and others) have indicated the importance of Au NP surface chemistry on gene expression and pathway signaling, but none have measured global gene expression of cells exposed to Au NPs with multiple related surface coatings differing in factors such as surface charge and coating structure.26–32 Moreover, studying the influence on different types of cells is extremely important.17
In this paper, we investigate the global gene expression in human dermal fibroblast cells (HDF) and prostate cancer cells (PC3) via RNA microarray for 34,127 probes (14,765 unique genes) after incubation with 20 nm Au NPs with different surface coatings, including cationic, anionic and biomimetic lipid-based surface coatings. The bimolecular lipid coatings are of special interest due to their expected biocompatibility and relationship to natural cellular membranes.33–35 We have tested two different cell types that would be expected to have different potential routes of exposure at two typical NP concentrations low enough not to induce acute toxicity. We combined statistical analysis of RNA microarray data with weighted gene co-expression network analysis and gene functional annotation clustering to connect Au NP surface coating to changes in specific cellular pathways. In order to more closely study the role of NP electrostatics in the gene expression changes, theoretical isoelectric points of proteins encoded by some of the differentially expressed genes were compared. The role of differences in uptake between the NP types was also studied. Taken together, we were able to better learn how surface chemistry of Au NPs influences gene expression in human cells expected to be exposed to nanomaterials via both environmental (skin) and therapeutic (prostate cancer) means.
Experimental
Materials
Gold(III) chloride trihydrate (HAuCl4·3H2O, ≥99.9%), sodium citrate tribasic dihydrate (Na3Ct.2H2O, ≥99%), 1-octadecanethiol (98%, C18SH), poly(allylamine hydrochloride), (PAH, M.W. 15,000 g/mole), 4-(2-hydroxyethyl)-1-piperazineethanesulfonic acid (HEPES) were obtained from Sigma Aldrich and were used as received. 1-palmitoyl-2-oleoyl-sn-glycero-3-phospho-L-serine (sodium salt) (POPS), 1-palmitoyl-2-hydroxy-sn-glycero-3-phosphocholine (LPC) were obtained from Avanti Polar Lipids and were used as received. Trizol (Invitrogen) and RNeasy kit (Qiagen) were used in the extraction of RNA. Ultrapure deionized water (17.9 MΩ, Barnstead NANOpure II) was used for all solution preparations. Glassware was cleaned with aqua regia and rinsed thoroughly before use. Absorption spectra of Au NPs (Figure S1) were taken on a Cary 500 scan UV-vis-NIR spectrophotometer and absorption spectra of RNA were taken on Nanodrop 1000. Zeta potential and dynamic light scattering measurements were performed on a Brookhaven Zeta PALS instrument.
Synthesis of Gold Nanoparticles (Citrate Au NPs)
Au NPs of diameter 20 nm were synthesized via the boiling citrate method as previously described.33–34 Briefly, 2.5 mL of 0.01 mM HAuCl4 solution and 97.5 mL ultrapure deionized water were combined and heated to a gentle boil with stirring. After 5 min, 2 mL of 5% (w/w) sodium citrate was added. Another 0.5 mL of 5% sodium citrate was added after 30 additional min (during which the solution turned red). After boiling for another 10 min, the solution was allowed to cool while stirring before centrifugation and purification. The citrate Au NPs were negatively charged (ζ-potenial of −19.2 mV ± 1.2 in water, −22.7 mV ± 0.4 in cell media) with a diameter of 32.3 nm ± 0.2 in water (83.2 nm ± 1.1 in cell media) by dynamic light scattering (DLS), as previously reported.34 UV-visible absorption spectra are shown in Figure S1.
PAH Coating of Gold Nanoparticles (PAH Au NPs)
All surface modification procedures were performed as previously described.33–34 The Au pellet after centrifugation of 1 mL of Au NPs was redispersed in 1 mL of deionized water. 100 μL of 0.1 M NaCl and 200 μL 10 mg mL−1 PAH were added to the Au NP solution and vortexed before incubating overnight. Purification was done by centrifugation and the PAH Au NPs were characterized (ζ-potential 16.6 mV ± 1.6 in water, −18.8 mV ± 0.6 in cell media; diameter by DLS 34.7 nm ± 0.3 in water, 169.1 nm ± 7.2 in cell media).34
Preparation of 1:1 POPS/LPC Lipid Vesicles
A 1:1 weight ratio of 1-palmitoyl-2-oleoyl-sn-glycero-3-phospho-L-serine/1-palmitoyl-2-hydroxy-sn-glycero-3-phosphocholine (POPS/LPC) was used to make hybrid-lipid-coated Au NPs (HL Au NPs) and lipid-coated PAH Au NPs (L-PAH Au NPs), detailed previously.33–34 Briefly, a total of 1 mg of lipid (0.5 mg of each POPS and LPC) in chloroform was dried under nitrogen, followed by vacuum drying for 6 h. 1 mL of 20 mM HEPES buffer was added to give a final concentration of 1 mg mL−1. The mixture was sonicated for about 1 h to create a clear, colorless lipid vesicle solution. The vesicles averaged ~90 nm by DLS.33–34
Synthesis of Lipid-Coated Gold Nanoparticles (L-PAH Au NPs, HL Au NPs)
The Au pellet from centrifugation of 1 mL as-made Au NPs was redispersed in 0.5 mL of 20 mM HEPES buffer. For lipid-coated PAH Au NPs (L-PAH Au NPs), 0.5 mL of the 1:1 POPS/LPC lipid solution was added to PAH Au NPs and mixed.33–34 For hybrid lipid Au NPs (HL Au NPs), 0.5 mL of the lipid solution was added to purified as-made Au NPs, followed by 2 μL of C18SH (0.5 mg/mL in ethanol).33–34 The mixture was incubated overnight at room temperature. The mixture was then centrifuged (700 rcf, 30 min then 2000 rcf, 30 min for L-PAH Au NPs and 4000 rcf, 25 min for HL Au NPs) and the Au pellet was resuspended in HEPES buffer. The HL Au NPs had a ζ-potential of −51.9 mV ± 1.3 in water (−10.8 mV ± 2.2 in cell media) and a diameter by DLS of 38.4 nm ± 0.3 in water (43.1 nm ± 2.0 in cell media), and the L-PAH Au NPs had a ζ-potential of −48.7 mV ± 1.3 in water (−27.4 mV ± 0.8 in cell media) and a diameter by DLS of 163.2 nm ± 1.6 in water (150.2 nm ± 1.2 in cell media).34
Cell Culture and Nanoparticle Incubation
HDF and PC3 cells were plated in 6-well plates and grown to confluency in their respective growth media. HDF cells were grown in Dulbecco’s Modified Eagle Medium (DMEM, Mediatech) with 1 mM sodium pyruvate, 10% fetal bovine serum (FBS, Gemini Bio-Products), and penicillin/streptomycin (pen-strep) solution. PC3 cells were grown in 1:1 DMEM/Ham’s F-12 (Mediatech) with 2 mM sodium pyruvate, 1.5 g L−1 NaHCO3, 10% FBS, and pen-strep. Au NPs were first suspended in cell media, and then added to cells (1 nM Au NPs for PC3, 0.1 nM for HDF). HDF cells were incubated with Au NPs for 24 hours and PC3 cells for 48 hours before RNA extraction.
RNA Extraction
A combined Trizol extraction, followed by RNeasy purification was used, according to manufacturer’s protocol. Briefly, cells were first washed thrice with PBS, and 1 mL Trizol added. The cells were homogenized by pipetting up and down several times and transferred to a centrifuge tube. The samples were allowed to sit for about 5 min at room temperature before adding 0.2 mL chloroform. The mixture was vortexed for 20 sec, incubated for 12 min at room temperature and centrifuged at 20,000 rcf for 20 min at 4 °C. The upper aqueous phase was extracted, taking care to avoid the organic layer. To this aqueous layer, an equal amount of ethanol was added and mixed. This sample was loaded into an RNeasy column and purified according to kit instructions. Collected RNA was checked for amount and quality using a NanoDrop 1000 (NanoDrop Technologies, Wilmington, DE) and Bioanalyzer 2100 (Agilent Technologies, Santa Clara, CA), respectively, and stored at −80 °C until ready for microchip array analysis.
Microarray Labeling and Hybridization
For each sample 200 ng of total RNA was labeled using the Agilent 2-color Low Input Quickamp Labeling kit (Agilent Technologies, Santa Clara, CA) according to the manufacturer’s protocols. Labeled samples were hybridized to a Human 4 × 44 Agilent microarray kit and scanned on an Axon 4000B microarray scanner at 5 um resolution. Each array contains 45,220 spots with 34,127 unique 60-mer probes. All microarray data files were submitted to Gene Ontology Omnibus (GEO) and are available for download with accession number GSE56432.
Microarray Data Analysis
Microarray data pre-processing and statistical analyses were done in R (v 3.0.1)36 using the limma package (v 3.16.7).37 Median foreground and median background values from the 15 arrays were read into R and any spots that had been manually flagged (−100 values) were given a weight of zero.38 The background values were ignored because investigations showed that trying to use them to adjust for background fluorescence added more noise to the data.
The individual Cy5 and Cy3 values from each array were all normalized together using the quantile method and then log2-transformed.38 Agilent’s Human Gene Expression 4x44K v2 Microarray interrogates 27,958 genes using 33,128 probes spotted one time (1X) and 999 probes spotted ten times (10X) each. Correlations between the replicate spots per probe were high and so they replicate spot values were simply averaged for each sample. The positive and negative control probes were used to assess what minimum expression level could be considered “detectable above background noise” (6 on the log2 scale) and then discarded. A mixed effects statistical model39 was fit on the 34,127 unique probes to estimate the mean expression level for each of the 10 line X nanoparticle groups while accounting for dye effects and the correlation due to array.40 After fitting the model, probes that did not have expression values > 6 in at least 3/30 samples were discarded. Pairwise comparisons between the nanoparticles within each cell line were pulled as contrasts from the model, along with the equivalent of a one-way ANOVA test for nanoparticle within each cell line and the overall interaction test between cell line and nanoparticle. Raw p-values were adjusted separately for each comparison using the False Discovery Rate method.41
Initial heatmaps for each cell line using probes that had a within-line one-way ANOVA FDR p-value < 0.05 showed a fairly simple expression pattern across the 4 nanoparticles plus control for the HDF cell line, but a much more complex expression pattern for PC3 (Figure 2). Therefore, we did a Weighted Gene Correlation Network Analysis (WGCNA)42–43 on a subset of the probes for the PC3 line to computationally assess the different expression patterns. WGCNA clusters probe using a complicated distance metric then separates them into different “modules” that share a consistent expression pattern. We selected 4,496 probes that had a reasonable level of statistical evidence for differential expression (PC3 one-way ANOVA FDR p-value < 0.2) and reasonable amount of changed expression (at least 1.3 FC between any 2 of the 5 groups) and performed WGCNA (v 1.27-1) using the default values of the blockwiseModules() function except for: soft thresholding power β = 22, an unsigned topological overlap matrix, a minimum module size of 20 and merging similar modules at 0.15. This resulted in 18 modules ranging from 1452 to 21 probes, plus the “module 0” consisting of 8 probe sets that did not fit any of the 18 patterns.
Fig. 2.

Principal component analysis of PC3 and HDF gene expression data. Principal components 1 and 2 are shown. PC3 samples are represented by circles and HDF samples by diamonds. Different sample types are shown in various colors as follows: control = green, citrate Au NPs = yellow, HL Au NPs = red, PAH Au NPs = blue, L-PAH Au NPs = purple.
Gene functional clusters for expressed genes were generated using DAVID (Database for Annotation, Visualization and Integrated Discovery) developed at National Cancer Institute at Frederick.44–45 Up- and down-regulated genes were submitted and analyzed using functional annotation clustering and functional annotation chart.44–45 The classification stringency was set at medium and kappa similarity threshold was set at 0.50. Clusters were selected based on their Fisher exact p-value as well as their relevance. Theoretical isoelectric points of proteins were calculated using a web tool (http://isoelectric.ovh.org/).
Quantitative Real-Time Polymerase Chain Reaction (qPCR)
To validate the microarray results, a real-time quantitative polymerase chain reaction (qPCR) analysis was performed on HDF and PC3 cells exposed to the same experimental conditions used for the microarray assay. For both cell types, genes investigated by qPCR were those that presented the largest gene expression changes after exposure to PAH and L-PAH Au NPs by microarray in some selected pathways: cell proliferation and cell metabolism considering HDF cells, and inflammation, apoptosis, cell proliferation, cell growth and differentiation and organization of the cytoskeleton considering PC3 cells. The reaction was performed using the AgPath-ID™ one-step RT-PCR kit (Applied Biosystems). Briefly, 2 μL purified RNA (25 ng μL−1) was reverse transcribed and amplified in a 10 μL reaction mixture containing 5 μL of 2X RT-PCR buffer, 0.4 μL of 25X RT-PCR enzyme mix, and 1.25 μL yeast RNA (5 mg mL−1, Ambion). Gene-specific primers and TaqMan® probe sets for each gene were obtained from Assay-on-Demand Gene Expression Products (Applied Biosystems) and a list of probes is available in Table S3. Three RNA samples were collected for each Au NP type and were run in duplicate for each gene along with a no-template control. Three reference genes, GADPH, B2M, and HPRT1, were used as internal controls to normalize the target gene expression in both HDF and PC3 cells.46–47 The mRNA of individual genes were quantified on the 7900HT Fast Real-Time PCR System (Applied Biosystems, Foster City, CA) with corresponding Sequence Detection Systems software (Applied Biosystems, Foster City, CA). Thermal cycling conditions comprised of a 10 min RT step at 45°C and a 10 min initial PCR activation step at 95°C (AmpliTaq Gold activation), followed by 40 cycles of 95°C for 15 s and 60°C for 45 s each. Relative expression levels were calculated for each sample after normalization against the geometric averaging of the three reference genes for HDF cells. For PC3 cells, only GAPDH threshold cycle was used to normalize the gene expression data obtained. The ΔΔCt method was performed for comparing relative fold expression differences.. Statistical analysis of the qRT-PCR data was performed using the web-based RT2 Profiler™ PCR Array Data Analysis software (SABiosciences, www.SABiosciences.com/pcrarraydataanalysis.php).
Results and Discussion
Global Gene Expression Changes after Au NP Incubation
The transcriptomic impacts of 20 nm spherical Au NPs with four different surface coatings on two types of cells were investigated. The experimental layout and schematics of the four Au NP types are shown in Figure 1. As-made Au NPs have citrate (anionic) ions on the surface. By polyelectrolyte coating with poly(allylamine hydrochloride) (PAH), the surface becomes primary amine-terminated, making the Au NPs cationic under physiological conditions. We also investigated the influence of pre-coating Au NPs with biomolecules, which may improve the biocompatibility of Au NPs. Au NPs were coated with a 1:1 mixture of lipids (1-palmitoyl-2-oleoyl-sn-glycero-3-phospho-L-serine (anionic, POPS)/1-palmitoyl-2-hydroxy-sn-glycero-3-phosphocholine (zwitterionic, LPC)) and were allowed to adsorb differently based on the initial surface chemistry (PAH or alkanethiol in this case).33–34 By first coating with PAH and then lipids, lipid-coated PAH Au NPs (L-PAH Au NPs) were formed.33–34 Alternatively, by first functionalizing citrate Au NPs with octadecanethiol (C18SH), hybrid lipid layers were formed on Au NPs (HL Au NPs), as previously described by our laboratory.33–34 All of these NP types were well-characterized and checked for stability in cell medium as previously reported by dynamic light scattering (DLS), zeta potential measurements (Table 1), UV-Vis spectroscopy and transmission electron microscopy33–34
Fig. 1.

a) Experimental scheme for incubation of cells with Au NPs, followed by microarray gene expression analysis and real-time PCR validation. Portions of the artwork adapted with permission from Ref. 49. Copyright 2013 American Chemical Society. b) Types of Au NPs used for incubation. PAH is modeled as a blue layer and lipids and alkanethiol are shown as individual molecules (not to scale). L-PAH = lipid bilayer electrostatically adsorbed onto PAH. HL = hybrid lipid = lipids hydrophobically associated with C18 tail of self-assembled monolayer of C18SH on gold. Adapted with permission from Ref. 34.
Table 1.
Dynamic light scattering (DLS) and zeta potential (ζ) characterization results for each Au NP type
| DLS (in H2O, nm) | DLS (in media, nm) | ζ (in H2O, mV) | ζ (in media, mV) | |
|---|---|---|---|---|
| citrate | 32.3 ± 0.2 | 83.2 ± 1.1 | −19.2 ± 1.2 | −22.7 ± 0.4 |
| HL | 38.4 ± 0.3 | 43.1 ± 2.0 | −51.9 ± 1.3 | −10.8 ± 2.2 |
| PAH | 34.7 ± 0.3 | 169.1 ± 7.2 | 16.6 ± 1.6 | −18.8 ± 0.6 |
| L-PAH | 163.2 ±1.6 | 150.2 ± 1.2 | −48.7 ± 1.3 | −27.4 ± 0.8 |
Diameter and zeta potential results as reported previously by Ref. 34
Two different cell types were studied under different conditions mimicking intentional and unintentional exposure to Au NPs. Unintentional exposure to NPs (at low dosage) would most often occur via contact with the skin; therefore, human dermal fibroblasts (HDF) were investigated as our model system. HDF cells were incubated with Au NPs at a low particle concentration of 0.1 nM (~70,000 NP/cell). Alternatively, NPs are often used at higher concentrations in biological applications, either for imaging or therapy. Prostate cancer cells (PC3) were chosen to represent typical targeted cells and were exposed to Au NPs at 1.0 nM concentrations (~470,000 NP/cell). In both cases, cells were exposed to Au NPs for 24–48 h (24 for HDF, 48 for PC3), after which >95% were alive in all cases (data not shown). Additionally, studying these types of Au NPs and cells allowed for an improved understanding of earlier related experiments on cellular response to gold nanoparticles in our group.34 Control samples consisted of cells not exposed to any Au NPs. Au NPs and all solutions used for synthesis were tested for endotoxin contamination using a Pierce LAL Chromogenic Endotoxin Quantification kit (Thermo Scientific) and were negative for endotoxins (at least <0.01 ng/mL per the kit’s detection limits).
After RNA extraction and microarray analysis, downstream global gene expression analysis was performed for both cell types with the four kinds of Au NPs. Firstly, all of the normalized gene expression data was evaluated using principal component analysis (PCA), which identifies the largest variations in the data as principal components (Figure 2).48 This provided a first look at the separate sample types relative to each other. By PCA, we conclude that 1) HDF and PC3 are distinct cell types; 2) incubation of HDF cells with citrate or HL Au NPs induced very small changes in gene expression as compared to control samples; 3) incubation of HDF cells with PAH or L-PAH Au NPs induced substantial changes in gene expression as compared to controls; 4) the differences in gene expression in HDF cells between PAH and L-PAH Au NPs were small; and 5) incubation of PC3 cells with different Au NPs elicited different gene responses from HDF cells which suggests that PC3 cells are more responsive to the coated Au NPs than HDF cells, though it must be noted that PC3 cells were exposed to higher concentrations of Au NPs than the HDF cells were.
To obtain a broad view of the expression patterns in each cell type, we constructed heatmaps of the genes that showed significant difference across the four treatment groups within each cell type compared to control samples, unexposed cells (oneway ANOVA within each cell type, false discovery rate (FDR) p-value < 0.05 (more conservative than p-value; FDR p-value < 0.05 means that 5% of significant tests will result in false positives); Figure 3). The heatmaps include 3364 genes for HDF cells and 5169 genes for PC3 cells. For HDF cells, there is an overwhelming pattern in which genes with low expression levels in control, citrate and HL Au NP samples are highly expressed in PAH and L-PAH Au NP samples, and vice versa. With PC3 cells, this distinct pattern is not observed. Instead, different types of Au NPs elicited more complex gene responses from PC3 cells.
Fig. 3.

Heatmaps showing changes in global gene expression of a) HDF and b) PC3 cells after exposure for four types of Au NPs. Plus and minus symbols refer to the initial surface charge of the Au NPs. Each row represents one gene (within-cell type oneway ANOVA FDR p-value < 0.05). Using a scale of standard deviations from the mean expression level, the change in expression level is shown as red (higher expression) or blue (lower expression) relative to the mean across all samples. Each column corresponds to one sample; all samples were collected in triplicate and samples exposed to the same Au NP type cluster together.
Table 2 lists the number of genes that were differentially expressed with a raw p-value < 0.05 and a log2 fold change (FC) of at least ±1.5 versus control after Au NP treatment. Raw p-values were used here rather than FDR p-values because the large differences in number of genes changed between different sample types affect the FDR correction. As estimated from the PCA and heatmaps, only a small number of genes were significantly differentially expressed by citrate and HL Au NPs in HDF cells, while PAH and L-PAH Au NPs elicited a similarly larger gene response. Exposure of PC3 cells to citrate Au NPs showed more, yet still modest, changes than with HDF cells. Both PAH and L-PAH Au NPs caused the down-regulation of many more genes than were up-regulated, and HL Au NPs also showed more significant expression changes with HDF cells. While PAH and L-PAH Au NPs changed the expression of about the same number of genes in HDF cells, L-PAH Au NPs caused over three times more gene expression changes than did PAH Au NPs in PC3 cells. These results show that PAH and L-PAH Au NPs induced greater cellular responses from both HDF and PC3 cells compared to citrate and HL Au NP genes responses, with L-PAH Au NPs having the largest effect in PC3 cells.
Table 2.
Number of genes in HDF and PC3 cells which were differently expressed after exposure to Au NPs.
| HDF genes | PC3 genes | |||||
|---|---|---|---|---|---|---|
| Au NPa | Down-regulated | Up-regulated | Total | Down-regulated | Up-regulated | Total |
| citrate | 5 | 4 | 9 | 18 | 40 | 58 |
| HL | 21 | 16 | 37 | 95 | 79 | 174 |
| PAH | 654 | 526 | 1180 | 415 | 27 | 442 |
| L-PAH | 586 | 579 | 1165 | 1063 | 376 | 1439 |
Genes are filtered with a cut-off criteria of raw p-value < 0.05 and either a log2 fold change (FC) < −1.5 for down-regulated genes or FC > 1.5 for up-regulated genes
For HDF cells, not only did PAH and L-PAH Au NPs change the expression of similar numbers of genes, but a large portion of the same genes were differentially expressed by both types, as seen in Figure 4 (840 genes were differentially expressed versus controls by both PAH and L-PAH Au NPs). For PC3 cells, most of the genes differentially expressed by PAH Au NPs were also changed by L-PAH Au NPs (77%) with L-PAH Au NPs affected many additional genes. Interestingly, there were 49 genes affected by both HL and L-PAH Au NPs, and there were even some similarities in gene expression changes between HL and PAH Au NPs, and citrate and L-PAH Au NPs.
Fig. 4.
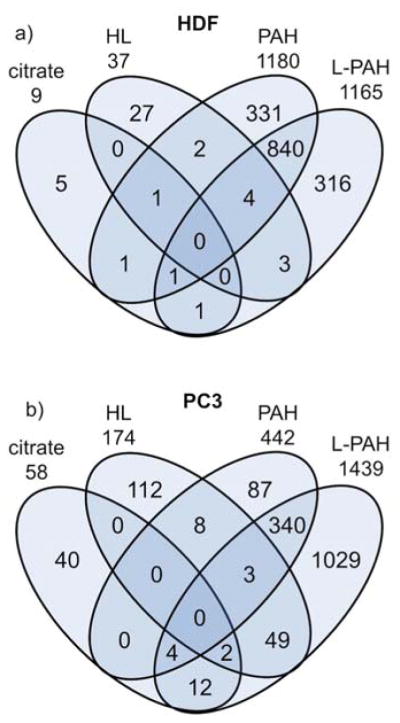
Venn diagrams comparing the number of genes that showed expression changes (raw p-value < 0.05, FC > 1.5, FC < −1.5) for a) HDF and b) PC3 cells. Each Venn diagram is divided according to the type of Au NP treatment, and the number of genes differentially expressed are shown in the overlapping regions.
Quantification of NP Uptake
In our study, while cells were incubated with Au NPs at fixed concentrations (0.1 nM or ~70,000 NP/cell for HDF cells, 1.0 nM or ~470,000 NP/cell for PC3 cells), the total uptake of Au NP per cell depended on the Au NP surface chemistry (Figure 5). Uptake was measured by first washing away excess (non-internalized) Au NPs, followed by digestion of Au NPs by aqua regia and measurement of gold content by ICP-MS. The relative uptake rates are similar but not identical to the trends seen by overall gene expression patterns between different Au NPs. For instance, the uptake of HL Au NPs was significantly lower compared to PAH and L-PAH Au NPs in HDF cells, but L-PAH Au NPs were taken up much less than PAH Au NPs. For PC3 cells, L-PAH Au NPs caused the most gene expression changes and were also the mot efficiently uptaken into the cells. At the same time, PAH and HL Au NPs were taken into the cells at about the same rate, even though PAH Au NPs caused many more changes than did HL Au NPs, and citrate Au NPs were at almost the same NP/cell concentration as L-PAH Au NPs. Positively-charged NPs have been shown by others to be more readily uptaken by cells than negatively-charged NPs, but this was not observed here, and HDF cells took in more PAH Au NPs than did PC3 cells even though they were delivered at 1/10 the concentration. In both cell types, uptake of citrate Au NPs was the second highest though these NPs caused by far the lowest gene expression changes. These observations suggest that the gene expression changes imperfectly correlate with dose; initial surface chemistry of the nanoparticles matter. For citrate Au NPs, even though relatively many Au NPs are taken up by cells, the influence is small as the impact per Au NP is small.
Fig. 5.

a) Au NP total uptake per cell quantified by ICP-MS for PC3 (circles) and HDF (diamonds) cells versus number of genes differently expressed for each type of Au NP-exposed samples. PC3 cells were incubated with Au NPs at 1.0 nM and HDF cells with Au NPs at 0.1 nM overnight. b) Transmission electron microscopy of HL Au NPs in PC3 cells at 1.0 nM. Inset shows HL Au NPs in a vesicle at higher magnification.
Gene Expression Changes in HDF Cells after Au NP Incubation
To understand the significance of the altered gene expression with NP exposure, and the possible biological pathway/terms that are affected, the changed genes were analyzed using the high-throughput bioinformatics tool DAVID (Database for Annotation, Visualization and Integrated Discovery).44–45 Using DAVID for gene annotation enrichment analysis and functional annotation clustering, all of the genes (raw p-value < 0.05) that were up-regulated (FC > 1.5) and down-regulated (FC < −1.5) for each NP type were separately analyzed. Incubation of HDF cells with citrate Au NPs did not yield any results, and with HL Au NPs showed one significantly relevant cluster having to do with the extracellular matrix. Specific highly enriched gene ontology categories were included in Table S1 to represent relevant clusters. High percentages of up-regulated genes in both the PAH and L-PAH Au NP samples were categorized into cell cycle annotations with very high significance. Also noteworthy is that categories like extracellular matrix, cell migration, metal ion binding, polysaccharide binding, and metabolic enzyme activities were down-regulated significantly by PAH and L-PAH Au NPs. For further detail, the most significantly differentially expressed genes that fall into the cell cycle gene ontology category are provided in Figure S2.
Because the largest fold changes by far were found after PAH and L-PAH Au NP incubation, the most highly changed genes (raw p-value < 0.05) in these samples are shown in Table 3. The most highly up-regulated genes are associated with increased cell proliferation, as predicted by functional annotation analysis, but also with other oncogenic pathways. CXCL1 is related to cancer and senescence in fibroblasts, inflammation, angiogenesis and proliferation.50–52 CCNE2 is involved in the cell cycle via the G1 to S phase transition,53–54 RRM2 expression is correlated to increased cell proliferation and angiogenesis55–56 and HAS2 has been implicated in increased invasiveness of breast cancer.57 However, the negative cell cycle regulator DTL and anti-proliferative GAL and WFDC1 genes are also highly up-regulated.58–60 Additionally, the anti-angiogenic RCAN2, SERPINF1 and EFEMP1,61–63 and tumor suppressor RUNX1T1 are down-regulated.64 KLF9 is also a possible cancer biomarker when down-regulated.65–66 In contrast, the pro-angiogenic PDGFRB and PTGIS are down-regulated67–68 and the down-regulated SLC9A9 (pH regulator), TNXB and SECTM1 (CD7 ligand) are all typically up-regulated in cancerous environments as well.69–72 Decreased gene expression also occurred to genes associated with cell metabolism, such as FAXDC2, AKR1C4, AKR1C3, ADH1A, ADH1C and MAN1C1.72–74
Table 3.
Most significantly differentially expressed genes of HDF cells after incubation with PAH and L=PAH Au NPsa
| Gene Symbol | Entrez ID | Gene name | Isoelectric Pointb | Fold Change | |
|---|---|---|---|---|---|
| PAH Au NPs | L-PAH Au NPs | ||||
| KRTAP2-3 | 730755 | keratin associated protein 2–3 | 7.62 | 3.62 | 4.39 |
| CXCL1 | 2919 | chemokine (C-X-C motif) ligand 1 | 10.93 | 1.99 | 4.34 |
| CCNE2 | 9134 | cyclin E2 | 7.22 | 3.41 | 3.56 |
| DTL | 51514 | denticleless E3 ubiquitin protein ligase homolog | 9.30 | 3.34 | 3.36 |
| GAL | 51083 | galanin/GMAP prepropeptide | 7.60 | 2.14 | 3.14 |
| RRM2 | 6241 | ribonucleotide reductase M2 | 5.16 | 3.68 | 3.09 |
| FAM111B | 374393 | family with sequence similarity 111, member B | 8.53 | 2.72 | 3.01 |
| HAS2 | 3037 | hyaluronan synthase 2 | 8.52 | 3.20 | 2.59 |
| WFDC1 | 58189 | WAP four-disulfide core domain 1 | 8.20 | 3.11 | 2.14 |
|
| |||||
| RCAN2 | 10231 | regulator of calcineurin 2 | 6.61 | −3.41 | −2.16 |
| SLC9A9 | 285195 | solute carrier family 9, subfamily A (NHE9, cation proton antiporter 9), member 9 | 5.95 | −3.07 | −2.68 |
| CLEC3B | 7123 | C-type lectin domain family 3, member B | 5.42 | −3.52 | −2.79 |
| SECTM1 | 6398 | secreted and transmembrane 1 | 7.24 | −3.99 | −2.80 |
| KLF9 | 687 | kruppel-like factor 9 | 8.42 | −1.82 | −3.04 |
| FAXDC2 | 10826 | fatty acid hydroxylase domain containing 2 | 8.98 | −3.25 | −3.06 |
| AKR1C4 | 1109 | aldo-keto reductase family 1, member C4 | 6.65 | −2.91 | −3.10 |
| RUNX1T1 | 862 | runt-related transcription factor 1 | 7.80 | −1.76 | −3.13 |
| ADH1A | 124 | alcohol dehydrogenase 1A (class 1), alpha polypeptide | 7.78 | −4.16 | −3.13 |
| EFEMP1 | 2202 | EGF containing fibulin-like extracellular matrix protein 1 | 4.80 | −1.43 | −3.19 |
| AKR1C3 | 8644 | aldo-keto reductase family 1, member C3 | 7.84 | −3.41 | −3.35 |
| TNXB | 7148 | tenascin XB | 5.05 | −2.84 | −3.46 |
| SERPINF1 | 5176 | serpin peptidase inhibitor, clade F, member 1 | 6.13 | −1.46 | −3.52 |
| PDGFRB | 5159 | platelet-derived growth factor receptor, beta polypeptide | 4.72 | −1.45 | −3.71 |
| PTGIS | 5740 | prostaglandin I2 (prostacyclin) synthase | 7.07 | −2.47 | −3.96 |
| MAN1C1 | 57134 | mannosidase, alpha, class 1C, member 1 | 7.25 | −3.59 | −4.58 |
| ADH1C | 126 | alcohol dehydrogenase 1C (class 1), gamma polypeptide | 8.14 | −5.48 | −5.56 |
Genes included have a raw p-value < 0.05 and FC > 3.0 or < −3.0 in either PAH or L-PAH Au NP samples. Entries that are not significant (p > 0.05) are italicized and those that are significant are in bold.
Average theoretical isoelectric points as calculated at http://isoelectric.ovh.org.
Gene Expression Changes in PC3 Cells after Au NP Incubation
Consistent with previous analysis, DAVID functional annotation clustering for PC3 gene expression data showed more variety than with the HDF data (Table S2). There were some significant ontology clusters for citrate Au NP samples related to the down-regulation of protein ubiquitination, and many more diverse categories related to metal binding, angiogenesis, cell migration, and immune response were clustered for HL Au NP samples. PAH Au NPs down-regulated genes related to cell cycle categories and L-PAH Au NPs may have induced immune responses and affected apoptosis regulation and signal transduction of proteins involved in many pathways.
The fold changes of some of the most significantly changed genes (FC > 3.0 or <−3.0 and p < 0.05 for one type of Au NP sample) are shown in Table 4. All of the most highly up-regulated genes (with exception of C15orf48) have been associated with the NF-κB pathway, which induces inflammation and tumorigenesis at abnormal activation levels.75–79 These genes associated with inflammation and angiogenesis are typically up-regulated by both HL and L-PAH Au NPs.51,75,78,80 The L-PAH Au NPs samples showed expression level changes in genes involved in apoptosis regulation in both DAVID functional annotation analysis and by the changes induced to BCL2A1 and BAK1 genes. BCL2A1 is an anti-apoptotic protein controlled by pro-apoptotic BAK1, and their respective up- and down-regulation could signify activation of survival pathways.78 However, the anti-apoptotic RRBP1 is also highly down-regulated with PAH and L-PAH Au NPs.81 Most of the highly down-regulated genes are only down-regulated by PAH and L-PAH Au NPs. TNK2 is known to encourage prostate tumorigenesis,82–83 Some of the down-regulated genes, like SEMA3F, BAK1, and BAP1 are associated with tumor suppression.80,84–85 Many of the down-regulated genes are also associated with decreased invasion and motility, such as DDR1, ZYX, NES, and PLEC.86–90
Table 4.
Most significantly differentially expressed genes of PC3 cells after incubation with Au NPsa
| Gene Symbol | Entrez ID | Gene name | Isoelectric Pointb | Fold Change | |||
|---|---|---|---|---|---|---|---|
| citrate Au NPs | HL Au NPs | PAH Au NPs | L-PAH Au NPs | ||||
| CXCL1 | 2919 | chemokine (C-X-C motif) ligand 1 | 10.93 | 1.10 | 2.00 | −1.03 | 10.83 |
| IL8 | 3576 | interleukin 8 | 8.86 | 1.13 | 1.51 | 1.18 | 6.86 |
| HIST2H3A | 333932 | histone cluster 2, H3a | 11.57 | 1.50 | 2.97 | 1.18 | 4.25 |
| LTB | 4050 | lymphotoxin beta (TNF superfamily, member 3) | 5.11 | −1.02 | 1.38 | 1.03 | 4.13 |
| C15orf48 | 84419 | chromosome 15 open reading frame 48 | 9.99 | 1.15 | 1.13 | 1.11 | 4.04 |
| CXCL6 | 6372 | chemokine (C-X-C motif) ligand 6 | 10.40 | −1.14 | 1.26 | 1.10 | 3.85 |
| BCL2A1 | 597 | BCL2-related protein A1 | 5.15 | −1.58 | −1.05 | 1.13 | 3.54 |
| VIM | 7431 | vimentin | 4.89 | 3.00 | 1.34 | 4.51 | 2.01 |
|
| |||||||
| NEFL | 4747 | neurofilament, light polypeptide | 4.45 | −1.10 | −3.78 | 1.06 | −1.27 |
| MKNK2 | 2872 | MAP kinase interacting serine/threonine kinase 2 | 5.80 | 1.47 | −3.74 | 1.05 | −1.66 |
| ZNF768 | 79724 | zinc finger protein 768 | 7.79 | 1.13 | 1.03 | −3.52 | −3.05 |
| VSTM2L | 128434 | V-set and transmembrane domain containing 2 like | 8.64 | 1.17 | −1.04 | −2.03 | −3.15 |
| SEMA3F | 6405 | sema domain, immunoglobulin domain (Ig), short basic domain, secreted (semaphorin) 3F | 8.10 | 1.03 | −1.04 | −2.13 | −3.18 |
| BAK1 | 578 | BCL2-antagonist/killer 1 | 4.37 | 1.10 | −1.08 | −2.09 | −3.19 |
| LAMB2 | 3913 | laminin, beta 2 (laminin S) | 6.22 | −1.14 | −1.19 | −2.39 | −3.22 |
| DDR1 | 780 | discoidin domain receptor tyrosine kinase 1 | 6.54 | −1.02 | −1.06 | −1.88 | −3.23 |
| BAP1 | 8314 | BRCA1 associated protein-1 (ubiquitin carboxyl- terminal hydrolase) | 6.58 | −1.17 | 1.23 | −3.28 | −3.36 |
| ZYX | 7791 | zyxin | 7.30 | 1.14 | 1.22 | −1.93 | −3.39 |
| NES | 10763 | nestin | 4.16 | −1.00 | 1.17 | −3.43 | −3.42 |
| MIB2 | 142678 | mindbomb E3 ubiquitin protein ligase 2 | 8.27 | 1.01 | −1.34 | −1.76 | −3.51 |
| EIF4G1 | 1981 | eukaryotic translation initiation factor 4 gamma, 1 | 5.10 | −1.09 | −1.03 | −3.16 | −3.71 |
| MUC6 | 4588 | mucin 6, oligomeric mucus/gel-forming | 7.13 | −1.21 | −1.71 | −2.08 | −3.83 |
| PLEC | 5339 | plectin | 5.74 | −1.11 | 1.26 | −3.03 | −3.84 |
| TNK2 | 10188 | tyrosine kinase, non-receptor, 2 | 6.98 | 1.03 | 1.15 | −3.33 | −4.37 |
| RRBP1 | 6238 | ribosome binding protein 1 | 9.02 | −1.05 | −1.17 | −3.34 | −4.79 |
Genes included have a raw p-value < 0.05 and FC > 3.0 or < −3.0 in either PAH or L-PAH Au NP samples. Entries that are not significant (p > 0.05) are italicized and those that are significant are in bold. Pseudogenes, non-coding RNA and uncharacterized, unnamed genes not included.
Average theoretical isoelectric points as calculated at http://isoelectric.ovh.org.
In order to better analyze gene expression patterns between the different Au NP treatments, we used weighted gene co-expression network analysis (WGCNA) to divide the genes studied into groups of genes that all share the same expression pattern across the data for all treatments.42–43 WGNCA allowed the complex global heatmap to be visualized in 18 separate modules separated by patterns in gene expression (Figure 6, Modules 1–12 shown). This is especially useful because genes that share the same expression patterns across many groups are most likely co-regulated.
Fig. 6.

Heatmaps of first 12 gene modules (those containing more than 100 genes) obstained by weighted gene co-expression network analysis (within PC3 oneway ANOVA FDR p-value < 0.2, FC > 1.3 or < −1.3 between any two of the 5 groups included in analysis. Each row corresponds to one gene and columns to one sample; columns in all modules correspond to the column labels shown in Module 1. Green represents down-regulation from the mean and red is for up-regulation. Scale shown in standard deviations from the mean.
Quantitative Real-Time Polymerase Chain Reaction (qPCR): Validation of Microarray
Microarray gene expression results are commonly validated by quantitative real-time PCR (qPCR). Properly validating microarray data by qPCR is the best choice with these samples because optical signal-based assays are subject to interference by Au NPs.91 Selected genes from the list of the genes with the highest fold changes observed for HDF and PC3 cells (Tables 2 and 3, respectively) were investigated by qPCR. Because PAH and L-PAH Au NPs caused the greatest changes, genes selected were highly up- or down-regulated in these two types of samples and qPCR was only done on these samples. For HDF cells, all the genes evaluated (CXCL1, CCNE2, DTL, GAL, RRM2, WFDC1, SLC9A9, FAXDC2, ADH1A, and AKR1C3) were found to be changed the same as they were in the microarray assay. For PC3 cells incubated with PAH, most of the qPCR results (60%) were in agreement with the microarray assay (BAK1, BAP1, DDR1, LAMB2, NES, and TNK2 genes), 30% reported the same direction of change by both methods (BCL2A1 and CXCL1, down-regulation; IL8, up-regulation; p-values > 0.05), and for the LTB gene, the qPCR results showed down-regulation versus up-regulation in the microarray assay. For PC3 cells incubated with L-PAH, the qPCR results were in agreement with the microarray in 80% of the investigated genes (BCL2A1, CXCL1, DDR1, IL8, LAMB2, LTB, NES and TNK2); 20% presented the same direction of change by both methods (BAK1 and BAP1) but without statistical significance.
Although the data obtained by both methodologies (microarray and qPCR) often result in disagreement, non-agreeing data is rarely presented.92 The lack of concurrence between methods observed in our PC3 cell data for genes exhibiting low levels of change (<1.4 fold) and for genes exhibiting down-regulation has been commonly reported.92–94 The same was not observed for HDF cells, for which selected gene expression data obtained by microarray was 100% confirmed by qPCR. The microarray data was properly validated by qPCR
Effect of Au NP Surface Chemistry on Cellular Pathways
PAH and L-PAH Au NPs had the most significant effect on HDF cells and they changed similar types and numbers of genes: about two-thirds of the affected genes were commonly expressed between the two NP types. One possible mechanism involves the lability of the surface ligands. The electrostatic interaction of lipid with the underlying PAH or L-PAH Au NPs is relatively weak; lipids can dissociate from 20 nm Au NPs inside cells, as shown previously.34 This exposes the underlying PAH layer, which could result in the similar gene expression changes when compared to PAH Au NPs. In contrast, HL Au NPs had little to no effect on gene expression in HDF cells. HL Au NPs are coated with lipid by the stronger hydrophobic interaction between lipids and C18SH tails (energy of electrostatic interaction between two opposite charges in water separated by 0.5 nm is ~3.5 kJ/mol; energy of hydrophobic interaction per 2 methylene units is 6 kJ/mol).95 Only a few genes were commonly changed between both lipid-coated Au NP samples in HDF cells, suggesting that the underlying chemistry on Au NPs impacts lipid layer formation and ultimately how the cells interact with these Au NPs.
Incubation of HDF cells with PAH and L-PAH Au NPs results in the up-regulation of genes related to the cell cycle gene ontology and the down-regulation of genes belonging to extracellular matrix, cell migration, apoptosis and metabolism ontology categories. Analysis of individual genes that were highly and significantly changed by PAH and L-PAH Au NPs also highlights the enhanced activation of cell cycle and angiogenesis-related genes. However, at the same time, some anti-proliferative genes are up-regulated and some pro-angiogenic genes are down-regulated. Additionally, many changes in genes associated with cell metabolism shows that metabolism pathways were altered: this could be also be a sign of cancer progression regulation which may indicate that the cells are trying to control oncogenic processes.84 We are currently investigating the long-term effect of Au NP incubation on cells in vitro.
While it was clear from the beginning that PAH and L-PAH Au NPs elicited similar gene expression patterns in HDF cells, the heatmap patterns and functional gene categories for PC3 cells were much more complex. From Figure 4, most of the genes altered by PAH Au NPs were also altered by L-PAH Au NPs, but L-PAH Au NPs had a much larger impact, and some similarities between L-PAH and HL Au NPs were hinted at. PAH and L-PAH Au NPs both down-regulated most of the highly down-regulated genes, while HL and L-PAH Au NPs up-regulated most of the up-regulated ones (Table 3). HL and L-PAH Au NPs up-regulated inflammation and pro-angiogenic genes, and PAH and L-PAH Au NPs down-regulated tumor suppressor genes and genes associated with decreased invasion of cancer. The oncogenic pathways activated by these genes could lead to enhanced cellular inflammation and vascularization with HL and L-PAH Au NPs, increased tumorigenicity with PAH and L-PAH Au NPs and resistance to apoptosis with L-PAH Au NPs. The ability of cancer cells to proliferate, avoid apoptosis, sustain angiogenesis, invade and induce inflammatory environments are some of the hallmarks of cancer,96 and the additional induction of these pathways by any Au NPs are concerning. Again, by our analysis with both HDF and PC3 cells, citrate Au NPs appear to be relatively safe.
By looking at distinct patterns separated by WGCNA, we were able to find co-expressed sets of genes that are changed between Au NPs types (Figure 6). By using more liberal significance and fold change cut-offs, we observed more interesting patterns between Au NP types than we could with functional annotation clustering. Module 1, the most populated module with 1452 genes, showed the same basic pattern as the HDF gene expression patterns: while citrate and HL Au NPs did not greatly change gene expression from controls, PAH and L-PAH Au NPs did, in a similar fashion. This was also observed in Modules 6, 7, 9 and 10, but this is not consistent for all modules. Module 2 interestingly showed citrate Au NP-induced up-regulation with L-PAH Au NP-induced down-regulation. Modules 4, 5 and 8 showed connections between HL and L-PAH Au NPs and Module 6 showed HL Au NPs inducing the opposite effect as PAH and L-PAH Au NPs did. HL Au NPs did induce up-regulation uniquely in Module 11, showing that the changes HL Au NPs caused were not always changed by L-PAH Au NPs as well.
All together, with PC3 cells, there is a strong correlation in gene expression changes between PAH and L-PAH Au NP samples, but also between HL and L-PAH Au NP samples, and there is a set of genes that are only influenced HL Au NP samples alone. These results cannot simply be attributed to PAH exposure during to L-PAH lipid lability. While 80% of the PC3 genes changed by PAH Au NPs were also changed by L-PAH Au NPs, over three times as many genes were changed by L-PAH Au NPs than by PAH Au NPs. One possible reason for this is that electrostatics play a role, which could also explain why L-PAH and HL Au NPs would have some similar expression patterns. Both the HL and L-PAH Au NPs are initially highly negatively charged, compared to the slightly anionic citrate Au NPs and initially positively charged PAH Au NPs. PAH and HL Au NP samples also showed the opposite effect on genes in Module 5.
The possibility of an electrostatic effect inside the cells acting on gene expression is further illustrated by comparing the theoretical isoelectric points of the proteins encoded by the most highly changes genes after Au NP exposure. For PC3 cells, the average calculated isoelectric point of the up-regulated proteins is 8.36, and for the down-regulated proteins is 6.60 (Table 3). With the pH of the media being 7.32, almost two-thirds of the up-regulated proteins would be positively charged, and 70% of the down-regulated proteins would be negatively charged. This is consistent with positively charged proteins becoming adsorbed by electrostatic interactions with the negatively charged HL and L-PAH Au NPs, making these proteins less bioavailable to the cell and therefore causing up-regulation by the cell. This same correlation is observed with HDF cells, with average isoelectric points being 8.12 and 6.81 for up- and down-regulated genes in Table 2, respectively. However, this observation cannot explain why negatively-charged proteins would be down-regulated by positively-charged Au NP exposure.
Uptake levels are also different among the Au NP types for each cell type. Uptake rates, and thus Au NP concentrations inside the cells, are likely to have a large effect on the extent of gene expression differences. However, uptake rates alone do not explain gene expression patterns due to the inconsistencies between the NP/cell measurements and relative gene expression changes between Au NP types. Uptake rates themselves may be influenced by the surface chemistries of the NPs in more intricate ways that just differences in charge. One instance that could be imagined is that free lipids from L-PAH Au NPs could affect the uptake mechanism of these NPs.97
Conclusions
By making use of microarray technology to probe differentially expressed genes via RNA expression throughout the entire transcriptome combined with data mining using readily available analysis programs, the global impact of Au NPs on cells can be uncovered. In all, we have found that the surface coating of Au NPs greatly affects certain cellular processes. The up-regulation of HDF cell cycle genes when exposed to PAH and L-PAH Au NPs is a source of concern, especially in toxicology. Cell cycle genes have been used as profile genes for metastatic cancer, and CCNE2 in particular is often used as a prognostic marker for breast and prostate cancer.53,98–100 Up-regulation of CCNE2 and other genes, without proper control, can lead to genomic instabilities such as chromosomal aberrations and genetic mutations.99 However, it is encouraging that other surface coatings (citrate and HL) generated almost no transcriptomic changes at dosage levels meant to mimic environmental exposure.
With HDF cells, we have shown that while some surface modifications of Au NPs disrupt cells by inducing oncogenic pathways, other chemistries seem to be completely benign. Our findings that cells are nearly unaffected by citrate Au NPs on the level of gene expression with both HDF and PC3 cells are interesting in comparison to other published results with the same NPs. Massich et al. found similarly sized (15 nm) citrate Au NPs to be responsible for increased cell growth and apoptosis induction in HeLa at 10 nM concentrations,28 while Li et al. measured decreased cell cycle progression and increased oxidative stress in lung fibroblasts with 20 nm citrate Au NPs at 1 nM.101 Compared to Massich et al, there is almost no overlap with the genetic changes we found compared to what they found; but our data is with different cell lines, at different core gold diameters, and at much lower doses. We also found many changes induced by polyelectrolytes (PAH) when coating Au NPs, whereas Hauck et al. found no significant changes with poly(diallyldimethylammonium chloride)-coated gold nanorods (we note, however that PAH contains primary amines but the Hauck et al. polymer contains quaternary ammoniums).32 This is further evidence of the importance of cell type and dosage in determining the effect of surface-modified Au NPs on cellular transcriptome.
The effect of cell type and dosage was observed within this study. In switching from HDF to PC3 cells and 0.1 nM to 1 nM Au NP media concentrations, many more genes were changed in more intricate ways between Au NP samples. Various cancer-related pathways such as inflammation and proliferation may be activated by HL, PAH and L-PAH Au NPs in PC3 cells. Because many of the differentially expressed genes are related by pathway (i.e. NF-κB for PC3 cells) it is very difficult to tell which genes could have been changed by direct interaction with Au NPs and which are differentially expressed due to down-stream signaling from that interaction. It should also be understood that not all of these changes to gene expression will cause down-stream physiological effects. Despite this, we have shown that the underlying surface chemistry is important, possibly in terms of outer layer structure and lability, and that the initial surface charge may affect electrostatic interactions with proteins. The initial surface chemistry and Au NP dosages also determine the concentration of Au NPs inside the cells, but even the uptake rate is also dependent on cell type (i.e. PAH Au NP/cell). Overall, our results and analysis reveal a cell-specific complex relationship between surface coating and toxicity mechanism due to a combination of factors, including uptake rate, coating lability and electrostatic NP-protein interactions.
Supplementary Material
Acknowledgments
We thank Mary Majewski and Dr. Mark Band of the Carver Biotechnology Center, Functional Genomics Lab for help with microarray labeling and processing and Lou Ann Miller of the Frederick Seitz Materials Research Laboratory for transmission electron microscopy of biological samples. This work was supported by the National Science Foundation (CHE-1011980 and CHE-1306596). J.A.Y. acknowledges the J.C. Bailar Fellowship (UIUC). E.M.G. acknowledges the NIH National Cancer Institute Alliance for Nanotechnology in Cancer ‘Midwest Cancer Nanotechnology Training Center’ (R25 CA 1545015A) and the James R. Beck Fellowship (UIUC). P.F.-L. is supported by the CNPq/PROMETRO grant number 563165/2010-3.
Footnotes
Electronic Supplementary Information (ESI) available: UV-Vis spectra of Au NPs, the most significantly changed genes of HDF cells after Au NP incubation under GO accession number GO:0007049 “cell cycle”, detailed information about the primer/probe sets used for RT-PCR validation of results. See DOI:10.1039/b000000x/.
Notes and References
- 1.Dreaden EC, Alkilany AM, Huang X, Murphy CJ, El-Sayed MA. Chem Soc Rev. 2012;41:2740. doi: 10.1039/c1cs15237h. [DOI] [PMC free article] [PubMed] [Google Scholar]
- 2.Chen H, Shao L, Li Q, Wang J. Chem Soc Rev. 2013;42:2670. doi: 10.1039/c2cs35367a. [DOI] [PubMed] [Google Scholar]
- 3.Sperling RA, Parak WJ. Phil Trans R Soc A. 2010;368:1333. doi: 10.1098/rsta.2009.0273. [DOI] [PubMed] [Google Scholar]
- 4.Jiang S, Win KY, Liu S, Teng CP, Zheng Y, Han M-Y. Nanoscale. 2013;5:3127. doi: 10.1039/c3nr34005h. [DOI] [PubMed] [Google Scholar]
- 5.Murphy CJ, Gole AM, Hunyadi SE, Stone JW, Sisco PN, Alkilany A, Kinard BE, Hankins P. Chem Commun. 2008;544 doi: 10.1039/b711069c. [DOI] [PubMed] [Google Scholar]
- 6.Saha K, Agasti SS, Kim C, Li X, Rotello VM. Chem Rev. 2012;112:2739. doi: 10.1021/cr2001178. [DOI] [PMC free article] [PubMed] [Google Scholar]
- 7.Ghosh P, Han G, De M, Kim CK, Rotello VM. Adv Drug Delivery Rev. 2008;60:1307. doi: 10.1016/j.addr.2008.03.016. [DOI] [PubMed] [Google Scholar]
- 8.Rosi NL, Giljohann DA, Thaxton CS, Lytton-Jean AKR, Han MS, Mirkin CA. Science. 2006;312:1027. doi: 10.1126/science.1125559. [DOI] [PubMed] [Google Scholar]
- 9.Jaque D, Martínez Maestro L, del Rosal B, Haro-Gonzalez P, Benayas A, Plaza JL, Martín Rodríguez E, García Solé J. Nanoscale. 2014;6:9494. doi: 10.1039/c4nr00708e. [DOI] [PubMed] [Google Scholar]
- 10.Norman RS, Stone JW, Gole A, Murphy CJ, Sabo-Attwood TL. Nano Lett. 2008;8:302. doi: 10.1021/nl0727056. [DOI] [PubMed] [Google Scholar]
- 11.Huang J, Jackson KS, Murphy CJ. Nano Lett. 2012;12:2982. doi: 10.1021/nl3007402. [DOI] [PubMed] [Google Scholar]
- 12.Ng VWK, Berti R, Lesage F, Kakkar A. J Mater Chem B. 2013;1:9. doi: 10.1039/c2tb00020b. [DOI] [PubMed] [Google Scholar]
- 13.Murphy CJ, Gole AM, Stone JW, Sisco PN, Alkilany AM, Goldsmith EC, Baxter SC. Chem Res. 2008;41:1721. doi: 10.1021/ar800035u. [DOI] [PubMed] [Google Scholar]
- 14.Dreaden EC, Mackey MA, Huang X, Kang B, El-Sayed MA. Chem Soc Rev. 2011;40:3391. doi: 10.1039/c0cs00180e. [DOI] [PMC free article] [PubMed] [Google Scholar]
- 15.Cheng L-C, Jiang X, Wang J, Chen C, R-SL Nanoscale. 2013;5:3547. doi: 10.1039/c3nr34276j. [DOI] [PubMed] [Google Scholar]
- 16.Connor EE, Mwamuka J, Gole A, Murphy CJ, Wyatt MD. Small. 2005;1:325. doi: 10.1002/smll.200400093. [DOI] [PubMed] [Google Scholar]
- 17.Patra HK, Banerjee S, Chaudhuri U, Lahiri P, Dasgupta AK. Nanomed-Nanotechnol. 2007;3:111. doi: 10.1016/j.nano.2007.03.005. [DOI] [PubMed] [Google Scholar]
- 18.Soenen SJ, Manshian B, Montenegro JM, Amin F, Meermann B, Thiron T, Cornelissen M, Vanhaecke F, Doak S, Parak WJ, De Smedt S, Braeckmans K. ACS Nano. 2012;6:5767. doi: 10.1021/nn301714n. [DOI] [PubMed] [Google Scholar]
- 19.Pernodet N, Fang X, Sun Y, Bakhtina A, Ramakrishnan A, Sokolov J, Ulman A, Rafailovich M. Small. 2006;2:766. doi: 10.1002/smll.200500492. [DOI] [PubMed] [Google Scholar]
- 20.Verma A, Stellacci F. Small. 2010;6:12. doi: 10.1002/smll.200901158. [DOI] [PubMed] [Google Scholar]
- 21.Wang B, Zhang LF, Bae SC, Granick S. Proc Natl Acad Sci USA. 2008;105:18171. doi: 10.1073/pnas.0807296105. [DOI] [PMC free article] [PubMed] [Google Scholar]
- 22.Tatur S, Maccarini M, Barker R, Nelson A, Fragneto G. Langmuir. 2013;29:6606. doi: 10.1021/la401074y. [DOI] [PubMed] [Google Scholar]
- 23.Lewinski N, Colvin V, Drezek R. Small. 2007;4:26. doi: 10.1002/smll.200700595. [DOI] [PubMed] [Google Scholar]
- 24.Sisco PN, Wilson CG, Chernak D, Clark JC, Grzincic EM, Ako-Asare K, Goldsmith EC, Murphy CJ. PLoS One. 2014;9:e86670. doi: 10.1371/journal.pone.0086670. [DOI] [PMC free article] [PubMed] [Google Scholar]
- 25.Yang Y, Qu Y, Lü X. J Biomed Nanotechnol. 2010;6:234. doi: 10.1166/jbn.2010.1128. [DOI] [PubMed] [Google Scholar]
- 26.Schaeublin NM, Braydich-Stolle LK, Maurer EI, Park K, MacCuspie RI, Afrooz ARMN, Vaia RA, Saleh NB, Hussain SM. Langmuir. 2012;28:3248. doi: 10.1021/la204081m. [DOI] [PubMed] [Google Scholar]
- 27.Jiang W, Kim BYS, Rutka JT, Chan WCW. Nat Nanotechnol. 2008;3:145. doi: 10.1038/nnano.2008.30. [DOI] [PubMed] [Google Scholar]
- 28.Massich MD, Giljohann DA, Schmucker AL, Patel PC, Mirkin CA. ACS Nano. 2010;4:5641. doi: 10.1021/nn102228s. [DOI] [PMC free article] [PubMed] [Google Scholar]
- 29.Grabinski C, Schaeublin N, Wijaya A, D’Cuoto H, Baxamusa SH, Hamad-Schifferli K, Hussain SM. ACS Nano. 2011;5:2870. doi: 10.1021/nn103476x. [DOI] [PubMed] [Google Scholar]
- 30.Sharma M, Salisbury RL, Maurer EI, Hussain SM, Sulentic CEW. Nanoscale. 2013;5:3747. doi: 10.1039/c3nr30071d. [DOI] [PMC free article] [PubMed] [Google Scholar]
- 31.Khan JA, Pillai B, Das TK, Singh Y, Maiti S. ChemBioChem. 2007;8:1237. doi: 10.1002/cbic.200700165. [DOI] [PubMed] [Google Scholar]
- 32.Hauck TS, Ghazani AA, Chan WCW. Small. 2008;4:153. doi: 10.1002/smll.200700217. [DOI] [PubMed] [Google Scholar]
- 33.Yang JA, Murphy CJ. Langmuir. 2012;28:5404. doi: 10.1021/la300325p. [DOI] [PubMed] [Google Scholar]
- 34.Yang JA, Lohse SE, Murphy CJ. Small. 2014;10:1642. doi: 10.1002/smll.201302835. [DOI] [PubMed] [Google Scholar]
- 35.Van Schooneveld MM, Vacic E, Koole R, Zhou Y, Stocks J, Cormode DP, Tang CY, Gordon RE, Nicolay K, Meijerink A, Fayad ZA, Mulder WJ. Nano Lett. 2008;8:2517. doi: 10.1021/nl801596a. [DOI] [PubMed] [Google Scholar]
- 36.R Development Core Team. R: A Language and Environment for Statistical Computing. R Foundation for Statistical Computing; Vienna, Austria: 2013. [Google Scholar]
- 37.Smyth GK. In: Bioinformatics and Computational Biology Solutions using R and Bioconductor. Gentleman R, Cary V, Dudoit S, Irizarry R, Huber W, editors. Springer; New York: 2005. pp. 397–420. [Google Scholar]
- 38.Smyth GK, Speed T. Methods. 2003;31:265. doi: 10.1016/s1046-2023(03)00155-5. [DOI] [PubMed] [Google Scholar]
- 39.Smyth GK. Stat Appl Genet Mol Biol. 2004;3:article 3. [Google Scholar]
- 40.Smyth GK, Michard J, Scott HS. Bioinformatics. 2005;21:2067. doi: 10.1093/bioinformatics/bti270. [DOI] [PubMed] [Google Scholar]
- 41.Benjamini Y, Hochberg Y. J Roy Stat Soc B Stat Meth. 1995;57:289. [Google Scholar]
- 42.Zhang B, Horvath S. Stat Appl Genet Mol Biol. 2004;4:article 17. [Google Scholar]
- 43.Langfelder P, Horvath S. BMC Bioinf. 2008;9:article 559. doi: 10.1186/1471-2105-9-559. [DOI] [PMC free article] [PubMed] [Google Scholar]
- 44.Huang DW, Sherman BT, Lempicki RA. Nat Protoc. 2009;4:44. doi: 10.1038/nprot.2008.211. [DOI] [PubMed] [Google Scholar]
- 45.Huang DW, Sherman BT, Lempicki RA. Nucleic Acids Res. 2009;37:1. doi: 10.1093/nar/gkn923. [DOI] [PMC free article] [PubMed] [Google Scholar]
- 46.Vandesompele J, De Preter K, Pattyn F, Poppe B, Van Roy N, De Paepe A, Spelema F. Genome Biol. 2002;3:research0034. doi: 10.1186/gb-2002-3-7-research0034. [DOI] [PMC free article] [PubMed] [Google Scholar]
- 47.Van Maerken RA, Pattyn F, Van Peer G, Beckers A, De Brouwer S, Kumps C, Mets E, Van der Meulen J, Rondou P, Leonelli C, Mestdagh P, Speleman F, Vandesompele J. PLoS One. 2013;8:e71776. doi: 10.1371/journal.pone.0071776. [DOI] [PMC free article] [PubMed] [Google Scholar]
- 48.Ringnér M. Nat Biotechnol. 2008;26:303. doi: 10.1038/nbt0308-303. [DOI] [PubMed] [Google Scholar]
- 49.Yang JA, Phan HT, Vaidya S, Murphy CJ. Nano Lett. 2013;13:2295. doi: 10.1021/nl400972r. [DOI] [PubMed] [Google Scholar]
- 50.Yang G, Rosen DG, Zhang Z, Bast RC, Jr, Mills GB, Colacino JA, Mercado-Uribe I, Liu J. Proc Natl Acad Sci USA. 2006;103:16472. doi: 10.1073/pnas.0605752103. [DOI] [PMC free article] [PubMed] [Google Scholar]
- 51.Romagnani P, Lasagni L, Annunziato F, Serio M, Romagnani S. Trends Immunol. 2004;25:201. doi: 10.1016/j.it.2004.02.006. [DOI] [PubMed] [Google Scholar]
- 52.Begley LA, Kasina S, MacDonald J, Macoska JA. Cytokine. 2008;43:194. doi: 10.1016/j.cyto.2008.05.012. [DOI] [PMC free article] [PubMed] [Google Scholar]
- 53.Gudas JM, Payton M, Sushil T, Chen E, Bass M, Robinson MO, Coats S. Mol Cell Biol. 1999;19:612. doi: 10.1128/mcb.19.1.612. [DOI] [PMC free article] [PubMed] [Google Scholar]
- 54.Caldon CE, Musgrove EA. Cell Div. 2010;5:2. doi: 10.1186/1747-1028-5-2. [DOI] [PMC free article] [PubMed] [Google Scholar]
- 55.Engstrom Y, Eriksson S, Jildevik I, Skog S, Thelander L, Tribukait B. J Biol Chem. 1985;260:9114. [PubMed] [Google Scholar]
- 56.Zhang K, Hu S, Wu J, Chen L, Lu J, Wang X, Liu X, Zhou B, Yen Y. Mol Cancer. 2009;8:article 11. doi: 10.1186/1476-4598-8-11. [DOI] [PMC free article] [PubMed] [Google Scholar]
- 57.Udabage L, Brownlee GR, Nilsson SK, Brown TJ. Exp Cell Res. 2005;310:205. doi: 10.1016/j.yexcr.2005.07.026. [DOI] [PubMed] [Google Scholar]
- 58.Jin J, Arias EE, Chen J, Harper JW, Walter JC. Mol Cell. 2006;23:709. doi: 10.1016/j.molcel.2006.08.010. [DOI] [PubMed] [Google Scholar]
- 59.Bauer JW, Lang R, Jakab M, Kofler B. Cell Mol Life Sci. 2008;65:1820. doi: 10.1007/s00018-008-8156-5. [DOI] [PMC free article] [PubMed] [Google Scholar]
- 60.Madar S, Brosh R, Buganim Y, Ezra O, Goldstein I, Solomon H, Kogan I, Goldfinger N, Klocker H, Rotter V. Carcinogenesis. 2009;30:20. doi: 10.1093/carcin/bgn232. [DOI] [PMC free article] [PubMed] [Google Scholar]
- 61.Gollogly LK, Ryeom SW, Yoon SS. J Surg Res. 2007;142:129. doi: 10.1016/j.jss.2006.10.011. [DOI] [PMC free article] [PubMed] [Google Scholar]
- 62.Dawson DW, Vopert OV, Gillis P, Crawford SE, Xu H-J, Benedict W, Bouck NP. Science. 1999;285:245. doi: 10.1126/science.285.5425.245. [DOI] [PubMed] [Google Scholar]
- 63.Sadr-Nabavi A, Ramser J, Volkmann J, Naehrig J, Weismann F, Betz B, Hellebrand H, Engert S, Seitz S, Kreutzfeld R, Sasaki T, Arnold N, Schmutzler R, Kiechle M, Niederacher D, Harbeck N, Dahl E, Meindl A. Int J Cancer. 2009;124:1727. doi: 10.1002/ijc.24108. [DOI] [PubMed] [Google Scholar]
- 64.Yeh K-T, Chen T-H, Yang H-W, Chou J-L, Chen L-Y, Yeh C-M, Chen Y-H, Lin R-I, Su H-Y, Chen GCW, Deatherage DE, Huang Y-W, Yan PS, Line H-J, Nephew KP, Huang TH-M, Lai H-C, Chan MWY. Epigenetics. 2011;6:727. doi: 10.4161/epi.6.6.15856. [DOI] [PMC free article] [PubMed] [Google Scholar]
- 65.Kang L, Lü B, Xu J, Hu H, Lai M. Pathol Int. 2008;58:334. doi: 10.1111/j.1440-1827.2008.02233.x. [DOI] [PubMed] [Google Scholar]
- 66.Black AR, Black JD, Azizkhan-Clifford J. J Cell Physiology. 2001;188:143. doi: 10.1002/jcp.1111. [DOI] [PubMed] [Google Scholar]
- 67.Carmeliet P. Nature. 2005;438:932. doi: 10.1038/nature04478. [DOI] [PubMed] [Google Scholar]
- 68.Berquin IM, Edwards IJ, Kridel SJ, Chen YQ. Cancer Metastasis Rev. 2011;30:295. doi: 10.1007/s10555-011-9299-7. [DOI] [PMC free article] [PubMed] [Google Scholar]
- 69.Chiche J, Brahimi-Horn MC, Pouyssegur J. J Cell Mol Medicine. 2010;14:771. doi: 10.1111/j.1582-4934.2009.00994.x. [DOI] [PMC free article] [PubMed] [Google Scholar]
- 70.Sottile J. Biochim, Biophys Acta, Rev Cancer. 2004;1654:13. doi: 10.1016/j.bbcan.2003.07.002. [DOI] [PubMed] [Google Scholar]
- 71.Wang T, Ge Y, Xiao M, Lopez-Coral A, Li L, Roesch A, Huang C, Alexander P, Vogt T, Xu X, Hwang WT, Lieu M, Belser E, Liu R, Somasundaram R, Herlyn M, Kaufman RE. J Invest Dermatol. 2014;134:1108. doi: 10.1038/jid.2013.437. [DOI] [PMC free article] [PubMed] [Google Scholar]
- 72.Salmon CR, Tomazela DM, Ruiz KGS, Foster BL, Leme AFP, Sallum EA, Somerman MJ, Nociti FH., Jr J Proteomics. 2013;91:544. doi: 10.1016/j.jprot.2013.08.016. [DOI] [PMC free article] [PubMed] [Google Scholar]
- 73.Penning TM, Drury JE. Arch Biochem Biophys. 2007;464:241. doi: 10.1016/j.abb.2007.04.024. [DOI] [PMC free article] [PubMed] [Google Scholar]
- 74.Edenberg HJ. Alcohol Res Health. 2007;30:5. [PMC free article] [PubMed] [Google Scholar]
- 75.Aggarwal BB. Cancer Cell. 2004;6:203. doi: 10.1016/j.ccr.2004.09.003. [DOI] [PubMed] [Google Scholar]
- 76.Yamamoto Y, Verma UN, Prajapati S, Kwak Y-T, Gaynor RB. Nature. 2003;423:655. doi: 10.1038/nature01576. [DOI] [PubMed] [Google Scholar]
- 77.Mackay F, Majeau GR, Hochman PS, Browning JL. J Biol Chem. 1996;271:24934. doi: 10.1074/jbc.271.40.24934. [DOI] [PubMed] [Google Scholar]
- 78.Vogler M. Cell Death Differ. 2012;19:67. doi: 10.1038/cdd.2011.158. [DOI] [PMC free article] [PubMed] [Google Scholar]
- 79.Zhang Q, Helfand BT, Jang TL, Zhu LJ, Chen L, Yang XJ, Kozlowski J, Smith N, Kundu SD, Yang G, Raji AA, Javonovic B, Pins M, Lindholm P, Guo Y, Catalona WJ, Lee C. Clin Cancer Res. 2009;15:3557. doi: 10.1158/1078-0432.CCR-08-1656. [DOI] [PubMed] [Google Scholar]
- 80.Hehlgans T, Stoelcker B, Stopfer P, Müller P, Cernaianu G, Guba M, Steinbauer M, Nedospasov SA, Pfeffer K, Männel DN. Cancer Res. 2002;62:4034. [PubMed] [Google Scholar]
- 81.Tsai H-Y, Yang Y-F, Wu AT, Yang C-J, Liu Y-P, Jan Y-H, Lee C-H, Hsiao Y-W, Yeh C-T, Shen C-N, Lu PJ, Huang MS, Hsiao M. Oncogene. 2013;32:4921. doi: 10.1038/onc.2012.514. [DOI] [PubMed] [Google Scholar]
- 82.Mahajan NP, Whang YE, Mohler JL, Earp HS. Cancer Res. 2005;65:10514. doi: 10.1158/0008-5472.CAN-05-1127. [DOI] [PubMed] [Google Scholar]
- 83.Mahajan K, Mahajan NP. Cancer Lett. 2013;338:185. doi: 10.1016/j.canlet.2013.04.004. [DOI] [PMC free article] [PubMed] [Google Scholar]
- 84.Beuten J, Garcia D, Brand TC, He X, Balic I, Canby-Hagino E, Troyer DA, Baillargeon J, Hernandez J, Thompson IM, Leach RJ, Naylor SL. J Urol. 2009;182:1614. doi: 10.1016/j.juro.2009.06.016. [DOI] [PubMed] [Google Scholar]
- 85.Ventil KH, Devi NS, Friedrich KL, Chernova TA, Tighiouart M, Van Meir EG, Wilkinson KD. Cancer Res. 2008;68:6953. doi: 10.1158/0008-5472.CAN-08-0365. [DOI] [PMC free article] [PubMed] [Google Scholar]
- 86.Shimada K, Nakamura M, Ishida E, Higuchi T, Yamamoto H, Tsujikawa K, Konishi N. Cancer Sci. 2007;99:39. doi: 10.1111/j.1349-7006.2007.00655.x. [DOI] [PMC free article] [PubMed] [Google Scholar]
- 87.Van der Gaag EJ, Leccia MT, Dekker SK, Jalbert NL, Amodeo DM, Byers HR. J Invest Dermatol. 2002;118:246. doi: 10.1046/j.0022-202x.2001.01657.x. [DOI] [PubMed] [Google Scholar]
- 88.Sy SM-H, Lai PB-S, Pang E, Wong NL-Y, To K-F, Johnson OJ, Wong N. Modern Path. 2006;19:1108. doi: 10.1038/modpathol.3800626. [DOI] [PubMed] [Google Scholar]
- 89.Kleeberger W, Bova GS, Nielsen ME, Herawi M, Chuang A-Y, Epstein JI, Berman DM. Cancer Res. 2007;67:9199. doi: 10.1158/0008-5472.CAN-07-0806. [DOI] [PMC free article] [PubMed] [Google Scholar]
- 90.Katada K, Tomonoaga T, Satoh M, Matsushita K, Tonoike Y, Kodera Y, Hanazawa T, Nomura F, Okamoto Y. J Proteomics. 2012;75:1803. doi: 10.1016/j.jprot.2011.12.018. [DOI] [PubMed] [Google Scholar]
- 91.Ong KJ, MacCormack TJ, Clark RJ, Ede JD, Ortega VA, Felix LC, Dang MKM, Ma G, Fenniri H, Veinot JGC, Goss GG. PLoS One. 2014;9:e90650. doi: 10.1371/journal.pone.0090650. [DOI] [PMC free article] [PubMed] [Google Scholar]
- 92.Morey JS, Ryan JC, Van Dolah FM. Biol Proced Online. 2006;8:175. doi: 10.1251/bpo126. [DOI] [PMC free article] [PubMed] [Google Scholar]
- 93.Rajeevan MS, Vernon SD, Taysavang N, Unger ER. J Mol Diagn. 2001;3:26. doi: 10.1016/S1525-1578(10)60646-0. [DOI] [PMC free article] [PubMed] [Google Scholar]
- 94.Wurmback E, Yuen T, Sealfon SC. Methods. 2003;31:306. doi: 10.1016/s1046-2023(03)00161-0. [DOI] [PubMed] [Google Scholar]
- 95.Gao J, Bender CM, Murphy CJ. Langmuir. 2003;19:9065. [Google Scholar]
- 96.Mantovani A. Nature. 2009;457:36. doi: 10.1038/457036b. [DOI] [PubMed] [Google Scholar]
- 97.Nativo P, Prior IA, Brust M. ACS Nano. 2008;2:1639. doi: 10.1021/nn800330a. [DOI] [PubMed] [Google Scholar]
- 98.Thomassen M, Tan Q, Eiriksdottir F, Bak M, Cold S, Kruse TA. Int J Cancer. 2006;120:1070. doi: 10.1002/ijc.22449. [DOI] [PubMed] [Google Scholar]
- 99.Caldon CE, Sergio CM, Kang J, Muthukaruppan A, Boersma MN, Stone A, Barraclough J, Lee CS, Black MA, Miller LD, Gee JM, Nicholson RI, Sutherland RL, Print CG, Musgrove EA. Mol Cancer Ther. 2012;11:1488. doi: 10.1158/1535-7163.MCT-11-0963. [DOI] [PubMed] [Google Scholar]
- 100.Markaverich BM, Vijjeswarapu M, Shoulars K, Rodriguez M. J Steroid Biochem Mol Biol. 2010;122:219. doi: 10.1016/j.jsbmb.2010.06.006. [DOI] [PMC free article] [PubMed] [Google Scholar]
- 101.Li JJ, Zou L, Hartono D, Ong C-N, Bay N-H, Lanry Yung L-Y. Adv Mater. 2007;20:138. [Google Scholar]
Associated Data
This section collects any data citations, data availability statements, or supplementary materials included in this article.