

Abstract
Deep mutational scanning marries selection for protein function to high-throughput DNA sequencing in order to quantify the activity of variants of a protein on a massive scale. First, an appropriate selection system for the protein function of interest is identified and validated. Second, a library of variants is created, introduced into the selection system and subjected to selection. Third, library DNA is recovered throughout the selection and deeply sequenced. Finally, a functional score for each variant is calculated based on the change in the frequency of the variant during the selection. This protocol describes the steps that must be carried out to generate a large-scale mutagenesis data set consisting of functional scores for up to hundreds of thousands of variants of a protein of interest. Establishing an assay, generating a library of variants, and carrying out a selection and its accompanying sequencing takes on the order of 4–6 weeks; the initial data analysis can be completed in 1 week.
INTRODUCTION
Mutagenesis paradigms include targeted, systematic and random mutagenesis. Targeted mutagenesis examines a limited number of protein variants with a specific question in mind. Targeted mutagenesis has the advantage of requiring only a small number of variants, but it necessitates that the experimenter has some idea of which mutations will be informative. Systematic mutagenesis removes this limitation by examining an unbiased library of variants. An early example of systematic mutagenesis is the alanine scan1, in which each position of a protein is sequentially mutated to alanine. Examining the functional consequences of each alanine mutation one by one can reveal residues that are important (e.g. contact positions in a protein–protein interaction). Systematic mutagenesis is still limited in scope when variants are tested individually. This limitation was overcome by the use of pools of mutants that were selected en masse for a property of interest and Sanger-sequenced to determine which mutations had an impact on function2. Unlike targeted and systematic mutageneses, which analyze a relatively small number of variants, random mutagenesis begins with a large library (105–1011) of protein variants and relies on selection for function to winnow the population to a small number of ‘winners’. Sanger sequencing reveals the identity of these winner variants.
Although powerful, these approaches are limited in their scope to examining, at most, hundreds of protein variants. This limitation arises principally from the requirement that variants must be Sanger-sequenced. In fact, the average human protein, approximately 350 amino acids in length, can yield 7,000 single mutations and over 22 million double mutations3. To overcome this limitation, we developed deep mutational scanning4,5, a technique that combines selection with high-throughput DNA sequencing. To conduct a deep mutational scan, the experimenter constructs a library of tens to hundreds of thousands of variants of some protein and imposes a selection for function (Figure 1). Unlike a traditional selection experiment, the selection pressure applied is modest, so that it does not cause the diversity of the protein library to collapse to only a few variants. Under such conditions, variant frequencies are perturbed according to the function of each variant; variants harboring beneficial mutations increase in frequency, whereas variants harboring deleterious mutations decrease in frequency. High-throughput DNA sequencing measures the frequency of each variant during the selection experiment, and a functional score is calculated from the change in frequency over the course of the experiment. The result is a large-scale mutagenesis data set containing a functional score for each variant in the library. This method has been used to select for peptide binding, substrate binding, catalysis, and stability, and it can use a variety of procedures to separate variants of differing activity, including growth-based selections as well as fluorescent-activated cell sorting (FACS) to separate variants of differing activity. For an in-depth discussion of applications of deep mutational scanning, we refer the reader to a perspective focused on these issues6.
Figure 1. Deep mutational scanning workflow.

A deep mutational scan starts with a library of variants of a protein (left panel). These variants are expressed in a system that links the sequence of each variant to the functional capacity of the variant (e.g. phage display or plasmids in yeast cells). Then, the library is subjected to selective pressure for the function of the protein (middle panel). Selective pressure increases the frequency of variants with enhanced activity (middle panel, red and black lines) and decreases the frequency of variants with diminished activity (middle panel, blue and purple lines). High-throughput DNA sequencing is used to quantify the frequency of each variant in the library throughout the selection. An activity score is derived from the change in frequency for each variant (right panel). In the example shown, only two time points are used to calculate the functional score. Multiple time points can be collected and analyzed by regression. In cases where a variant present in the input library is not observed in the selected library, the experimenter can add a single read pseudo-count for each drop-out variant in the post-selection data. This pseudo-count will enable the experimenter to calculate enrichment ratios for drop-out variants.
Protocol overview and experimental design
A deep mutational scan comprises five conceptual parts: choosing and validating a selection scheme, creating a diversity library, imposing a selection on that library, deeply sequencing the library before and after the selective pressure has been applied, and analyzing the resulting data to calculate functional scores for variants. A wide variety of specific experimental designs fit within this rubric. Here, we provide general guidelines for navigating the choices faced by the experimenter. In the Procedure, we focus on two examples: a short protein in a phage-display format selected for its binding to a peptide, and a longer protein selected on the basis of its requirement for viability of yeast. First, we provide a general explanation of how deep mutational scanning can be applied to various proteins and selection systems.
Choosing and validating a selection system
The only absolute requirement of any selection system is that it physically links the DNA encoding each protein variant to the protein itself. Diverse experimental paradigms fall within the confines of this requirement. These paradigms include protein display methods, like phage display, in which each variant is displayed on the surface of the phage such that the DNA encoding the variant is contained within the phage DNA7. Protein display methods are especially effective when the experimenter wishes to select for protein–protein or protein–DNA binding. For example, protein display has been used to conduct deep mutational scans of protein–peptide4,8–11, protein–protein12–14 and protein–small molecule15 interactions.
More complex protein functions, such as catalysis or drug resistance, often call for cell-based assays. In these assays, each cell expresses a variant that is subjected to functional selection. In one example, a deep mutational scan of a yeast degron was conducted using a cell-based reporter consisting of a fusion of the degron to a metabolic enzyme16. The growth of cells carrying each variant depended on the intracellular concentration of the metabolic enzyme, which, in turn, depended on the stability of the degron variant fused to it. Other cell-based assays have been developed to select for toxin activity17, chaperone activity18 or drug resistance19,20. Developing a selection system can seem daunting, but combing the literature can be the most effective first step. In many cases, the protein in question has already been studied using an assay that is compatible with the present protocol.
Before its use in a deep mutational scan, a selection system must be thoroughly vetted. Although selection systems may be very different in practical terms, a common checklist of validation experiments can be followed. These experiments necessitate that clones are available encoding the wild-type protein as well as at least one other variant whose activity is altered. Ideally, the variant in question lacks activity entirely, a null variant. By comparing the performance of the wild type with that of a null variant, the experimenter evaluates the performance of the selection scheme. For example, if the selection is phage binding, elution titers of the wild type and null variants can be compared. If the selection is yeast growth, the doubling times of the yeasts carrying the wild type and null variants can be compared. A no-selection control is also performed in these vetting experiments, in which the selection pressure is removed (e.g. by binding the phage to beads without ligand or by growing yeast under conditions that do not require the activity of the mutagenized protein). In this control experiment, the wild type and null variant should perform equally. Selection conditions should be modified to optimize the difference in behavior between the wild type and null variant.
Once a phenotypic difference is observed under selection (e.g. if the wild-type phage binds better or the wild-type yeast grows faster), then a mixing experiment is conducted. Here, the two variants are mixed together and the selection experiment repeated. Then, Sanger-sequencing is performed on the starting mixture and during the selection experiment. Comparing the peak area in the sequencing data21 for each variant at the positions that are different between the two variants reveals the fraction of each variant in the mixture. If the relative proportion of the two fractions trends in the ‘desired’ direction as the assay proceeds, this experiment validates that the selection pressure will operate as expected in a mixed population. In addition, the degree of selection required to eliminate the null variant can be used as a guide for the degree of selection to be applied to the diversity library (e.g. the number of rounds of phage display or the number of generations of yeast growth).
Designing and creating a diversity library
With a selection system in hand, the next step is to construct and clone a diversity library. The size of the region that can be mutagenized was initially limited to 25 amino acids by the short read length associated with high-throughput DNA sequencers4. Currently, the practical limit for a single library using the Illumina platform is just over 300 amino acids, provided that subassembly methods are used22. In subassembly, a unique DNA barcode is associated with each mutagenized region. Barcode-directed assembly of paired reads enables accurate assembly of sequences up to ~1,000 nucleotides (Figure 2). In addition to enabling deep mutational scanning of longer regions23, subassembled libraries also provide internal replication because each protein variant can be linked to more than one unique barcode. If the region of interest is larger than what can be achieved with subassembly, multiple distinct libraries can be created to tile across the region of interest24.
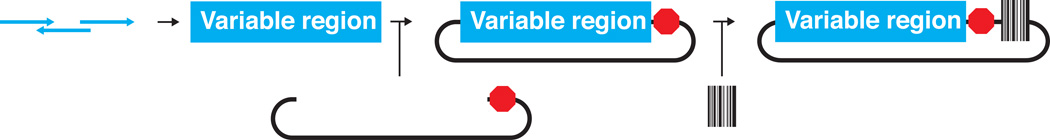
Figure 2. Variable library sequencing methods.

A deep mutational scan can be conducted using either direct sequencing of the variable region or subassembly of the variable region. (a) In direct sequencing, the variable region (three variants are depicted in blue, green and purple; the red octagon indicates the stop codon) is amplified using primers that append Illumina-compatible cluster generation sequences (gold). Overlapping, paired-end reads are acquired and the frequency of each variant in the library is calculated (the solid line indicates the sequencing primer annealing site, the dotted line indicates the acquired sequencing read). (b, c) In subassembly, each variant is identified by a unique DNA barcode. First, the variable region is amplified (a single variant is shown in blue; the red octagon indicates the stop codon) using a set of primers that tile across the variable region. These primers generate amplicons of differing lengths that contain Illumina-compatible cluster generation sequences (gold) (b, left panel). Next, each a read pair is acquired from each amplicon; one reads the barcode and the other reads a part of the variable region (b, middle panel, the solid line indicates the sequencing primer annealing site, the dotted line indicates the acquired sequencing read). All partial variable region reads associated with each barcode are collected from the high throughput sequencing data and aligned, producing a full-length sequence of the variable region associated with each barcode. The result is a barcode lookup table (b, right panel). To measure the frequency of each barcode in a library, barcodes are first amplified (three barcodes are depicted in blue, green and purple) using a set of primers that append Illumina-compatible cluster generation sequences (gold) (c). Each barcode is sequenced and the frequency of each barcode is calculated (c, the solid line indicates the sequencing primer annealing site, the dotted line indicates the acquired sequencing read). Finally, the full-length variable region associated with each barcode is identified using the barcode lookup table.
Many mutagenesis methods can be used to construct diversity libraries, including those based on error-prone PCR, oligonucleotide-directed mutagenesis25,26 or degenerate oligonucleotide assembly23. Each of these methods has distinct advantages and disadvantages. Error-prone PCR is easily implemented and can be used to mutagenize long (several kilobase) regions of interest. However, it results in a highly biased library, since certain types of mutations are favored and the extent of mutagenesis can be difficult to control. Thus, error-prone PCR is appropriate when a long region must be mutagenized, but it should be avoided if possible, because of the biased distribution of mutations it produces. Oligonucleotide-directed mutagenesis methods have recently been parallelized25. They enable the construction of large libraries of singly-mutated variants but cannot be used to construct libraries of multiply mutated variants without further DNA shuffling. Single-mutant variant libraries have the distinct advantage of being much smaller than libraries of multiple mutants, thereby reducing downstream sequencing costs. However, analysis of multiply mutated variants can reveal protein properties6. Oligonucleotide assembly methods, empowered by the advent of Gibson assembly27, are effective at creating randomly mutagenized libraries with precisely controlled levels of mutagenesis. However, synthetic oligonucleotides are prone to synthesis errors, such that single-base deletions can make up a large proportion of a library longer than a few hundred nucleotides. Thus, oligonucleotide assembly is appropriate if the experimenter wishes to analyze multiply mutated variants, provided the target sequence is not too long.
Diversity libraries that focus on the order of 10 or fewer positions can also be constructed and analyzed8,9,18. Here, the experimenter chooses a small number of positions of interest to mutagenize, often guided by the structure of the protein. Positions of interest could include a protein binding site, catalytic positions or a substrate-binding pocket. By restricting the number of positions to be mutagenized, this strategy enables the experimenter to increase the degree of mutagenesis. Constructing a focused library is not possible with error-prone PCR. Synthetic oligonucleotide-based strategies, which enable the mutagenesis of specific codons, are required instead.
If a random mutagenesis method is chosen, the experimenter must employ a degree of mutagenesis that will result in the desired number of mutations per library member. Deep mutational scanning can exhaustively explore the single and, potentially, the double mutant space around the average-sized human protein, but owing to the geometric increase of possible sequences as the number of mutations grows, the approach rapidly loses the power to be exhaustive. Thus, ideal deep mutational scanning libraries are relatively similar to the wild-type sequence, with each variant carrying only a few mutations. The average number of mutations per variant is specified by the percentage of non-wild-type base doped into each coupling reaction during DNA synthesis. For example, an average of two mutations per variant would result from synthesizing a 100-nucleotide-long variable region with a 2% mutagenesis rate28. Because mutagenesis is a random process, the number of mutations per variant will be Poisson distributed. The result is that if an average of two mutations per variant selected, ~14% of variants in the library will be wild-type, 27% will be singly mutated, 27% will be doubly mutated, and the remainder will have three or more mutations. We prefer to use libraries generated at this level of mutagenesis because they yield good coverage of singly mutated variants while also containing a large number of multiply mutated variants. However, the experimenter must carefully consider the goals of his or her experiment when choosing a mutagenesis level.
Transforming and selecting the library
Care must be taken when transforming the diversity library into the system that will be used for selection. The experimenter should decide ahead of time how many variants to include in the experiment; this choice is guided by the amount of sequencing that will be performed. To accurately capture negative changes in variant frequency, each variant should be covered by at least 100 reads in the initial library. Hence, a library of 100,000 variants would require 107 reads for adequate coverage. The experimenter should limit the size of the diversity library such that the appropriate number of variants is transformed. To ensure adequate sampling of the diversity library, at least ten times as many transformants as library members should be obtained.
Another important requirement of the present protocol is making sure that each phage or cell in the selection experiment harbors one and only one variant. In phage, each particle contains one genome, which makes the possibility of multiple protein variants encoded in each phage less of a concern29. Although yeast, on the other hand, can be transformed with two plasmids simultaneously, such double transformation events are relatively rare. Nevertheless, the frequency of double transformation should be measured. Other selection systems, such as lentivirally-transformed mammalian cells, will require careful adjustment to ensure that each cell encodes only one protein variant.
After transformation, the phage or cell library should remain free of selective pressure until the selection experiment is initiated so that the level of diversity does not decrease. A sample of the initial library mixture should be set aside and not undergo the selection experiment, and samples from the library under selection should be collected periodically as the experiment progresses. The selection experiment should be carried out until completion (i.e. until a few variants dominate).
Deep mutational scanning data can be noisy, depending on the selection and sequencing schemes employed. Thus, the experimenter should include at least one biological replicate. Replicate data can be used to eliminate erratically behaving variants, and increases the accuracy of the functional scores. The experimenter may also wish to include a no-selection control, in which the library is grown in the absence of selective pressure. No-selection controls are useful for identifying variants whose expression is toxic (or beneficial) in the absence of selection; they can also be used to estimate the frequency of variant loss due to drift. Running replicates and controls can be costly. A strategy for minimizing cost is to, first, identify the level of reproducibility desired (e.g. identifying deleterious variants vs. rigorous quantification of functional scores). Then, collect a number of replicate and control samples simultaneously, sequence one set of replicates and use the results to guide further investment. If a single replicate does not give the desired level of reproducibility, additional replicates can be sequenced.
Sequencing DNA libraries
In principle, any high-throughput sequencing platform can be used to conduct a deep mutational scan. Library preparation methods will differ between platforms and diversity library designs, but there are general guidelines. The first major challenge faced in library sequencing is to obtain high-quality sequences. Although sequencing quality has improved, error rates as high as 1% are possible30,31. The result of these error rates is that careless experimental design can lead to a rate of fictitious mutations that is as high as the rate of intentional mutagenesis. To deal with this concern, the experimenter has several strategies available. If the mutagenized region is small, paired end reads can be used to generate double coverage, dramatically reducing error rates4. If the mutagenized region is large, subassembly can be used to reduce error rates22,23. Thus, a sequencing strategy must be selected that leads to an acceptably low error rate.
After a sequencing strategy has been selected, sequencing-compatible libraries must be made from DNA collected at each time point in the selection experiment. A high-fidelity polymerase should be used to minimize the introduction of errors. Additionally, care must be taken to avoid excessive PCR amplification, which can introduce library biases. Even high-fidelity polymerases induce mutations, which can be problematic depending on the sequencing design chosen. For example, if only a single read per DNA molecule is acquired, polymerase error can be a non-trivial source of noise. To assess mutations introduced by amplification or sequencer error, it is helpful to sequence a non-mutagenized region or to include wild-type control DNA in the downstream processing steps. PCR can also cause the formation of chimeras when long, highly homologous sequences are amplified. The result is a scrambling of variant identities, which adds noise to the data. Subassembly eliminates chimeras because only short, random barcodes are amplified after selection. Scouting qPCR experiments should be conducted to identify the minimal number of amplification cycles needed. Generally speaking, amplifications should be halted before or just after they enter the exponential phase.
Preliminary low- or medium-throughput sequencing experiments can guide the choice of time points at which to perform high-throughput sequencing. For example, 10 or more clones from samples collected at each time point can be Sanger-sequenced, or library DNA can be spiked into a high-throughput DNA sequencing run to produce a few thousand reads. In either case, the point at which the library converged to a small number of variants can be determined, indicating that earlier time points should be the focus of high-throughput sequencing.
Analyzing the data
The goal of data analysis is to produce a set of high-quality functional scores for each variant in the library. Enrich, a software package written for this purpose, transforms raw sequencing data into variant functional scores32 (Figure 3A). Overlapping reads are combined and each read is quality-filtered (average QPhred >20). Variants are identified and counted in the starting library and the library after selection (Figure 3B). Variant counts in each library are normalized to the total number of reads for that library, producing a frequency for each variant in each library. Conversion from counts to frequencies is important to facilitate comparison between libraries sequenced to disparate depths. A functional score is calculated by dividing the frequency of each variant after the selection experiment by the frequency of the variant before the experiment (Figure 3C, D). This basic analysis, enabled by Enrich, is a starting point. Enrich can be adapted to deal with more complex experimental designs, including those that take advantage of subassembly23 or that incorporate multiple time points33.
Figure 3. Using the Enrich software to analyze deep mutational scanning data.

(a) The Enrich workflow. Enrich is designed with a modular architecture; each step in the list corresponds to a module in the software. Enrich produces three visualizations; examples from the data set included with Enrich are shown in panels b–d. (b) The diversity within a library is illustrated by a heatmap of the frequency of each position–mutation combination. (c) The position-averaged change in mutational frequency between two libraries. (d) The log2-scaled enrichment ratio for each position-mutation combination is plotted, individually organized both by position and by amino acid (a single amino acid, serine, is shown). Blue dots indicate the enrichment or depletion of substitutions. Red squares correspond to wild-type residues. Grey squares correspond to unobserved mutations. Figure and text partially reproduced32.
Limitations
Deep mutational scanning is a powerful method for generating large-scale mutagenesis data sets, but it has certain limitations. Deep mutational scanning cannot be applied to every protein. For proteins without a clear molecular function, or those with complex functions, designing selection schemes is challenging. The use of short read, high-throughput sequencing currently limits the size of the region that can be mutagenized to a maximum of ~300 amino acids. This limit, which initially stood at a mere 25 amino acids, has become less stringent over time, and the expectation is that its severity will continue to diminish in the face of further advances in sequencing. Proteins with more than 300 amino acids can still be fully analyzed if they are broken into parts24, although this approach adds cost and complexity. Finally, the number of variants that can be examined is limited in part by the cost of sequencing and in part by the physical constraints of model systems. The limitations associated with sequencing cost will continue to decrease in severity. However, the physical constraints are unlikely to change dramatically. For example, obtaining more than a few million yeast transformants is likely to remain difficult.
Scope of the protocol
Deep mutational scanning can be applied to a wide variety of proteins using different library creation methods and selection schemes. The validation of any given selection scheme is highly specific and is therefore outside of the scope of this protocol. The Procedure describes the steps common to all deep mutational scans, including library creation, selection, high throughput sequencing and data analysis. We focus on a protocol for a phage-based deep mutational scan similar to several that have been conducted4,9. At points where the protocol would differ substantially from one that uses a phage selection, we provide alternative instructions for a yeast-based deep mutational scan24. We suggest the experimenter read these publications for the details of selection schemes, library sizes, sequencing and data analysis. We refer the reader to published methods for phage and yeast display34,35.
MATERIALS
Reagents
CRITICAL: All media and reagents should be prepared by standard methods, and should be stored as recommended by the manufacturers. All enzymes should be stored at −20 °C. Chemically competent bacteria, bacteria stocks, phage lysate stocks and yeast stocks should be stored at −80 °C. Unless otherwise noted, reagents should be stored at room temperature, 25 °C. Unless otherwise noted, all water is treated using a Barnstead NanoPure system and then autoclaved. Unless otherwise specified, all oligonucleotides (e.g. amplification and sequencing) are ordered from IDT with no special purification. Unless otherwise noted, restriction enzymes are ordered from NEB and used as directed by the manufacturer.
-
Variable synthetic oligonucleotide, PAGE purified (Trilink Biosciences)
CRITICAL: The primary problem when working with long synthetic DNA oligonucleotides is single-base deletions arising from incomplete coupling during synthesis. This problem is compounded when multiple oligonucleotides are assembled. To reduce the frequency of deletions, all oligonucleotides should be PAGE-purified by the company that synthesized the oligonucleotide, if this option is available.
T4 DNA Ligase (New England Biolabs, cat. no. M2020)
T4 DNA Ligase buffer, 10X (New England Biolabs, cat. no. B0202)
T7 Select 10-3 Cloning kit (EMD Millipore, cat. no. 70550)
Deoxyribonucleotide triphosphates (dNTPs, 100mM each nucleotide, Qiagen, cat. no. 201913)
Nuclease-free water (Ambion cat. no AM9937)
Library Quantification kit – Illumina/Lightcycler 480 (Kapa Biosystems, cat. no. KK4854)
Taq 2X Master Mix (New England Biolabs, cat. no. M0271)
Gibson Assembly Master Mix (New England Biolabs, cat. no. E2611)
Phusion High-Fidelity Polymerase (Fisher Scientific, cat. no. F-530)
DNA polymerase I, large (Klenow) fragment (New England Biolabs, cat. no. M0210)
One-Shot Top 10 F’ Chemically Competent E. coli (Life Technologies, cat. no. C3030-03)
NanoLink Streptavadin Magnetic Beads 0.8 µm (Solulink, cat. no. M-1002)
SuperBlock Blocking buffer in PBS (Pierce Biotechnology, cat. no. 37515)
Zymolyase 20T (Zymo Research, cat. no. E1004)
DTT (Sigma-Aldrich, cat. no. 43819)
Phenol:chloroform:isoamyl alcohol 25:24:1 (Sigma-Aldrich, cat. no. P3803)
Chloroform (Sigma-Aldrich, cat. no. C2432)
Dimethyl sulfoxide (DMSO) (Sigma-Aldrich, cat. no. D4540)
GlycoBlue (Life Technologies, cat. no. AM9515)
Lithium acetate dihydrate (Sigma-Aldrich, cat. no. L6883)
Yeast extract (Sigma-Aldrich, cat. no. Y1625)
Tryptone (Sigma-Aldrich, cat. no. T7293)
Bacto peptone (Sigma-Aldrich, cat. no. P0556)
Adenine hemisulfate salt (Sigma-Aldrich, cat. no. A9126)
Yeast nitrogen base without amino acids and ammonium sulfate (Sigma-Aldrich, cat. no. Y1251)
Yeast synthetic drop-out medium supplements without leucine (Sigma-Aldrich, cat. no. Y1376)
Bacto agar (Sigma-Aldrich, cat. no. A5306)
Sodium hydroxide (Sigma-Aldrich, cat. no. 221465)
Ammonium sulfate (Sigma-Aldrich, cat. no. A4418)
L-Amino acids (Sigma-Aldrich, cat. no. LAA21)
Glucose (Sigma-Aldrich, cat. no. G8270)
Glycerol (Sigma-Aldrich, cat. no. G5516)
Salmon sperm DNA (Life Technologies, cat. no. 15632-011)
NEB CutSmart Buffer (10x, with 100x BSA; New England Biolabs, cat. no. B7200S)
EcoRI-HF restriction endonuclease (New England Biolabs, cat. no. R3195)
HindIII-HF restriction endonuclease (New England Biolabs, cat. no. R3104)
Sodium chloride (Sigma-Aldrich, cat. no. S3014)
Glacial acetic acid (Sigma-Aldrich, cat. no. 695092)
Sodium acetate (Sigma-Aldrich, cat. no. 236500)
Sodium dodecyl sulfate (SDS) (Sigma-Aldrich, cat. no. L4390)
Trizma base (Sigma-Aldrich, cat. no. T1503)
Boric acid (Sigma-Aldrich, cat. no. B6768)
Hydrochloric acid (Sigma-Aldrich cat. no. 258148)
Biotin (Sigma-Aldrich, cat. no. B4501)
Magnesium chloride (Sigma-Aldrich, cat. no. M9272)
Absolute ethanol (Sigma-Aldrich, cat. no. E7023)
Ethylenediaminetetraacetic acid (EDTA) (Sigma-Aldrich, cat. no. EDS)
Ampicillin (Sigma-Aldrich, cat. no. A9518)
UltraPure agarose (Life Technologies cat. no. 16500500)
100X BSA (New England Biolabs, cat. no. B9000)
Alkaline phosphatase, calf intestinal (CIP) (New England Biolabs, cat. no. M0290)
Sybr Safe (Life Technologies cat. no. S33102)
QiaPrep Spin Miniprep kit (Qiagen, cat. no. 27106)
Qiaquick Gel Extraction kit (Qiagen, cat. no. 28706)
Qiaquick PCR Purification kit (Qiagen, cat. no. 28104)
GenElute HP Plasmid Midiprep kit (Sigma-Aldrich, cat. no. NA0200)
DNA Clean and Concentrate kit (Zymo Research cat. no. D4004)
pGEM-T Easy Vector System (Promega, cat. no. A1360)
Biotin-labeled peptide substrate, disulfide linked. The peptide sequence depends in the protein displayed by the experimenter. (AnaSpec)
Equipment
4 °C refrigerator (Fisher Scientific, cat. no. MH49PA-GAEE-FS)
−20 °C freezer (Haier HCR17W 1.7 Cubic Feet Refrigerator/Freezer, White)
−80 °C freezer (Thermo TSU −86 600 Box freezer, Fisher Scientific, cat. no. TSU600DRAK)
16 x 150 mm Culture tubes (ISC BioExpress, cat. no. T-6011-16X150)
Culture tube caps (VWR, cat. no. 16199-010)
Semi-micro cuvettes (ISC BioExpress, cat. no. 613-101)
0.2 mL PCR tubes (ISC BioExpress, cat. no. T-3014-2)
Autoclave (Consolidated Stills and Sterilizers, cat. no. PT-SR-24C)
Petri dishes (VWR, cat. no. 55411-055)
Thermocycler (Fisher Scientific, cat. no. TCA4848)
Agarose gel electrophoreses system (Bio-Rad, cat. no. 1704483)
Razor blades (VWR, cat. no. 55411.055)
Water bath set to 42 °C (Fisher Scientific, cat. no. 15-462-5Q)
Shaker incubators set to 30 and 37 °C (Fisher Scientific, cat. no. SHKA4000)
Microfuge tubes (1.7 mL, ISC BioExpress, cat. no. C-3260-1)
Conical tubes (15 mL, ISC BioExpress, cat. no. C-3394-2)
5 Prime Phase Lock Gel Heavy 2ml (5 Prime, cat. no. 2302830)
Nanodrop 2000c spectrophotometer (Fisher Scientific, cat. no. ND-2000c)
Microfuge (Fisher Scientific, cat. no. 13-688-369)
Centrifuge (Fisher Scientific, cat. no.97040-382)
Swinging Bucket Rotor (Fisher Scientific, cat. no. 75003607)
LightCycler 480 (Roche Applied Science, cat. no. 5015197001)
DR Transillumiator (Clare Chemical Research, cat. no. DR22A)
Barnstead Nanopure diamond (ThermoScientific, cat. no. D11931)
pH meter (Fisher Scientific cat. no. 13-620-451 or equivalent)
Computer or computing cluster with the Enrich32 and SolexaQA38 software installed
Reagent Setup
Lithium acetate, 1.0 M solution
Dissolve 102 g of lithium acetate in water to a final volume of 1 l; adjust pH to 7.5 with dilute acetic acid (5:95 acetic acid:water). Autoclave and store at room temperature for up to a year.
sodium acetate, 3.0 M solution
Combine 408.1 g sodium acetate with 500 ml of water and adjust to pH 5.2 with glacial acetic acid. Bring the total volume to 1 l using water. Autoclave and store at room temperature for up to a year.
10% (wt/vol) SDS
Add water to 100 g of SDS to a total volume of 1 l. Autoclave and store at room temperature for up to a year.
10X TBE
Dissolve 108 g of Trizma base, 50 ml of 0.5 M EDTA (pH 8.0) and 55 g of boric acid in water; adjust pH to 7.5 with dilute acetic acid (5:95 acetic acid:water). Bring up to 1 l with water, autoclave and store at room temperature for up to a year.
1% TBE gel
Add 1 g of UltraPure agarose to 100 ml of 1x TBE and microwave until agarose crystals disappear (~1.5 min). Allow to cool slightly, add Sybr Safe and pour into gel apparatus. Store in an air-tight container away from light for no more than a week
Electrocompetent cells
Streak bacteria (One-Shot Top 10 F’ E. coli) from frozen stock on an LB plate and grow overnight at 37 °C. Inoculate a large colony in 5 ml of LB media and grow for ~18 h at 37 °C. Dilute the 5-ml starter into 500 ml of 18 °C pre-chilled LB and grow at 18 °C to an OD600 of 0.4 with shaking (200 rpm, ~14 h). From this point on keep everything on ice. Pre chill centrifuge to 4 °C. Split culture into two centrifuge bottles and harvest cells by centrifugation at 3,000 xg, for 15 min at 4 °C. Discard supernatant and resuspend bacterial pellet in 200 ml of 4 °C water. Centrifuge at 3,000 xg, for 15 min at 4 °C. Repeat the washing step then discard supernatant. Resuspend each bacterial pellet in 10 ml of 4 °C water and combine in a single 50-ml tube. Centrifuge at 3,000 xg, for 15 min at 4 °C and discard supernatant. Resuspend the bacterial pellet in 800 µl of 7% (vol/vol) DMSO solution (744 µl water + 56 µl DMSO). Transfer 41-µl aliquots of the suspension just prepared into pre-chilled −20°C tubes (total of ~30 tubes), snap freeze in liquid nitrogen and store at −80 °C for up to 1 month.
Amplicillin stock solution
Dissolve 100 mg of ampicillin in 1 ml of water and store at −20 °C for up to 1 year.
LB medium
Combine 10 g of tryptone, 5 g of yeast extract, 5 g of sodium chloride, and 1 ml of 4 M sodium hydroxide, and bring the total volume to 1 l using water. Autoclave. Before opening, store at room temperature for no longer than three months. Once opened, store at 4 °C for no longer than one month.
LB plates
Combine 10 g of tryptone, 5 g of yeast extract, 5 g of sodium chloride, 1 ml of 4 M sodium hydroxide, and 14 g of Bacto agar and bring the total volume to 1 l using water. Autoclave, after medium has cooled, and pour into platesStore at 4 °C for no longer than one month.
LB + ampicillin medium
Combine 10 g of tryptone, 5 g of yeast extract, 5 g of sodium chloride, and 1 ml of 4 M sodium hydroxide, and bring the total volume to 1 l using water. Autoclave and add ampicillin to a final concentration of 100 µg/ml after medium has cooled. Store at 4 °C for no longer than one month.
LB + ampicillin plates
Combine 10 g of tryptone, 5 g of yeast extract, 5 g of sodium chloride, 1 ml of 4 M sodium hydroxide, and 14 g of Bacto agar and bring the total volume to 1 l using water. Autoclave, add ampicillin to a final concentration of 100 µg/ml after medium has cooled, and pour into plates. Store at 4 °C for no longer than one month.
YPD Plates
Combine 20 g of Bacto peptone, 10 g of yeast extract and 14 g of Bacto agar and bring the total volume to 1 l using water. Autoclave and pour into plates. Store at 4 °C for no longer than one month.
SC dropout medium
This defined complete yeast media lacks one or more metabolites, used to select for the marker on the plasmid chosen by the experimenter. SC dropout media can be purchased from Sigma Aldrich (e.g. Y1376). Prepare and store according to the manufacturers instructions.
SC dropout plates
This defined complete yeast media lacks one or more metabolites, used to select for the marker on the plasmid chosen by the experimenter. SC dropout media can be purchased from Sigma Aldrich (e.g. Y1376). 1 l of liquid media can be combined with 17 g of Bacto agar and autoclaved to make SC dropout plates. Store at 4 °C for no longer than one month.
20% (wt/vol)_Glucose
Weigh 200 g of glucose and dissolve with water to a final volume of 1 l. Autoclave and store at room temperature for no more than 3 months.
YPAD
Combine 10 g of yeast extract, 20 g of Bacto peptone, and 10 mg of adenine hemisulfate salt. Bring the total volume to 0.9 l using water and autoclave. Add 100 ml 20% (wt/vol) glucose to bring volume to 1 l. Store at 4 °C for no longer than one month.
2X YPAD
Combine 20 g of yeast extract, 40 g of Bacto peptone, and 20 mg adenine hemisulfate salt. Bring the total volume to 0.9 l using water and autoclave. Add 100 ml of 20% (wt/vol) glucose to bring volume to 1 l. Store at 4 °C for no longer than one month.
10X TE
Combine 100 ml of 1 M Trizma base and 20 ml of 0.5 M EDTA (pH 8.0). Bring the total volume to 1 l using water and autoclave. Store at room temperature for up to a year.
2 mg/ml denatured salmon sperm DNA
Combine 100 µl of 10 mg/ml salmon sperm DNA, 50 µl of 10X TE, and 350 µl water. Boil for 10 min and store at −20 °C for up to 1 year.
Phage wash buffer
Add 0.3 g Trizma base to 50 ml water and pH to 7.2 using hydrochloric acid. Add 0.88 g sodium chloride 100 ul Tween-20, then add water to 100 ml. Store at 4 °C for no longer than one month.
PROCEDURE
CRITICAL: Deep mutational scanning can be applied to a multitude of proteins in the context of diverse selection systems, but many core steps of the protocol are shared. Therefore, we demonstrate deep mutational scanning using two exemplary cases: a phage-displayed short protein domain4 and a longer protein sequenced by subassembly and assayed for activity in yeast24. Whenever the protocol differs between the two approaches, we detail alternative procedural options that apply to the two cases.
Generating diversity libraries TIMING ~ 2 weeks
- Generate a double-stranded clonable DNA fragment from a single-stranded variable oligonucleotide according to option A, if the purpose of the experiment is to prepare a phage display of a short protein encoded in the oligonucleotide library, or to option B, if the purpose is to assay the activity of the relatively long encoded protein in yeast. Please note that if the purpose of the experiment is to obtain a T7 phage display (option A), EcoRI and HindIII restriction sites will be required for cloning. Other selection schemes (e.g. other phage, plasmids, etc.) will require the experimenter to identify the appropriate sites.
- Generating a double-stranded variable region from a single variable synthetic oligonucleotide
- Render the variable synthetic oligonucleotide double-stranded by annealing and extending a short, complementary primer. For this purpose, prepare the reaction mixture detailed in Table 1.
- Raise the temperature of the reaction mixture to 98 °C for 3 min and prompt the annealing of primer to the variable oligonucleotide by cooling to 4 °C at a rate of 0.1 °C per second.
- Add to the reaction mixture the thermosenstive components reported in Table 2 and incubate at 37 °C for 30 min.
- Generating a double-stranded variable region from multiple synthetic oligonucleotides
- Assemble purified, single-stranded oligonucleotides using the Gibson Assembly Master Mix kit according to the manufacturer’s instructions. Use an equal mixture of the variable synthetic oligonucleotides with a total of 0.2-1 pmols oligonucleotide per 20 µl of Gibson assembly mixture. If overlapping regions of the variable synthetic oligonucleotides are mutagenized, a drop in the number of mutations in these regions can be observed upon high-throughput sequencing. However, if the level of mutagenesis is such that the chance of having two or more mutations in a single overlapping region is low, loss of mutations in these regions should be negligible (Figure 4).
- Purify the amplified product on an agarose gel using the Qiaquick Gel Extraction kit for gel purification according to the manufacturer’s instructions to recover DNA from excised bands. The result should be at least 10 ng of recovered product
-
Ligate the double stranded variable oligonucleotide into the T7 phage genome (option A) or into a plasmid for yeast expression (option B).
- Phage ligation
- Digest the double stranded variable oligonucleotide with EcoRI-HF and HindIII-HF to generate complementary, cohesive ends by preparing the reaction mixture detailed in Table 5 and incubating it at 37 °C for 2 h.
- Load and purify the digested double stranded variable oligonucleotide on an agarose gel using the Qiaquick Gel Extraction kit according to the manufacturer’s instructions to recover DNA from excised bands. At least 10 ng of product should be recovered.
- Ligate the digested double stranded variable oligonucleotide into the phage genome using the T7 Select 10-3 Cloning kit according to the manufacturer’s instructions.
-
Ligation into a plasmid for yeast expression
-
i
Separately digest the target plasmid and double stranded variable oligonucleotide to generate complementary, cohesive ends.
-
ii
Prepare two separate reaction mixtures, one for the plasmid and one for the double stranded variable oligonucleotide as detailed in Table 6 and incubate them at 37 °C for 2 h.
-
iii
Add 1 µl of CIP to the digested plasmid and incubate at 37 °C for 1 more hour.
-
iv
Purify the digested vector and double stranded variable oligonucleotide on agarose gels using the Qiaquick Gel Extraction kit according to the manufacturer’s instructions to recover DNA from excised bands.
-
v
Ligate digested insert and vector using T4 DNA ligase according to the manufacturer’s instructions.
-
vi
Transform the ligation product into Top 10 F’ electrocompetent cells and prepare ligated plasmids using a GenElute HP Plasmid Midiprep kit according to the manufacturer’s instructions. The number of unique transformants before amplification should be quantified carefully by plating a small volume of the transformation reaction and counting the resulting number of colonies. The number of variants in the library corresponds to the total number of transformants.
-
vii
At this point, the number of variants in the plasmid library should be reduced as desired by restrictive transformation into competent E. coli. Use competent cell transformation efficiency as determined with a control plasmid to estimate the amount of library plasmid necessary to produce the desired number of transformants.
CRITICAL STEP: Libraries generated by random mutagenesis (e.g. doped oligonucleotide synthesis or error-prone PCR) can contain extremely large numbers of variants28. Therefore, these libraries must be reduced in complexity before selection to ensure an adequate number of sequencing reads per variant (no less than 100). For example, if each sample will be allocated 1x10⁷ reads, the library should contain no more than 1x10⁵ variants.
-
viii
Owing to the unpredictable nature of transformations, it is useful to perform additional transformations at both double and half of the calculated amount of plasmid. Transform all three amounts of plasmid into chemically competent E. coli cells, add the transformed cells to 5 ml of media containing the appropriate restrictive antibiotic. Plate an appropriate dilution of each mixture onto appropriately selective plates and count colonies after 18 hours to determine the total number of transformants. Isolate plasmid DNA from the transformation with the appropriate number of transformants using the QiaPrep Spin Miniprep kit according to the manufacturer’s instruction.
-
ix
To facilitate subassembly of libraries that cannot be covered with short read sequencing, a unique barcode must be added to each variant. The barcode should be inserted after the stop codon to prevent any effects on expression. This objective is achieved using a short, double-stranded DNA oligonucleotide containing, for example, an 18-base pair degenerate barcode and restriction sites compatible with the destination plasmid (see below and Figure 2). Begin with a single-stranded barcode synthetic oligonucleotide containing a constant region to facilitate priming and extension to create the double-stranded oligonucleotide. The barcode oligonucleotide should contain sufficient constant flanking sequence to facilitate amplification, but should otherwise be as close to the variable region as possible. To generate the double-stranded barcode oligonucleotide, assemble a reaction mixture containing a synthetic single-stranded barcode oligonucleotide and a short primer according to the instructions in Table 7, denature the mixture at 98 °C for 3 min and anneal by cooling to 4 °C at a rate of 0.1 °C per second.
-
x
Add to the reaction mixture prepared in step ix the thermosensitive components detailed in Table 8 and incubate at 37 °C for 30 min.
-
xi
Purify product using the Clean and Concentrate kit according to the manufacturer’s instructions
-
xii
In two separate reactions digest both the target plasmid containing the variable library (produced in step 2B viii) and the double-stranded barcode oligonucleotide (produce in step 2Bxi) to generate complementary, cohesive ends. Prepare reaction mixtures containing the components reported in Table 9 and incubate at 37 °C for 2 h.
-
xiii
Add 1 µl of CIP to the digested vector and incubate at 37 °C for 1 more hour. Purify the digested vector and insert on an agarose gel using the Qiaquick Gel Extraction kit according to the manufacturer’s instructions to recover DNA from excised bands.
-
xiv
Ligate digested insert and vector using T4 DNA ligase according to the manufacturer’s instructions.
-
xv
Transform the ligation product into Top 10 F’ electrocompetent cells and prepare ligated plasmids using a GenElute HP Plasmid Midiprep kit according to the manufacturer’s instructions. The number of unique transformants before amplification should be quantified carefully by plating a small volume of the transformation reaction and counting the number of colonies. The number of barcoded variants in the library corresponds to the total number of transformants.
-
xvi
At this point, the library should be reduced to the desired number of barcoded variants by restrictive transformation into chemically competent E. coli. This step will determine the number of unique barcodes per variant. Using the competent cell transformation efficiency, estimate the amount of plasmid necessary to produce the desired number of transformants.
-
xvii
Owing to the unpredictable nature of transformations, it is useful to perform additional transformations at both double and half of the calculated amount of plasmid. Transform all three amounts of plasmid into chemically competent E. coli cells, add the transformed cells to 5 ml of media containing the appropriate restrictive antibiotic. Plate an appropriate dilution of each mixture onto appropriately selective plates and count colonies to determine the total number of transformants. Isolate plasmid DNA from the transformation with the appropriate number of transformants using the QiaPrep Spin Miniprep kit according to the manufacturer’s instruction.
-
i
- Package ligated phage genome (option A) or transform ligated plasmid into yeast (option B)
- Packaging, amplifying and preserving the phage library
- Package ligated phage DNA using the T7 Select 10-3 Cloning kit according to the manufacturer’s instructions. The number of packaged phage should be measured before amplification by titering as directed by the manufacturer. The number of packaged phage corresponds to the number of unique library clones.
- To amplify packaged phage library, start a 5 mL overnight culture of BLT5403 E. coli (included in kit) in LB + ampicillin medium. Back dilute the overnight culture at a 1:1000 ratio and grow with shaking at 37 °C until an OD600 of ~0.5 is reached. Add the remainder of packaged phage to culture and wait for cell lysis (2–4 h).
-
Preserve amplified library by freezing 1 ml aliquots of library supplemented with 20% (vol/vol) glycerol.PAUSE POINT: Frozen phage libraries can be stored at −80 °C for up to 1 year. Before amplification, the thawed frozen stock should be titered to determine whether diversity has been lost.
- Transforming the plasmid library into yeast and preparing a frozen stock of the transformed yeast
- From a frozen stock, streak out the yeast strain to be used in the selection on a non-selective YPD plate and allow to grow for at least 3 d.
- Using a single colony, inoculate 5 ml of YPAD medium and incubate overnight at 30 °C shaking at 200 rpm.
- Pre-warm 50 ml of 2x YPAD in a 500-ml flask, then add to it one ml of the overnight culture from step ii and incubate at 30 °C and 200 rpm in an orbital shaker until the cell density reaches ~2 x 10⁷ cells/ml as determined by measuring the OD600 using the NanoDrop spectrophotometer. Most yeast have ~3 x 10⁷ cells in a 1 ml culture at OD600 = 1; this number can be precisely determined using a microscope and a hemocytometer though such precise quantification is not necessary for this protocol.
- Using the culture grown in iii, prepare competent yeast cells using the high-efficiency LiAc protocol36.
- Add 1 µg in 20 ul of nuclease free water of plasmid library DNA created in step 2B xvi to 340 µl competent yeast cells obtained in step 3B iv, vortex vigorously for 30 s, heat shock in a 42 °C water bath for 40 min, then centrifuge at 10,000 xg for 30 s at room temperature, remove supernatant and then resuspend in 1 ml of water sterile water.
-
Transfer the suspension from step 3B v into 50 ml of selective SC dropout medium, and collect 0.5-µl, 5-µl and 50-µl aliquots from it. Plate these aliquots on selective SC dropout plates and grow for 3 d at 30 °C. Count the number of colonies to quantify the number of transformants obtained.Troubleshooting: see Table 12
-
Grow the culture from step vi at 4 °C, shaking at 200 rpm to log phase (OD600 = 0.5), then centrifuge at 10,000 xg for 30 s and resuspend in selective SC dropout medium with 20% (vol/vol) glycerol for freezing such that the number of cells in 1 ml is at least 100 times the number of library clones. Freeze the resuspended cells in 1-ml aliquots by immersion in liquid nitrogen and then transfer to −80 °C. Plate 0.5, 5 and 50 µl of this mixture on selective SC dropout plates before and after freezing and grow at 30 °C for ~ 3 d. Confirm that each tube contains a sufficient number of viable cells by counting the number of colonies on the plates and calculating the total number of viable cells remaining after freezing.PAUSE POINT: Transformed yeast libraries frozen as directed are stable for years at −80 °C. However, after thawing, 0.5, 5 and 50 µl aliquots of the libraries should be plated on selective SC dropout plates and the resulting colonies counted to ensure that a sufficient number yeast have survived, preserving library diversity.
Table 1.
Variable Oligonucleotide Primer Annealing
| Component | Volume (µl) | Final concentration |
|---|---|---|
| NEB CutSmart buffer (10x) |
10 | 1 x |
| Variable Oligonucleotide (100 µM) |
2 | 2 µM |
| Complementary Primer (250 µM) |
20 | 50 µM |
| Nuclease free Water | 65 | – |
Table 2.
Variable Oligonucleotide Primer Extension
| Component | Volume per reaction (µl) | Final concentration |
|---|---|---|
| dNTPs (25 mM) | 2 | 500 µM |
| Klenow polymerase (5,000 U/ml) |
1 | 5 Units |
Figure 4. Creating a barcoded library from Gibson-assembled oligonucleotides.
Several single-stranded oligonucleotides are combined into one double-stranded DNA fragment using Gibson assembly (left panel). This fragment is cloned into a suitable plasmid (middle panel) and then reduced in complexity to the desired number of protein variants. Finally, a unique DNA barcode is added to each library member (right panel) and the library is reduced in complexity to the desired number of barcodes per protein variant.
Table 3.
PCR Amplification of Gibson Assembled Variable Oligonucleotides
| Component | Volume (µl) | Final concentration |
|---|---|---|
| Taq 2X Master Mix (2x) | 50 | 1x |
| Amplification Primers (10 µM) |
10 of each | 10 µM |
| MgCl2 (10 mM) | 1.25 | 125 µM |
| Gibson assembly product from step 1B i. |
10 | - |
| Nuclease free water | 18.75 | – |
Table 4.
Taq PCR Thermocycle
| Cycle number |
Denaturation | Annealing | Polymerization | Final |
|---|---|---|---|---|
| 1 | 5 min at 95 °C | 15 s at 50 °C | 1 min kb−1 at 68 °C | |
| 2–20 | 10 s at 95 °C | 15 s at 50 °C | 1 min kb−1 at 68 °C | |
| 21 | 10 s at 95 °C | 15 s at 50 °C | 5 min at 68 °C | |
| Hold | 4 °C |
Table 5.
Double Stranded Variable Oligonucleotide Digestion for Phage Ligation
| Component | Volume (µl) | Final concentration |
|---|---|---|
| Digested variable oligonucleotide |
Entire amount produced (at least 10 ng) |
|
| NEB CutSmart Buffer (10x) | 2 | 1x |
| BSA (10x) | 2 | 1x |
| Nuclease free water | To a total volume of 20 | – |
| EcoRI-HF (10,000 units/ml) | 0.5 | 5 Units |
| HindIII-HF(10,000 units/ml) | 0.5 | 5 Units |
Table 6.
Digestion of Double Stranded Variable Oligonucleotide or Yeast Plasmid
| Component | Volume (µl) | Final concentration |
|---|---|---|
| DNA | Plasmid (~1 µg) or double stranded variable oligonucleotide (at least 10 ng) |
Variable |
| NEB CutSmart Buffe (10x) |
2 | 1x |
| Water | To a total volume of 20 µL | – |
| Restriction Enzyme 1 (10,000 units/ml) |
0.5 µl | 5 Units |
| Restriction Enzyme 2 (10,000 units/ml) |
0.5 µl | 5 Units |
Table 7.
Barcode Synthetic Oligonucleotide Primer Annealing
| Component | Volume (µl) | Final concentration |
|---|---|---|
| NEB buffer (10 x) | 4 | 1 x |
| Barcode Synthetic Oligonucleotide (25 µM) |
4 | 2.5 µM |
| Complementary Primer (25 µM) |
4 | 2.5 µM |
| Nuclease free | 26 | – |
Table 8.
Barcode Oligonucleotide Primer Extension
| Component | Volume (µl) | Final concentration |
|---|---|---|
| dNTPs (1 mM) | 1.4 | 35 µM |
| Klenow polymerase (5000 U/ml) |
0.8 | 4 Units |
Table 9.
Digestion of Double Stranded Barcode Oligonucleotide or Yeast Plasmid
| Component | Volume (µl) | Final concentration |
|---|---|---|
| DNA | Plasmid (~1 µg) or double stranded barcode oligonucleotide (at least 10 ng) |
Variable |
| NEB buffer (10x) | 2 | 1x |
| Nuclease free water | To a total volume of 20 µL | – |
| Restriction Enzyme 1 (10,000 units/ml) |
0.5 µLµl | 5 Units |
| Restriction Enzyme 2 (10,000 units/ml) |
0.5 µLµl | 5 Units |
Table 12.
Troubleshooting
| Step | Problem | Possible reason | Solution |
|---|---|---|---|
| 1B iii | Gibson assembly results in fragments lacking one or more oligonucleotides |
Overlap regions are too short or Gibson assembly is inefficient |
Increase the length of overlap regions |
| 2B vi | Insufficient number of E. coli transformants |
Poor ligation efficiency |
Optimize ligation efficiency by varying the insert:vector ratio between 3:1 and 1:3 |
| Poor transformation efficiency |
Use a control plasmid to measure transformation efficiency of competent cells. If low, order fresh cells |
||
| 3B vi | Insufficient number of yeast transformants |
Poor transformation efficiency |
Optimize transformation36 by varying the plasmid DNA concentration and heat shock time |
| 6B xiii | Insufficient number of plasmids recovered |
Poor recovery | Use fewer yeast per extraction and more total extractions |
| 8 | Multiple bands generated when amplifying libraries |
Nonspecific primer annealing |
Increase annealing temperature or pick alternate primer sets |
| 8 | No product by 20 cycles |
Inefficient PCR conditions |
Try alternate high fidelity polymerases, increasing template concentration or adding adulterants (e.g. Mg2+, DMSO, BSA, etc) |
| 14 | Low sequencing quality |
Biased libraries like the ones often generated by deep mutational scans can cause low quality |
Mix the biased library with unbiased DNA to ensure sequencing quality |
| 19 | Enrich identifies variants with very large numbers of mutations |
Incorrect configuration parameters regarding wild-type sequence and read start and/or end |
Ensure the wild- type sequence and the read start and end parameters are correct |
| 20 | Low correlation of variant enrichment ratios between replicate samples |
Insufficient quality filtration |
Increase the average quality score parameter and filter the output data to remove variants with fewer than 10 counts in the input library |
Library selection and DNA extraction TIMING ~2 weeks
-
4
Prepare libraries for selection according to option A, if working with phage libraries, or option B, if working with yeast libraries.
-
Phage re-amplification and library complexity adjustment
To adjust the number of unique phage in the library, first titer the library to accurately measure PFU/ml according to the T7 Select 10-3 Cloning kit instructions. Then infect a fresh culture of BLT5403 cells with the desired number of phage, obtained by diluting the titered library, and use the resulting amplified library immediately.
CRITICAL STEP: Displayed proteins on the surface of phage are sometimes susceptible to proteolysis. Therefore, use freshly amplified phage.
CRITICAL STEP: Libraries generated by random mutagenesis (e.g. doped oligonucleotide synthesis or error-prone PCR) can contain extremely large numbers of variants28. Therefore, these libraries must be reduced in complexity before selection to ensure an adequate number of sequencing reads per variant (no less than 100). For example, if each sample will be allocated 1x10⁷ reads, then the library should contain no more than 1x10⁵ variants.
-
Yeast recovery
If a frozen yeast library is being used (see step 3B vii), recover the library by thawing frozen stock on ice, reserve 55.5 ul for step B ii, resuspend the library in 50 ml of selective SC dropout medium and shake at 37 °C and 200 rpm until the culture reaches a sufficient OD600, between 0.5 and 0.8.
Plate a 0.5, 5 and 50 ul aliquots of the thawed library before outgrowth on selective SC dropout plates to ensure that an adequate number of viable yeast is recovered to prevent loss of library diversity (e.g. at least 100 times the number of library members).
-
-
5
Perform library selection according to option A, if carrying out multiple rounds of phage selection for binding, or option B, if carrying out yeast outgrowth under selective conditions.
-
Performing multiple rounds of phage selection
Wash 200 µl of streptavidin beads with 250 µl of phage wash buffer as indicated by the T7 Select 10-3 Cloning kit three times. Label 200 µl of beads by incubation with a 4x molar excess of biotin-labeled peptide substrate in phage wash buffer with gentle agitation.
-
Wash beads three times with 250 µl of phage wash buffer each time, block the substrate-labeled beads with 100 µl of SuperBlock blocking buffer supplemented with 1 mM biotin and wash three times with 250 µl phage wash buffer each time. Resuspend beads in 200 µl of phage wash buffer.
PAUSE POINT Resuspended beads can be stored at 4 °C for no more than one week.
To conduct a round of selection, begin by adding 100 µl of phage from step 4Ai to 7.4 µl of beads with a total biotin binding capacity of 2.5 nM (as determined by the manufacturer) from step ii in a 1.7-ml microfuge tube. Incubate at room temperature for 1 h with gentle agitation. Wash with phage wash buffer and elute the substrate-bound phage using phage wash buffer supplemented with 20 mM DTT.
-
Set aside a small amount of the eluate for titration and amplify the remainder according to the procedure specified in the T7 Select 10-3 Cloning kit instructions for titration. Following amplification, titer the eluate according to the procedure specified in the T7 Select 10-3 Cloning kit instructions.
PAUSE POINT Store amplified phage stocks at 4 °C away from light for no more than one or two days.
CRITICAL STEP: The manufacturer’s instructions (T7 Select 10-3 Cloning kit) regarding the multiplicity of infection for the amplification must be followed carefully to avoid accidentally restricting library diversity.
CRITICAL STEP: The details of the phage selection depend on the protein and substrate in question. The experimenter should calibrate the selection using isogenic wild type, inactive and empty phage. Wash conditions should be adjusted such that wild-type phage yield at least a tenfold higher elution titer than inactive or empty phage. Next, the experimenter should conduct a mixing experiment, in which wild-type and inactive phage are mixed and selected over multiple rounds. The wild-type phage should take over the culture in less than six rounds.
-
Selection by yeast outgrowth
Prepare the library for selection by growing a yeast culture overnight in selective SC dropout medium that preserves the plasmid but does not select among library variants. Often, this is accomplished by placing the variant library under the control of a galactose-inducible promoter. If this is the case, the library is grown in SC dropout media that selects for the plasmid and has glucose as a carbon source. Glucose represses the expression of the variant library and is therefore non-selective with respect to the variant library. Shifting from glucose to galactose in step ii initiates expression of the library.
-
To initiate the selection, back dilute the overnight culture into selective medium, SC dropout media with galactose as a carbon source in our example, such that there are at least 10 yeast cells per variant in the initial back-diluted culture. This degree of back-dilution is required to prevent loss of library diversity (e.g. the number of cells should be at least ten times that of library members).
CRITICAL STEP: The number of time points desired and library members determine the size of the selection culture. We find that we can recover approximately 1 x 10⁹ plasmids from 50 ml of stationary phase culture. At least one hundred times as many plasmids as library members must be recovered to ensure adequate dynamic range. Thus, the experimenter should determine the correct size of the selection culture by multiplying the number of time points desired by the minimum culture volume needed per time point.
CRITICAL STEP: The details of the yeast selection can vary widely. The experimenter should calibrate the selection using plasmids encoding isogenic wild type and inactive proteins and empty plasmid. The experimenter should conduct growth experiments to demonstrate a significant difference in growth rate between wild-type and inactive variants. The magnitude of this difference will determine the number of generations required. Next, the experimenter should conduct a mixing experiment, in which yeast carrying wild-type and inactive variants are mixed and grown. The wild-type yeast should take over the culture by the time the culture becomes saturated.
Remove samples from the selection culture immediately after back dilution, periodically during log phase growth and after stationary growth has been reached. Process these samples as directed in step 6B.
-
-
6Extract the DNA libraries according to option A, if the library is phage-displayed or option B, if it is incorporated in plasmids within yeast.
- Extraction of DNA from amplified phage
- Transfer 150 µl of the input phage generated in step 4A I and the amplified phage generated in step 5A iv into two separate 2 ml phase lock tubes, add 100 µl of phenol:chloroform:isoamyl alcohol, invert five times and centrifuge for 5 min at 20,000 xg at room temperature.
- Add an additional 100 µl of phenol:chloroform:isoamyl alcohol, invert five times and centrifuge again for 5 min at 20,000 xg at room temperature.
- Add 100 µl of chloroform, invert five times, centrifuge for 5 min at 20,000 xg at room temperature.
- Add another 100 µl of chloroform, invert five times, centrifuge again for 5 min at 20,000 xg at room temperature.
- Transfer the aqueous layer, on the top of the phase lock gel plug, into a 1.7-µl microfuge tube, add a volume of 3 M sodium acetate equal to 1/10th of the volume of the aqueous layer and invert five times.
- Add 1 µl of GlycoBlue to facilitate visualization of pelleted DNA.
- Add absolute ethanol to a final concentration of 70% (vol/vol).
- Incubate at −80 °C for at least 20 min.
- Centrifuge in pre-cooled microfuge for 20 min at 20,000 xg. at 4 °C.
- Wash the DNA pellet with 1 ml of ice-cold 70% (vol/vol) ethanol, air-dry pellet until no moisture is visible, and resuspend it in 50 µl of nuclease-free water.
-
Quantify the DNA concentration using a Nanodrop spectrophotometer and then prepare a 50-ng/µl dilution of the DNA in nuclease free-water. Store the dilution at −20 °C.PAUSE POINT: DNA can be stored for years at −20 °C.
- Extraction of plasmids from yeast
- Transfer no more than 10 OD600 units (i.e. 10 ml of a culture with an OD600 of 1.0) of the library selection culture from step 5B iii into a 15-mL polypropylene tube.
- Pellet yeast by centrifuging at 1,500 xg for 10 min at room temperature and discard the supernatant. Resuspend the pellet in 225 µl Qiagen buffer P1 from the Qiaprep Spin Miniprep kit, 12.5 µl of 1 M DTT and 10 µl of Zymolyase 20T.
- Incubate mixture for 2 h at 37 °C, mixing by inverting the tube several times every 30 min.
- Freeze the mixture at −80 °C and keep it at this temperature for at least 30 min.
- Thaw the tube at 42 °C for 1 min and then add 250 µl of Qiagen buffer P2 from Qiaprep Spin Miniprep kit. Invert the tube ten times and incubate at room temperature for 5 min. Suspension should clear up slightly during this step.
- Add 350 µl of Qiagen buffer N3 from Qiaprep Spin Miniprep kit, invert the the tube ten times, incubate on ice for 10 min and centrifuge at 18,000 xg for 10 min at room temperature.
- Transfer supernatant to a Qiagen Miniprep column and centrifuge at 18,000 xg for 30 s at room temperature.
- Discard flow-through, add 750 µl of Buffer PB from Qiaquick PCR Purification kit and centrifuge at 18,000 xg for 30 s at room temperature.
- Discard flow-through, add 750 µl of Qiagen Buffer PE from Qiaprep Spin Miniprep kit and centrifuge at 18,000 xg for 30 s at room temperature.
- Discard flow-through and centrifuge at 18,000 xg for 30 s at room temperature to dry the column.
- Place the column in a new 1.7-ml microfuge tube, add 30 µl of nuclease-free water and incubate at room temperature for 1 min. Elute DNA by centrifuging at 18,000 xg for 1 min at room temperature.
- Repeat step xi for a final elution volume of 60 µl.
-
Quantify the DNA concentration using a Nanodrop spectrophotometer and then store the DNA at −20 °C.Troubleshooting: see Table 12CRITICAL STEP: Plasmid extraction from yeast is notoriously difficult. The experimenter should verify that a sufficient number of plasmids (e.g. at least 1,000x the number of input variants) are recovered. To measure plasmid number, transform into E. coli along with a control plasmid whose concentration is known and measure the number of the colony-forming units.PAUSE POINT: Once DNA extraction has been completed, extracted DNA can be stored at −20 °C for years.
Preparation of high-throughput sequencing libraries TIMING
~ 3 days (plus ~2 weeks for sequencing on an Illumina HiSeq or ~3d for sequencing on an Illumina MiSeq)
-
7
Design primers to append Illumina cluster generation sequences in a non-subassembled DNA library (option A) or in a subassembled DNA library (option B) (Figure 2). The key advantage of subassembly is length: if the variable region is longer than approximately 100 base pairs, subassembly should be used. The key disadvantage is complexity: subassembly adds several molecular biology and analysis steps. Regardless of which strategy is chosen, the amplification primers must append the required Illumina cluster generation sequences as well as any other desired features (e.g. indices for sample multiplexing).
-
Designing primers for a non-subassembled DNA library
For a non-subassembled library, a single set of amplification primers are needed that flank the variable region and enable sequencing. Design this set of primers so that they append the Illumina cluster-generating sequences to the template. They can contain other features (e.g. indices for sample multiplexing).
-
Designing primers for a subassembled DNA library
For a subassembled library, two sets of amplification primers are required. Design both sets of primers so that they append the Illumina cluster-generating sequences to the template, and can contain other features (e.g. indices for sample multiplexing). The first set enables the association of each barcode with its cognate variable region sequence. This set of primers consists of a constant primer adjacent to the barcode and a series of primers designed to generate a nested set of products. The second set of primers enables quantification of barcode frequencies in selected libraries and should flank the barcode.
-
-
8
Amplify DNA from each library by preparing the reaction mixture detailed in Table 10 and implementing the PCR program described in Table 11.
Troubleshooting: see Table 12
CRITICAL STEP: The amplification should be conducted using a high-fidelity polymerase, and should be optimized by qPCR to minimize the number of cycles37. Generally, fewer than 20 cycles is an acceptable procedure.
-
9
Purify the amplified product on an agarose gel using the Qiaquick Gel Extraction kit for gel purification according to the manufacturer’s instructions to recover DNA from excised bands. At least 10 ng of product should recovered.
-
10
Ensure that each library will yield good sequencing results by confirming that that the library is a single band of appropriate size on a PAGE gel. Additionally, to ensure that all necessary sequence features are present and that the amplification was clean, approximately eight clones should be cloned using the pGEM-T Easy Vector System according to the manufacturer’s instructions and Sanger-sequenced.
-
11
Quantify the amplified DNA library using the Kapa Library Quantification kit according to the manufacturer’s instructions.
-
12Determine required sequencing depth for each library according to option A, if the sample is a barcode or variant frequency quantification library, or option B, if the sample is a subassembled library.
- Sequencing depth for barcode or variant frequency quantification
- For barcode or variant frequency quantification, each library should be sequenced to a depth such that there are ~100 reads per barcode or variant. Ensure this read depth is achieved by comparing the number of barcodes or variants in the library to the number of reads that will be produced. Depending on the number of barcodes or variants, multiple libraries can be multiplexed into a single Illumina lane using an index.
- Sequencing depth for subassembly
- Choose a depth of sequencing such that each base of every library member is covered at least 100 times. For example, if a 300 nt variable region in a library of 100,000 variants is being subassembled using 100 nt long reads, 30 million reads should be acquired.
-
13
Acquire the requisite number of sequences per library, as determined in step 12. The experimenter can use their own sequencer, one in a core facility at their institution or a commercial sequencing service.
CRITICAL STEP: Deep mutational scanning libraries are unlike genomic libraries in that they are extremely biased (e.g. the nucleotide at each position in a given library member in the variable region is likely to be the wild-type nucleotide). Biased libraries can cause problems for high-throughput sequencers, so the experimenter should make their core facility or sequencing service aware of library bias and discuss appropriate countermeasures. For the Illumina platform, bias can be dealt with by spiking in unbiased DNA (e.g. PhiX or another randomly sheared genomic DNA sample). Alternately, the experimenter can use four amplification oligonucleotides with zero, one, two or three deletions after the amplification priming site but before the sequencing primer annealing site.
Table 10.
Library Amplification
| Component | Amount per reaction (µl) |
Final Concentration |
|---|---|---|
| Nuclease free water | 65 | – |
| Phusion High-Fidelity buffer (5x) (provided by manufacturer) |
20 | 1x |
| MgCl2 (50 mM) | 6 | 3 mM |
| dNTP mix (10 mM) | 2 | 200 µM |
| Primers (25 µM) | 2 of each | 500 nM |
| Template (50 ng µl−1) | 2 | 200 ng |
| Phusion High-Fidelity Polymerase (2 U µl −1) |
1 | 2 U |
Table 11.
Library Amplification Thermocycle
| Cycle number |
Denaturation | Annealing | Polymerization | Final |
|---|---|---|---|---|
| 1 | 3 min at 98 °C | 30 s at 68.5 °C | 1 min kb−1 at 72 °C | |
| 2–15 | 10 s at 98 °C | 30 s at 68.5 °C | 1 min kb−1 at 72 °C | |
| 16 | 10 s at 98 °C | 30 s at 68.5 °C | 5 min at 72 °C | |
| Hold | 4 °C |
Variant data analysis TIMING ~ 1 week
CRITICAL Data analysis requires familiarity with a command line interface. The deep mutational scanning data analysis pipeline, Enrich, should be downloaded and installed according to the documentation32.
-
14
Assess the quality of the sequencing run using SolexaQA38 or other high-throughput sequencing data quality assessment tool. If the average Phred quality score per read is <20, there may be a problem with the libraries.
Troubleshooting: see Table 12
-
15
OPTIONAL: If using a subassembled library, each barcode must be associated with its cognate variable region sequence. For each barcode, build a contig from the paired reads22. Compare each contig to the wild-type sequence and remove contigs that are incomplete. The result is a table of barcodes and their corresponding variant sequences (the barcode lookup table). To use this barcode lookup table with Enrich, synthetic FASTQ input files must be created. To make a synthetic FASTQ file, replace each barcode sequence in the barcode frequency sequencing FASTQ file with the appropriate variant sequence from the barcode lookup table.
-
16
Create an Enrich project directory: <code>enrich --mode initialize /path/to/new/project/directory/</code>
-
17
Copy FASTQ files into the /path/to/project/directory/data/raw/ directory.
-
18
Create an Enrich configuration file based on the library design: <code> enrich --mode configure</code>
-
19
Run the Enrich pipeline: <code>enrich --mode run_all --config_file /path/to/config/file</code> . Note that the pipeline comprises a series of steps: index-based selection of relevant reads, quality filtration based on user-defined parameters, fusion of overlapping reads, determination of the frequency of each variant before and after selection, calculation of the enrichment ratio of each variant and plotting.
Troubleshooting: see Table 12
-
20
To compare replicate data and estimate reproducibility, plot variant functional scores between replicates. A measure of correlation (e.g. Pearson’s R or Spearman’s ρ) can be used to quantify replicate performance.
Troubleshooting: see Table 12
-
21
Enrich currently supports a basic experimental design in which the variable region is covered by paired ends and only two time points are examined. More complex experimental designs, including the use of subassembly to sequence longer regions22 and the collection of multiple time points, have subsequently been published5,23. We refer the experimenter to those papers for details of the analysis of these data.
TIMING
Steps 1–3, Generating diversity libraries: ~2 weeks
Steps 4–6, Library selection and DNA extraction: ~2 week
Steps 7–13, Preparation of high-throughput sequencing libraries: ~3 days (plus ~2 weeks for sequencing on an Illumina HiSeq or ~3d for sequencing on an Illumina MiSeq)
Steps 14–20, Variant data analysis: ~1 week
TROUBLESHOOTING
ANTICIPATED RESULTS
Generating diversity libraries
The result of implementing steps 1–3 of the Procedure is a library (in either phage or yeast) that is ready for selection. Using chemically synthesized oligonucleotides doped to introduce diversity randomly is a robust method for generating libraries.
In the phage display approach (option A), a single synthetic oligonucleotide is rendered double-stranded, digested and directionally cloned into the phage genome. The resulting genome is packaged into phage in vitro and the resulting phage are used to infect an E. coli culture. The resulting amplified phage library should contain at least 1x10⁷ unique clones.
In the yeast approach (option B), several synthetic oligonucleotides with overlapping regions are assembled into a full-length cassette, which is amplified and then cloned into a plasmid. Transformation of the plasmid library into E. coli should yield at least 1x10⁶ unique clones, which are subsequently amplified. Transformation of the amplified library into the yeast strain of choice should yield at least 1x10⁵ unique transformants. If more transformants are needed, multiple transformations can be conducted. Sanger sequencing of at least 10 clones is warranted to assess the quality of the library before proceeding. These clones should be free from obvious defects (e.g. missing segments), and recurring mutations should be absent.
Library Selection
The result of steps 4–6 of the Procedure is a set of selected phage or yeast. The libraries must be reduced in complexity to ensure that the number of variants in the library is no more than 1/100th the number of sequencing reads to be collected for each library. This complexity reduction ensures that the depletion of deleterious variants can be accurately assessed. The complexity reduction should be implemented before selection is initiated. During the selection, the experimenter must take care not to inadvertently reduce the complexity of the population (e.g. by ensuring appropriate multiplicity of infection for phage amplification). After the selection, the experimenter will be left with samples of the library after successive rounds (for phage) or at different time points (for yeast). To resolve the question of which selection rounds or time points will be the most informative, the experimenter should sequence at least 10 clones from each selection round or time point. Ideally, these data will reveal when the library converged onto one or a few winner sequences. Working backwards, the experimenter can determine which selection rounds or time points will be informative for sequencing.
High-throughput sequencing of libraries
The result of steps 7–13 of the Procedure is a set of high-throughput sequencing data for each library before and after selection. The experimenter must modify the library DNA so that it contains the adapters required by the high-throughput sequencing technology being used. PCR is an effective way to append these sequences, and because common priming sites can be used, all samples should be amplified with similar efficiency. Provided sufficient input library DNA is used, no more than 20 cycles of PCR should be required to produce sufficient material. The result should be a library that is a single band on a gel and is free from chemical contaminants. All amplified library members should possess the required adapters. A HiSeq2000 should yield ~200 million paired-end reads whereas a MiSeq should yield ~20 million paired-end reads.
Data analysis
The result of the data analysis steps (14–21) is a data set comprising a functional score for each variant sequenced in the library. Enrich includes several filtration parameters (e.g. for raw sequence quality), but the experimenter will likely wish to do additional data filtration. Variants with low frequencies can yield noisy enrichment ratios, and are therefore often removed. If replicate data is available, the experimenter should examine how read-depth relates to reproducibility and use this analysis to define a sensible frequency cutoff. In the absence of replicate data, variants with fewer than 10 reads in the input library can be discarded.
Some variants will be detected in the input library but will, at some point, drop out of selected libraries. Assuming the selection has been calibrated properly such that the presumably nonfunctional nonsense variants remain in the library after selection, these drop-out variants are likely to be nonfunctional as well. To avoid losing drop-out variants and the information they contain, the experimenter can add a single read pseudo-count for each drop-out variant in the post-selection data. This pseudo-count will enable the researcher to calculate enrichment ratios for drop-out variants.
Many library designs result in the existence of synonymous variants, which can be used in a number of ways. First, synonymous variation can be used to determine the effectiveness of selection: nonsynonymous variants should have a much wider functional score distribution than synonymous variants. This difference exists because, although synonymous variants can have functional effects by affecting expression levels or altering the frequency of transcription and translation errors, these effects are generally negligible when compared to those of nonsynonymous variants. Next, multiple synonymous variants associated with a single nonsynonymous variant can be used to estimate the noise associated with the nonsynonymous variant. Finally, synonymous variants can be used to identify nonsynonymous neutral variants, whose functional scores should fall within the synonymous variant functional score distribution.
If the experimenter is interested in constructing a map that illustrates how the sequence of the protein relates to its function, properly filtered functional score data are the endpoint. However, large-scale mutagenesis data are more often a jumping off point to more complex analyses. In these cases, experimenters must be guided by the specific questions they want to answer.
After the initial data analysis, it is often helpful to conduct validation experiments. Here, a handful of variants with effects ranging from beneficial to deleterious are studied individually in cell-based or biochemical assays. The experimenter can then directly relate functional scores derived from the deep mutational scan to activity or other biochemical properties6,13,39.
Footnotes
AUTHOR CONTRIBUTIONS
D.M.F. and J.J.S. developed and refined the protocols. D.M.F., J.J.S. and S.F. wrote the paper.
COMPETING FINANCIAL INTERESTS
The authors have no competing financial interests to declare.
REFERENCES CITED
- 1.Cunningham BC, Wells JA. High-resolution epitope mapping of hGH-receptor interactions by alanine-scanning mutagenesis. Science. 1989;244:1081–1085. doi: 10.1126/science.2471267. [DOI] [PubMed] [Google Scholar]
- 2.Pál G, Kouadio JLK, Artis DR, Kossiakoff AA, Sidhu SS. Comprehensive and quantitative mapping of energy landscapes for protein-protein interactions by rapid combinatorial scanning. J. Biol. Chem. 2006;281:22378–22385. doi: 10.1074/jbc.M603826200. [DOI] [PubMed] [Google Scholar]
- 3.Brocchieri L, Karlin S. Protein length in eukaryotic and prokaryotic proteomes. Nucleic Acids Res. 2005;33:3390–3400. doi: 10.1093/nar/gki615. [DOI] [PMC free article] [PubMed] [Google Scholar]
- 4.Fowler DM, et al. High-resolution mapping of protein sequence-function relationships. Nat. Methods. 2010;7:741–746. doi: 10.1038/nmeth.1492. [DOI] [PMC free article] [PubMed] [Google Scholar]
- 5.Araya CL, Fowler DM. Deep mutational scanning: assessing protein function on a massive scale. Trends Biotechnol. 2011;29:435–442. doi: 10.1016/j.tibtech.2011.04.003. [DOI] [PMC free article] [PubMed] [Google Scholar]
- 6.Fowler DM, Fields S. Deep mutational scanning: a new style of protein science. Nat. Methods. doi: 10.1038/nmeth.3027. Accepted for publication. [DOI] [PMC free article] [PubMed] [Google Scholar]
- 7.Levin AM, Weiss GA. Optimizing the affinity and specificity of proteins with molecular display. Mol. Biosyst. 2006;2:49–57. doi: 10.1039/b511782h. [DOI] [PubMed] [Google Scholar]
- 8.Ernst A, et al. Coevolution of PDZ domain-ligand interactions analyzed by high-throughput phage display and deep sequencing. Mol. Biosyst. 2010;6:1782–1790. doi: 10.1039/c0mb00061b. [DOI] [PubMed] [Google Scholar]
- 9.Gold MG, et al. Engineering A-kinase Anchoring Protein (AKAP)-selective Regulatory Subunits of Protein Kinase A (PKA) through Structure-based Phage Selection. J. Biol. Chem. 2013;288:17111–17121. doi: 10.1074/jbc.M112.447326. [DOI] [PMC free article] [PubMed] [Google Scholar]
- 10.Reynolds KA, McLaughlin RN, Ranganathan R. Hot spots for allosteric regulation on protein surfaces. Cell. 2011;147:1564–1575. doi: 10.1016/j.cell.2011.10.049. [DOI] [PMC free article] [PubMed] [Google Scholar]
- 11.Fujino Y, et al. Robust in vitro affinity maturation strategy based on interface-focused high-throughput mutational scanning. Biochem. Biophys. Res. Commun. 2012;428:395–400. doi: 10.1016/j.bbrc.2012.10.066. [DOI] [PubMed] [Google Scholar]
- 12.Procko E, et al. Computational design of a protein-based enzyme inhibitor. J. Mol. Biol. 2013;425:3563–3575. doi: 10.1016/j.jmb.2013.06.035. [DOI] [PMC free article] [PubMed] [Google Scholar]
- 13.Whitehead TA, et al. Optimization of affinity, specificity and function of designed influenza inhibitors using deep sequencing. Nat. Biotechnol. 2012;30:543–548. doi: 10.1038/nbt.2214. [DOI] [PMC free article] [PubMed] [Google Scholar]
- 14.Traxlmayr MW, et al. Construction of a stability landscape of the CH3 domain of human IgG1 by combining directed evolution with high throughput sequencing. J. Mol. Biol. 2012;423:397–412. doi: 10.1016/j.jmb.2012.07.017. [DOI] [PMC free article] [PubMed] [Google Scholar]
- 15.Tinberg CE, et al. Computational design of ligand-binding proteins with high affinity and selectivity. Nature. 2013;501:212–216. doi: 10.1038/nature12443. [DOI] [PMC free article] [PubMed] [Google Scholar]
- 16.Kim I, Miller CR, Young DL, Fields S. High-throughput analysis of in vivo protein stability. Mol. Cell Proteomics. 2013;12:3370–3378. doi: 10.1074/mcp.O113.031708. [DOI] [PMC free article] [PubMed] [Google Scholar]
- 17.Adkar BV, et al. Protein model discrimination using mutational sensitivity derived from deep sequencing. Structure. 2012;20:371–381. doi: 10.1016/j.str.2011.11.021. [DOI] [PubMed] [Google Scholar]
- 18.Hietpas RT, Jensen JD, Bolon DNA. Experimental illumination of a fitness landscape. Proc. Natl. Acad. Sci. U.S.A. 2011;108:7896–7901. doi: 10.1073/pnas.1016024108. [DOI] [PMC free article] [PubMed] [Google Scholar]
- 19.Wu NC, et al. Systematic Identification of H274Y Compensatory Mutations in Influenza A Virus Neuraminidase by High-Throughput Screening. J. Virol. 2013;87:1193–1199. doi: 10.1128/JVI.01658-12. [DOI] [PMC free article] [PubMed] [Google Scholar]
- 20.Wagenaar TR, et al. Resistance to vemurafenib resulting from a novel mutation in the BRAFV600E kinase domain. Pigment Cell Melanoma Res. 2014;27:124–133. doi: 10.1111/pcmr.12171. [DOI] [PMC free article] [PubMed] [Google Scholar]
- 21.Ge B, et al. Survey of allelic expression using EST mining. Genome Research. 2005;15:1584–1591. doi: 10.1101/gr.4023805. [DOI] [PMC free article] [PubMed] [Google Scholar]
- 22.Hiatt JB, Patwardhan RP, Turner EH, Lee C, Shendure J. Parallel, tag-directed assembly of locally derived short sequence reads. Nat. Methods. 2010;7:119–122. doi: 10.1038/nmeth.1416. [DOI] [PMC free article] [PubMed] [Google Scholar]
- 23.Starita LM, et al. Activity-enhancing mutations in an E3 ubiquitin ligase identified by high-throughput mutagenesis. Proc. Natl. Acad. Sci. U.S.A. 2013;110:E1263–E172. doi: 10.1073/pnas.1303309110. [DOI] [PMC free article] [PubMed] [Google Scholar]
- 24.Melamed D, Young DL, Gamble CE, Miller CR, Fields S. Deep mutational scanning of an RRM domain of the Saccharomyces cerevisiae poly(A)-binding protein. RNA. 2013;19:1537–1551. doi: 10.1261/rna.040709.113. [DOI] [PMC free article] [PubMed] [Google Scholar]
- 25.Firnberg E, Ostermeier M. PFunkel: Efficient, Expansive, User-Defined Mutagenesis. PLoS ONE. 2012;7:e52031. doi: 10.1371/journal.pone.0052031. [DOI] [PMC free article] [PubMed] [Google Scholar]
- 26.Jain PC, Varadarajan R. A rapid, efficient, and economical inverse polymerase chain reaction-based method for generating a site saturation mutant library. Analytical Biochemistry. 2013;449C:90–98. doi: 10.1016/j.ab.2013.12.002. [DOI] [PubMed] [Google Scholar]
- 27.Gibson DG, et al. Enzymatic assembly of DNA molecules up to several hundred kilobases. Nat. Methods. 2009;6:343–345. doi: 10.1038/nmeth.1318. [DOI] [PubMed] [Google Scholar]
- 28.Knight R, Yarus M. Analyzing partially randomized nucleic acid pools: straight dope on doping. Nucleic Acids Res. 2003;31:e30. doi: 10.1093/nar/gng030. [DOI] [PMC free article] [PubMed] [Google Scholar]
- 29.Sidhu SS, Koide S. Phage display for engineering and analyzing protein interaction interfaces. Curr. Opin. Struct. Biol. 2007;17:481–487. doi: 10.1016/j.sbi.2007.08.007. [DOI] [PubMed] [Google Scholar]
- 30.Meacham F, et al. Identification and correction of systematic error in high-throughput sequence data. BMC Bioinformatics. 2011;12:242. doi: 10.1186/1471-2105-12-451. [DOI] [PMC free article] [PubMed] [Google Scholar]; 2011;12:451. [Google Scholar]
- 31.Loman NJ, et al. Performance comparison of benchtop high-throughput sequencing platforms. Nat. Biotechnol. 2012 doi: 10.1038/nbt.2198. [DOI] [PubMed] [Google Scholar]
- 32.Fowler DM, Araya CL, Gerard W, Fields S. Enrich: software for analysis of protein function by enrichment and depletion of variants. Bioinformatics. 2011;27:3430–3431. doi: 10.1093/bioinformatics/btr577. [DOI] [PMC free article] [PubMed] [Google Scholar]
- 33.Araya CL, et al. A fundamental protein property, thermodynamic stability, revealed solely from large-scale measurements of protein function. Proc. Natl. Acad. Sci. U.S.A. 2012;109:16858–16863. doi: 10.1073/pnas.1209751109. [DOI] [PMC free article] [PubMed] [Google Scholar]
- 34.Gai SA, Wittrup KD. Yeast surface display for protein engineering and characterization. Curr. Opin. Struct. Biol. 2007;17:467–473. doi: 10.1016/j.sbi.2007.08.012. [DOI] [PMC free article] [PubMed] [Google Scholar]
- 35.Dai M, et al. Using T7 phage display to select GFP-based binders. Protein Eng. Des. Sel. 2008;21:413–424. doi: 10.1093/protein/gzn016. [DOI] [PubMed] [Google Scholar]
- 36.Gietz RD, Schiestl RH. High-efficiency yeast transformation using the LiAc/SS carrier DNA/PEG method. Nature Protocols. 2007;2:31–34. doi: 10.1038/nprot.2007.13. [DOI] [PubMed] [Google Scholar]
- 37.Roux KH. Optimization and troubleshooting in PCR. Cold Spring Harb. Protoc. 2009;2009 doi: 10.1101/pdb.ip66. pdb.ip66. [DOI] [PubMed] [Google Scholar]
- 38.Cox MP, Peterson DA, Biggs PJ. SolexaQA: At-a-glance quality assessment of Illumina second-generation sequencing data. BMC Bioinformatics. 2011;11:242. doi: 10.1186/1471-2105-11-485. [DOI] [PMC free article] [PubMed] [Google Scholar]; 2010;11:485. [Google Scholar]
- 39.McLaughlin RN, Poelwijk FJ, Raman A, Gosal WS, Ranganathan R. The spatial architecture of protein function and adaptation. Nature. 2012;491:138–142. doi: 10.1038/nature11500. [DOI] [PMC free article] [PubMed] [Google Scholar]