

Abstract
Phenotyping single cells based on the products they secrete or consume is a key bottleneck in many biotechnology applications, such as combinatorial metabolic engineering for the overproduction of secreted metabolites. Here we present a flexible high-throughput approach that uses microfluidics to compartmentalize individual cells for growth and analysis in monodisperse nanoliter aqueous droplets surrounded by an immiscible fluorinated oil phase. We use this system to identify xylose-overconsuming Saccharomyces cerevisiae cells from a population containing one such cell per 104 cells and to screen a genomic library to identify multiple copies of the xylose isomerase gene as a genomic change contributing to high xylose consumption, a trait important for lignocellulosic feedstock utilization. We also enriched L-lactate–producing Escherichia coli clones 5,800× from a population containing one L-lactate producer per 104 D-lactate producers. Our approach has broad applications for single-cell analyses, such as in strain selection for the overproduction of fuels, chemicals and pharmaceuticals.
Metabolic engineering has made substantial contributions to the rational improvement of strains for industrial applications. Traditionally, enzymatic steps closely associated with the product-forming pathway have been engineered to prune side reactions and eliminate kinetic bottlenecks1–4. However, other, so-called distal genes may also affect production in a profound way owing to (often unknown) kinetic and regulatory effects. Inverse metabolic engineering (IME) emerged as an approach to identify such distal genetic factors. IME uses combinatorial methods whereby libraries are constructed harboring random genetic variants of the host or other strains; cells with superior properties are selected; and genetic inserts affecting the superior phenotype are characterized2. Though many strategies can be deployed in library construction, broad applicability of IME to strain improvement for overproduction of secreted metabolites is severely limited by the lack of high-throughput methods for selecting strains with substantially improved metabolite secretion or uptake rates1,5.
Fluorescence-activated cell sorting (FACS) has the ability to sort large numbers of cells. Typically, single cells from a bulk culture are measured based on a fluorescent reporter that is linked to the conditions of either the intracellular space or the surface of the cell. Although FACS is a powerful technique, its use is limited to a certain class of problems where the metabolite of interest is not secreted by the cell. FACS cannot be used to identify clones that overproduce extracellular metabolites such as lactate or xylitol, because the metabolites in a bulk culture have lost their association with the cells. Thus, it is important to develop an approach that can examine problems that FACS does not address. Many of those problems are industrially important, especially in the context of metabolic engineering, as substrates and many interesting products are by their very nature extra-cellular. Even for products that are intracellular, there are substantial efforts in the research community to engineer microorganisms to secrete these products to relieve stress on the cell caused by toxicity and to increase the ease of separation of the desired product6–8. In this context, we developed an approach that is ideally suited to help these researchers identify hyperproducers that are further engineered to secrete molecules of interest.
This limitation of selecting for strains based on extracellular metabolite levels can be addressed by compartmentalizing clonal populations in separate wells in a microtiter plate. In this system, the concentration(s) of the metabolite(s) of interest can be measured and used to select strains9. However, this method is laborious, expensive, low-throughout and poorly suited for the improvement of strains for the production of fuel and chemical products by screening large (≥104 unique clones) mutant libraries. Automation through the use of colony pickers and liquid handling robots increases the throughput to 104 clones/day but cannot handle larger libraries unless multiple machines are used in parallel. Furthermore, both colony pickers and liquid handling systems cost hundreds of thousands of dollars and have a large footprint. These cost and space issues are further exacerbated when using multiple machines.
Thus, it would be preferable to use a higher-throughput method that also addresses these issues. Several such high-throughput encapsulation methods have been reported. Gel microdroplet technology was developed to measure extracellular metabolite levels for individual cells, but it produces gel containers that vary greatly in size10. Because the metric for screening IME libraries is a metabolite concentration, variation across the library is generally small (e.g., less than a factor of two). Thus, a minimal variation in droplet size is critical for the success of a high-throughput screening system. Droplet emulsion technology provides a similar method for compartmentalizing clones by placing them individually in aqueous droplets surrounded by an immiscible oil phase and has improved the activity of enzymes produced by cells or in vitro translation11,12. Creating the emulsion with a homogenizer also produces substantial variations in droplet volume. Thus in a previous application of this technology, only libraries with a great deal of diversity could be screened13. In contrast, using microfluidics can produce droplet size distribution variations as small as 3% (ref. 14). Furthermore, droplet sizes of a nanoliter or less can be produced. The use of low-volume droplets increases the measurement sensitivity because the concentration change inside the droplet is larger. Microfluidics also facilitates droplet merging, analysis, fluorescence detection and sorting15–18. Integrating these functions into a single device provides several advantages. The assay reagents are added to the cell-containing droplets after cell culturing, which allows the cells to be cultured in the same media as they would be in a shake flask, instead of being cultured in a mixture of media and assay chemicals. The consumption of a media component can be measured as well.
RESULTS
Microfluidic screening and assay system
Our flexible, integrated, high-throughput screening system encapsulates cells in monodisperse, nanoliter-volume, aqueous droplets surrounded by an immiscible fluorinated oil phase. The system then cultures the cells, mixes the contents of the cell-containing droplets with fluorescent enzymatic assay reagents, measures the resulting fluorescence and sorts the droplets based on that measurement (Fig. 1, Supplementary Note 1, Supplementary Figs. 1–4 and Supplementary Movies 1–4).
Figure 1.

Microfluidic high-throughput screening platform. Initially, cells in PBS are mixed with cell culture media. Droplets are formed by combining this aqueous stream with two streams containing a fluorinated oil and surfactant mixture. The 0.3-nl droplets formed in this device are collected in a syringe that provides a microaerobic environment when capped. The syringe is placed in an incubator for cell culturing. After culturing for a predetermined amount of time, droplets from the incubated syringe are reinjected into a second device (lower panel) where they are combined with another set of droplets containing fluorescent enzymatic assay reagents. After droplet coalescence, the resulting droplets flow through channels for 30 s to allow the assay reaction to proceed. The extracellular concentration of the metabolite of interest is quantified by measuring the droplet fluorescence with a laser/photomultiplier tube system. Based on this measurement, droplets are sorted into one of two channels. This system as currently configured can screen ~1 to 2 clones per second so that 104 clones can be screened in less than 3 h.
The number of cells placed in droplets follows a Poisson distribution, which is dependent on the incoming cell density (Supplementary Fig. 5). The latter can be manipulated to ensure the encapsulation of one cell in approximately every two to three droplets, thereby minimizing the number of droplets with more than one cell (and thus the number of false-positive events) and ensuring that the number of droplets with single cells is high enough to support sufficient throughput. The sorting system has been designed to have negligible false negatives, and the false-positive rate is 2.5% (Supplementary Note 2 and Supplementary Table 1).
The high-throughput screening system is flexible because any fluorescent assay system can be used to measure the concentration of the metabolite of interest. The assay described in this paper is based on an oxidase enzyme/horseradish peroxidase/Amplex UltraRed system and allows for the use of any oxidase enzyme (tunable to the target metabolite)19,20. The generalized assay reactions are:
In this reaction, the amount of fluorescent resorufin produced is proportional to the concentration of the metabolite of interest in solution. The assay reaction starts when a cell-containing droplet coalesces with an assay droplet.
Enriching populations for high xylose–consuming strains
We used our system to identify high xylose–consuming strains of S. cerevisiae. The consumption of xylose was chosen for the demonstration of this system because of its relevance to biofuels research. Lignocellulosic feedstocks, such as corn stover, contain a substantial amount of xylose21. However, S. cerevisiae, which readily converts glucose to ethanol, cannot naturally ferment xylose. As a result, engineering an S. cerevisiae strain that readily assimilates xylose is a critical step in the full utilization of lignocellulosic feedstocks and the development of economically viable bioethanol processes based on renewable resource utilization22–24. A high-throughput screening method is an important tool for identifying these strains.
First, we sought to establish that the fluorescence distributions of droplets encapsulating yeast cells with varying xylose-assimilation capabilities were sufficiently different to allow such droplets to be efficiently sorted. To this end, we chose two strains of S. cerevisiae, H131 and TAL1. H131 is the higher xylose–consuming strain (Supplementary Fig. 6). Both strains contain the Scheffersomyces stipitis genes XYL1, XYL2 and XYL3, which code for the xylose reductase, xylose dehydrogenase and D-xylulokinase enzymes, respectively. The addition of these enzymes and the overexpression of the native TAL1 gene, which codes for a transaldolase enzyme in the pentose phosphate pathway, allow the cells to utilize xylose. In addition, H131 overexpresses several additional pentose phosphate pathway genes, which ensure that the additional flux from the utilization of xylose is diverted toward the glycolytic pathway25.
The two individual strains were cultured separately in droplets, and we used a fluorescence assay based on the pyranose oxidase enzyme to detect xylose (Supplementary Note 3 and Supplementary Figs. 7 and 8)26. Fluorescence distribution data were measured at various time points using biological replicates. Representative distributions from the H131 and TAL1 strains after 2 d of culturing are shown in Figure 2a. The bimodal distribution is expected, with the higher fluorescence population representing droplets that contained no cells and therefore had a xylose concentration equal to the initial xylose concentration of 5 g/liter. Cell-containing droplets exhibit lower fluorescence. The fluorescence distributions reveal that there were more droplets with low fluorescence for the H131 than for TAL1. Thus, the xylose concentration in the H131-containing droplets is lower, as expected for these xylose-consuming cells (Supplementary Note 4 and Supplementary Figs. 8 and 9).
Figure 2.
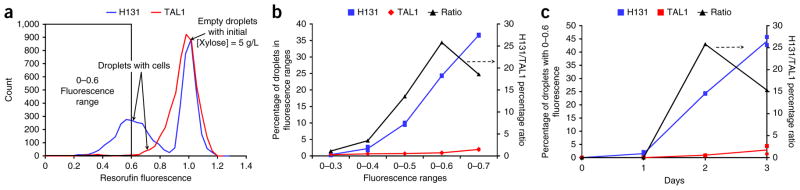
Development of screen for high xylose–consuming strains. (a) Fluorescence intensity distributions of two populations of droplets: one containing high (H131) and the other low (TAL1) xylose-consuming yeast strains, after 2 d of culturing. High fluorescence characterizes droplets with no cells, and low fluorescence, droplets with cells. A larger fraction of droplets with low xylose concentrations is observed for strain H131, as expected. (b) Effect of fluorescence range on the fraction of H131- and TAL1-containing droplets after 2 d of culturing. (c) Effect of culturing time on the fraction of H131- and TAL1-containing droplets using data from the 0–0.6 fluorescence range. A statistical model using all time points showed that H131 had a statistically higher xylose consumption than TAL1 (P < 0.0001 using an F-test). In b and c, the data points are the percentage of droplets of each strain in a fluorescence bin range. The lines represent the average of the data points from the biological replicate experiments (n = 2).
To perform a more quantitative comparison of the data from Figure 2a, we evaluated the fraction of total droplets with fluorescence below a certain threshold. Results for the 2-d culturing experiment show a substantial difference between the fractions of droplets containing the two types of strains in the fluorescence intensity ranges of 0–0.5, 0–0.6 and 0–0.7 (Fig. 2b). The ratio of H131- to TAL1-containing droplets in these ranges was also calculated and found to be as high as 25 (Fig. 2b). This ratio is an estimate of the enrichment in H131 cells that would be obtained in the outgoing population if the incoming population contained equal cell concentrations of the two strains and droplets were perfectly sorted based on these ranges. Analysis of similar data obtained at different time points shows that the percentage of droplets in the 0–0.6 fluorescence intensity range increased in both strains with time, but the enrichment decreased after 2 d, presumably owing to an already high depletion of xylose in the H131-containing droplets (Fig. 2c).
Next we tested whether the microfluidic assaying-sorting device was capable of enriching the H131 cell population by screening an incoming cell population comprising equal proportions of the H131 and TAL1 strains. This mixture was cultured on xylose for 2 d, and the resulting cell-containing droplets were screened for low xylose content using the microfluidic device. The difference in the auxotrophic markers for the two strains was used to determine the contents of the sorted droplets (Supplementary Note 5 and Supplementary Figs. 10–13). The H131 strain does not grow on leucine-deficient media, whereas TAL1 does. As a result, the sorted population was grown on two types of agar plates, one with leucine and another without. After culturing, we counted the number of colonies on each type of plate. The TAL1 colony forming units (CFU) parameter was the number of colonies on the leucine-deficient plates, whereas the H131 CFU was calculated by subtracting the number of TAL1 colonies from the total number of colonies on the leucine plates. The fluorescence data from two screening experiments (carried out with sorting gates of 0–0.6 and 0–0.7) are shown in Figure 3a. For the two fluorescence gates used for droplet sorting (0–0.6 and 0–0.7), H131 enrichments of 18× and 22× were obtained, respectively (Fig. 3b). H131 enrichment due to the cell growth difference between the two strains was only 2.8×, which is substantially lower than the total enrichments observed.
Figure 3.
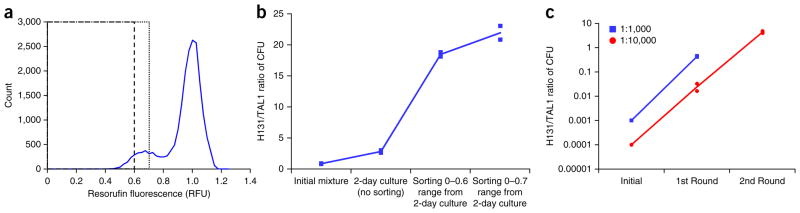
Enrichment of high xylose–consuming strain (H131). (a) Fluorescence distribution of droplets containing a mixture of H131 and TAL1 strains. The strains were mixed in equal proportions, encapsulated in microdroplets, and their fluorescence measured (dashed line is the 0–0.6 range and dotted line is the 0–0.7 range). (b) Enrichment of H131 yeast strain from 1:1 H131/TAL1 initial mixture. Enrichment after 2 d of growth is 2.8×. Using fluorescence-sorting thresholds of less than 0.6 and 0.7 enriches H131 strain by 18× and 23×, respectively. (c) Enrichment of H131 strain from initial 1:1,000 and 1:10,000 H131/TAL1 mixtures. One round of screening yields a 420× enrichment of the H131 strain from an initial 1:1,000 mixture of H131/TAL1; two rounds of screening enriches H131 by 42,600× from an initial 1:10,000 mixture. The lines in b and c represent the average of the data points from the biological replicate experiments (n = 2).
Actual cell libraries typically contain a very low number of desired cells in the overall cell population. Hence, two test libraries with incoming desired (H131) to undesired (TAL1) cell population ratios of 1:1,000 and 1:10,000 were screened so that droplets having fluorescence intensities in the range of 0–0.7, which should contain a substantially larger proportion of the desired H131 cells, were sorted into one bin. A target final population ratio of 1:2.5 was defined (meaning that randomly selecting five clones should assure recovery of an H131 cell). This target was achieved after only one round of screening with the 1:1,000 library. Two rounds were necessary to screen the 1:10,000 library. The sequence for one round of screening involved four stages: a preculture of the incoming cells, a shake flask culture grown into early exponential phase, droplet encapsulation of cells and selection of droplets with low xylose concentrations. The one round of screening enriched the 1:1,000 library by 420×, and two rounds enriched the 1:10,000 library by 42,600× (Fig. 3c). These results are in line with the enrichment experiments summarized in Figure 3b.
Screening a yeast genomic DNA library for high xylose consumption
As we have shown the ability to enrich for high xylose–consuming populations, our next test was to screen a genetic library. The library we screened was generated to determine the nature of the genetic modification(s) underlying the superior xylose uptake performance that some strains acquired as a result of the evolution, under proper selection pressure, in series culturing or continuous cultivation experiments. The H131-A31 strain used in this experiment is similar to H131 with one important exception: instead of the XYL1 and XYL2 genes, it contains the Piromyces sp. E2 XYLA gene encoding a xylose isomerase enzyme to convert D-xylose to D-xylulose24. This strain initially exhibited negligible growth and xylose consumption rates. After several months of evolution through growth and serial subculturing, we obtained strain H131E-A31; this strain exhibited high growth (μ ~ 0.2 h−1) and high xylose consumption rates (14 g/liter in 2 d) when cultured microaerobically in a shake flask with an initial 20 g/liter xylose concentration (Supplementary Figs. 14 and 15). Other groups have also used similar strategies to generate S. cerevisiae strains that can consume xylose at high rates by evolving cells containing a Piromyces sp. E2 xylose isomerase gene insertion23. However, the origin of improved strain performance with respect to xylose assimilation has been largely unknown. Genome sequencing has been used in prior attempts to decipher the nature of genetic modification(s) underlying the improvements obtained by this evolutionary engineering27,28. However, not all of the identified mutations are known to affect the cell growth and xylose utilization until each mutation is tested individually.
To identify the genetic elements responsible for the improved performance of the H131E-A31 strain, we used our system to screen H131-A31 cells transformed with a library of 105 genomic clones from H131E-A31. The library was constructed such that each insertion had a high probability of containing at least one open reading frame. Assuming that a single mutation, rather than a combination of multiple mutations, is sufficient to yield cells with an improved xylose assimilation rate, it should be possible to isolate a mutant harboring a single genomic fragment by screening the cell population transformed with the library using our system29. After one round of screening where the cells were cultured for 70 h in 5 g/liter xylose, five clones were grown microaerobically in shake flasks. Mutant W2 was isolated as the one with the highest xylose consumption rate. We calculated the cumulative xylose consumption over the course of 4 d for strain H131-A31, transformed with an empty plasmid (control); mutant W2; and strain H131-A31, with the plasmid isolated from mutant W2 (retransformed W2) when cultured in media with 5 g/liter xylose (Fig. 4a). Biological replicates were used in these measurements. The retransformed W2 strain consumed 2.6 g/liter xylose after 4 d of culturing compared with 4.7 g/liter for mutant W2, suggesting that a background genomic mutation, in addition to the presence of the plasmid, also contributed to the phenotype of the W2 mutant. However, both mutants consumed more xylose than did the control, confirming a mutation on the plasmid that provided a benefit over the control.
Figure 4.

Results from genomic DNA library screen. (a) Xylose consumption of strain H131-A31 with an empty plasmid (control), the W2 mutant and H131-A31 harboring the plasmid isolated from mutant W2 (retransformed W2). A statistical model using all time points was performed to show that both the W2 mutant and retransformed strains were statistically significantly different from the control (for both, P < 0.0001 using an F-test). The lines represent the average of the data points from the biological replicate experiments (n = 2). (b) XYLA gene construct in H131-A31, in plasmid from mutant W2 and in H131E-A31.
The sequencing and restriction enzyme digest analysis determined that the plasmid isolated from the W2 strain contained three full copies of the XYLA gene construct flanked by truncated XYLA sequences (Fig. 4b)29. Quantitative PCR was performed to determine the number of copies of XYLA in the H131-A31 and H131E-A31 strains. There were 1.3 ± 0.3 copies in H131-A31 and 47.9 ± 9.0 copies in H131E-A31 normalized to the copies of the phosphoglycerate kinase (PGK) gene, which confirmed the increased number of copies of XYLA after evolution. The xylose isomerase gene catalyzes the conversion of D-xylose to D-xylulose, which initiates xylose assimilation by the cell. Additional copies of XYLA would allow for increased xylose uptake and cell growth. As the original H131-A31 strain did not grow well on xylose, the selection pressure of having xylose as the sole carbon source in the medium led to the enrichment of cells harboring increased copies of XYLA (because of the growth advantage that such cells would enjoy in this medium). As these multiple copies of XYLA were linked, they were created through the naturally occurring process of tandem gene duplication where recombination occurs between two sites owing to unequal crossing over. The pRS426 plasmid from the H131-A31 strain contained not only the XYLA gene flanked by a promoter and terminator but also S. stipitis XYL3 with identical flanking regions. These homologous flanking regions would allow tandem gene duplication to occur during DNA replication30.
Screening for L-lactate–producing cells
Our results demonstrate that the microfluidic system is capable of isolating cells with high xylose assimilation rates from a population comprising cells with varying xylose uptake rates. Production phenotypes, however, are different in that the carbon flux is directed toward the desired product and need not be coupled to and may even be in competition with growth. To demonstrate the ability of the system to also identify overproducing strains, we used it to enrich for a high L-lactate–producing E. coli strain.
We used strains TG108 and TG113, which produce optically pure L- and D-lactate, respectively31. We transformed TG108 with the cloning vector pBR322 and TG113 with pACYC184 to allow for quantification of enrichment in sorted populations by selective plating. A comparison of shake flask fermentation characteristics shows that TG108 pBR322 and TG113 pACYC184 have similar growth profiles and lactate production as measured by high performance liquid chromatography (HPLC) (Fig. 5a,b). The assay reaction uses lactate oxidase from Pediococcus sp. This enzyme was chosen because of its high selectivity for the L-isomer of lactate. Quantification of lactate in the shake flask fermentations using the enzymatic assay in a 384-well plate format confirmed this enantiomeric selectivity (Fig. 5a,b).
Figure 5.
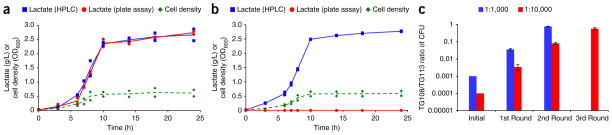
Shake flask data from lactate-producing strains and enrichment of L-lactate–producing strain. (a,b) Measurements of biological replicate experiments of cell growth, HPLC lactate measurements and lactate oxidase assay results from L-lactate shake flask fermentation of strain TG108 pBR322 (a) and D-lactate shake flask fermentation of strain TG113 pACYC184 (b). (c) Enrichment of TG108 pBR322 strain from initial 1:1,000 and 1:10,000 TG108 pBR322/TG113 pACYC184 mixtures from biological triplicate experiments. One round of screening yields a 775× enrichment of the TG108 pBR322 strain from an initial 1:1,000 mixture of TG108 pBR322/TG113 pACYC184; three rounds of screening enriches TG108 pBR322 by 5,800× from an initial 1:10,000 mixture. The lines in a and b represent the average of the data points from the biological replicate experiments (n = 2). Error bars in c, s.d. from biological replicate experiments (n = 3).
We constructed two test libraries where the desired and undesired strains were TG108 pBR322 and TG113 pACYC184, respectively. As with the xylose enrichment experiment, the desired to undesired cell ratio was 1:1,000 and 1:10,000. These libraries were then screened for highly fluorescent droplets to identify ones containing L-lactate–producing cells. After two rounds of screening, the 1:1,000 population was enriched 775×, whereas three rounds of screening resulted in an enrichment of 5,800× for the 1:10,000× population (Fig. 5c); both of which meet the target final population ratio of 1:2.5. These results not only demonstrate the efficacy of our system for enrichment of a production phenotype but also the ability to distinguish between enantiomers.
DISCUSSION
Although others have demonstrated the use of microfluidic emulsion droplet technology to screen populations of cells, these previous applications have been limited to screening cells that have already completed their culturing process and that produce an analyte of interest physically connected to the cell by being either intracellular or membrane-bound18,32. In these examples, the initial formation of droplets involved the addition of only assay reagents to determine the activity of the enzyme. This is very different from the detection of extracellular metabolite production or consumption. In this scenario, the culture and assay steps cannot be performed simultaneously because the time scale for production or consumption is much longer than the assay time, which is on the order of seconds or minutes. Thus, a separate step is necessary to culture each individual cell in its own droplet.
Here, we have described a system to measure extracellular metabolite secretion or consumption, which utilizes a microfluidic droplet maker to encapsulate cells and growth medium, a syringe for multi-day micro-aerobic culturing of collected droplets, and a second microfluidic device containing coalescence, delay line, detection and sorting modules. In this second device, the reagents to detect the analyte of interest are added to the droplets collected in the syringe; the assay reaction occurs while the droplets are in the delay lines; and droplets are sorted and collected based on resulting fluorescence. Combining multiple modules into a single microfluidic device was necessary because the assay incubation time was only 30 s. It was critical to ensure that the droplet order after coalescence was maintained through the detection step to ensure that, and the assay reaction time was constant for all droplets. Because there is additional complexity in this device, the correct timing of the droplet reinjection and assay droplet formation must be properly set to ensure that the incidence of both incorrect coalescence (e.g., combining one assay droplet with two cell-containing droplets) and sorting (e.g., undesired droplets into desired droplet output) was low.
The device we used had a throughput of 104 cells/h. Thus, in a 10-h screening experiment, 105 cells can be screened. Additional optimization, as well as a more controlled process for making the devices, could improve the throughput to 105–106 cells/h. Also, as microfluidic devices are easily parallelizable owing to their small size, creating such a parallelized system could improve the throughput another two to three orders of magnitude (up to 109 cells/h).
This system has several advantages over other screening technologies. We described in Supplementary Note 6 how our method was more efficient than the traditional serial subculturing technique for identifying high xylose–consuming strains. Compared with automated colony pickers and liquid handling systems, our screening system has higher throughput even without additional optimization and uses fewer reagents, which may contribute to lower costs (Supplementary Note 7). Another advantage is the reduction of culturing space. As an example, distributing 104 clones, one clone per well, into 96-well plates would require 105 plates, which occupies a large amount of space; 108 clones would require 106 plates. We have demonstrated that culturing cells in a droplet matches the performance of culturing them in a shake flask. In contrast, static plates do not match a shaken system owing to the reliance of the system on diffusion to transfer nutrients to the cells. Using shaken plates further increases the footprint because, typically, deep-well plates are used and are also taller.
In addition to the microfluidic screening system, we also described a flexible assay for measuring various metabolites through the use of oxidase enzymes with horseradish peroxidase. The same basic system can be used for measuring different metabolites simply by exchanging the oxidase enzyme. Thus, a metabolite such as xylitol can be detected using xylitol oxidase33. The number of metabolites compatible with this assay system could be increased further by coupling NADH oxidase with dehydrogenase enzymes. Moreover, the microfluidic screening system is not limited by these specific assays. In general, fluorescent assay measurements developed for plate-based measurements are readily transferable to this microfluidic droplet screening system.
Along with the improvements in the screening speed of this system, other capabilities can be added. Although we described only the use of yeast and bacteria, this system could be extended for use with other organisms, such as mammalian or insect cells. Although we grew cells for only up to 4 d without any issues, longer-term culturing in droplets can occur as long as the cells have sufficient nutrients and there is minimal evaporation inside the droplets. Additional nutrients, such as those used in a fed batch, could be added to the droplets through a microfluidic droplet coalescence module and incubation in a humidified incubator reduces the amount of evaporation. As our system is a series of microfluidic modules, a logical next step would be to integrate these with commercially available microfluidic systems for additional analysis. Although the system we have described is flexible and can be extended to other areas, the detection of the metabolite of interest must use either an enzymatic fluorescence assay or another assay that is compatible in a microfluidic droplet system. Another limitation is that the metabolite must also be miscible in water and not in the oil phase to ensure effective encapsulation.
Our system allows large libraries to be screened for a variety of applications in metabolic engineering. Furthermore, it could be extended for use in the fields of antibody lead identification and optimization, antibody production and other areas that benefit from the characterization of single clones. We have demonstrated that the system can isolate bacterial and yeast strains capable of overproducing or over-consuming secreted metabolites and can help identify the dominant mutations responsible for technologically important phenotypes.
ONLINE METHODS
Microfluidic device experimental setup
All fluids were supplied to the microfluidic devices by syringes connected to NE-500 (New Era) or PHD 2000 (Harvard Apparatus) syringe pumps with PE-20 (Intramedic) or PEEK (VICI Valco) tubing. Proprietary fluorinated oil and surfactants were supplied by Raindance Technologies. For nonemulsion inputs into the microfluidic device, PE-20 tubing (Intramedic) with a 0.015 inch inner diameter connected the syringes to the device. To ensure that droplets from a reinjected emulsion did not coalesce in the tubing, TPK.515 PEEK tubing (Vici Valco) with a 0.015 inch inner diameter was used. This tubing was also used to connect the outlet from the drop-making device to the syringes used for cell incubating. 1 ml unfiltered sterile pipet tips collected the emulsions in the “desired” and “undesired” channels from the sorting device. To monitor the functionality of microfluidic device, we connected an Ultima 512 (Photron) to a Motic AE30 inverted microscope. The coalescence electrodes were connected to an inverter and DC power supply while the sorting electrodes were connected to a Model 609E-6 high-voltage amplifier. Fluorescence detection was performed using a 50-mW, 488-nm laser (Picarro) for excitation and a photomultiplier tube (Hamamatsu) with a 593-nm filter (Semrock) for detection. Syringes were incubated in a Lab-Line compact incubator. 3,3,4,4,5,5,6,6,7,7,8,8,8- tridecafluoro-1-octanol (Sigma) was added to the sorted droplets in order to break the emulsion.
Xylose and lactate fluorescent enzymatic assay reactions in droplets
The assay mixture contained PBS, Amplex UltraRed (Invitrogen) and horseradish peroxidase (Sigma). The mixture also contained pyranose oxidase (Sigma) or lactate oxidase (Sigma) for the detection of xylose or L-lactate, respectively. The concentration of the components in the assay droplets were 0.2 mM Amplex UltraRed, 0.4 U/ml horseradish peroxidase, and 4 U/ml pyranose oxidase or 5 U/ml lactate oxidase. The tubing used to supply the assay reagents to the device was pretreated with 1% bovine serum albumin for 5 min so that components in the assay mixture did not adhere to the tubing.
Yeast strains
H131 was derived from F1702 (a BF-264-15Daub derivative)34. It has the genotype MAT_a, leu2, ura3, arg4, ade1 :: ADE1-GPD-PsTAL1, trp1 :: TRP1-GPDP-ScRKI1-CYCT-GPDP-ScRPE1-CYCT, his2 :: HIS2-GPDP-ScTKL1-CYCT with pRS426-GPDP-XYL1-CYCT-GPDP-XYL2-CYCT-GPDP-XYL3-CYCT. ScRKI1, ScRPE1 and ScTKL1 are the RKI1, RPE1 and TKL1 genes from S. cerevisiae. PsTAL1, XYL1, XYL2 and XYL3 genes are from S. stipitis. H131-A31 is similar to H131 except it contained the plasmid pRS426-GPDP-XYLA-CYCT-GPDP-XYL3-CYCT. XYLA is the xylose isomerase gene from Piromyces sp. E2. H131E-A31 is the evolved version of H131-A31. TAL1 was created from YSX3, which had a genotype of MAT_α, trp1, leu2 :: LEU2-GAPDHP-XYL1 ura3 :: URA3-GAPDHP-XYL2 Ty3 :: NEO-XYL3. TAL1 is YSX3 with the pRS424TEF-PsTAL1 plasmid.
The genetic background in which the genomic DNA library was transformed was the H131-A31 strain. The library was constructed by performing a genomic DNA prep of H131E-A31 using the Wizard Genomic DNA purification kit (Promega) and partially digesting the DNA with Sau3AI (New England Biolabs). Fragments larger than 3 kb were selected on an agarose gel and the DNA was gel purified and purified again with ethanol precipitation. pRS415 was used as the backbone and digested with SalI. Both the insertion fragments and the backbone were incubated with the Klenow fragment of DNA polymerase I and the appropriate dNTPs to reduce the overhang length from 4 to 2 base pairs to decrease the frequency of self-ligation. The backbone was also dephosphorylated to prevent self-ligation. After ligating the fragments and the backbone together with T4 ligase, the resulting plasmid was transformed into ElectroMAX DH5α-E (Invitrogen) and plated on ampicillin-resistant agar Petri dishes. This DH5α library contained 106 colonies. The plasmid was miniprepped and used to transform the unevolved H131-A31 strain using the Frozen-EZ Yeast Transformation II kit (Zymo Research). The resulting yeast library was grown on glucose-containing agar plates and the appropriate amino acid dropouts for selection and 5 × 10⁵ colonies formed. The library was simultaneously grown on xylose-containing agar plates. Even after a prolonged incubation of a week, only tiny colonies appeared and no size differentiation was observed on the xylose plates. Furthermore, these plates looked identical to plates containing a control strain with an empty plasmid. Thus, the tiny colonies observed on each set of plates were likely due to growth on other carbon sources in the agar.
Escherichia coli strains
The E. coli strains used in this study were derived from TG108 and TG113 (ref. 31). These strains produce optically pure L-lactate and D-lactate, respectively. TG108 was transformed with the cloning vector pBR322 (ampR, tetR) and TG113 was transformed with the cloning vector pACYC184 (cmlR, tetR) simply for the purpose of conferring antibiotic resistance. In this way, the plasmids were maintained in mixed populations of these two strains by supplementing the medium with 20 μg/ml tetracycline. Similarly, the enrichment of sorted populations was determined by plating in the presence of carbenicillin (growth of TG108) or chloramphenicol (growth of TG113).
Shake flask fermentations
The yeast fermentations used in this study were performed in 250-ml Erlenmeyer flasks at 30 °C using an orbital shaker rotation speed of 225 r.p.m. Microaerobic fermentations were performed by bubbling nitrogen through the shake flask contents and sealing with a rubber stopper that contained a needle. The medium contained 1× yeast nitrogen base without amino acids (Difco), the desired concentration of xylose (Sigma), and the amino acids necessary to complement the auxotrophic markers and maintain the plasmids. In the experiments using H131-A31 and related strains, the media contained 20 g/liter xylose. For all other experiments, the xylose concentration was 5 g/liter.
The E. coli fermentations used in this study were performed in 250-ml Erlenmeyer flasks at 37 °C using an orbital shaker rotation speed of 200 r.p.m. For all experiments, the medium contained 1 × MOPS buffer solution (Teknova), 1.32 mM dibasic potassium phosphate (Sigma), 1 mM betaine (Sigma), 60 g/liter glucose (Sigma) and 20 μg/ml tetracycline (Sigma).
Analytical measurements
For the quantification of xylose and lactate concentrations from shake flasks, cell-free culture supernatants were filtered through 0.2-μm-pore-size polytetrafluoroethylene membrane syringe filters (VWR International). These samples were analyzed in a high-performance liquid chromatography (HPLC) system with a Waters 2690 Separations module connected with a Waters 410 refractive index detector (Waters). The samples were separated on a Aminex HPX-87H ion exclusion column (BioRad) for organic acid analysis with 14 mM sulfuric acid as the mobile phase at a flow rate of 0.7 ml/min. For cell density determinations, the optical densities of cultures were measured at 600 nm using an Ultrospec 2100 pro UV/visible spectrophotometer (Amersham Biosciences).
The L-isomer of lactate was also quantified by an enzymatic method in a 384-well plate format using a Fusion plate reader (Packard). Sample preparation followed the same protocol as the HPLC measurement. The assay mixture contained phosphate buffered saline (PBS), 0.2 mM Amplex UltraRed (Invitrogen), 0.4 U/ml horseradish peroxidase (Sigma) and 1 U/ml lactate oxidase (Sigma). The assay reaction was initiated by adding 20 μl of the assay mixture to each well containing 20 μl of filtered sample, standard or control and was allowed to proceed at room temperature for 20 min before measurement. The excitation and emission wavelengths used for the plate assay measurement were 488 nm and 590 nm, respectively.
Microfluidic device fabrication
Microfluidic devices were fabricated by using standard soft lithography techniques. SU-8 2025 and 2050 photoresists (MicroChem) were spin-coated at either a 25- or 75-μm thickness on 3-inch test grade silicon wafers. The channel pattern was photolithographically defined by a film mask printed at 20,000 dpi. After developing the photo-resist, poly(dimethylsiloxane) (Sylgard 184 Silicone Elastomer Kit from Dow Chemical) in a 10:1 silicone to cross-linker ratio was poured onto the wafer. After degassing for 10 min and curing overnight at 65 °C, the PDMS devices were cut from the mold, the inlets and outlets were formed with a biopsy punch, and the PDMS was bonded to glass slides after exposure to an oxygen plasma. The 2 inch × 3 inch glass slides for devices with electrodes contained an indium tin oxide coating (Delta Technologies) on the surface opposite the device. Electrodes were made in the device using a procedure similar to the one described by Siegel et al.35. The electrode channels were first coated with 0.1 M (3-mercaptopropyl)trimethoxysilane (Sigma) dissolved in acetonitrile (Sigma) and afterwards air was blown to remove the solution. The device was then baked at 65 °C to remove any remaining solution. When the device was placed on a hot plate at 80 °C, Indalloy 19 solder (52% In, 32.5% Bi, 16.5% Sn, 0.020 inch diameter wire from Indium Corporation) was placed in the electrode inlets and allowed to melt. Once the solder reached the outlets, 22 gauge wire was placed in the outlets to form an external electrical connection. All other devices used uncoated 2 inch × 3 inch Swiss Glass slides. Before using the microfluidic devices, the PDMS channel surface was made hydrophobic by injecting Aquapel (PPG) into the channels and then blowing air to remove the Aquapel.
Statistics
For all experiments where statistical significance was stated, the sample size was denoted in each figure caption. Statistical models were used to test statistical significance for data sets with multiple time points. These data sets had biological replicates for each time point. Biological replicates were generated by using separate cultures. In the statistical models, the effect variables were time and the groups being compared (e.g., control and experiment group) and the response was the measured variable (e.g., xylose consumption). Statistical significance was denoted when P < 0.05 for the effect of the group variable. We also confirmed that the residuals had a normal distribution. The sample sizes were chosen to ensure that with a confidence interval of 95% and a statistical power of 0.80, we have sufficient statistical power to identify differences greater than three times the s.d. of the replicates when the number of replicates is greater than or equal to 2. The calculated P values and the equation used to calculate the sample sizes based on the statistical power are listed in Supplementary Note 8.
Supplementary Material
Acknowledgments
We acknowledge support by Department of Energy Grant DE-FC36-07G017058, Royal Dutch Shell, and the Singapore-MIT Alliance. The authors would like to thank A. Abate for writing the LabView detection/sorting code, K. Humphry for her initial help on the project, Raindance Technologies for providing fluorinated surfactants and oils. We also thank the Ingram laboratory for providing strains TG108 and TG113.
Footnotes
Note: Any Supplementary Information and Source Data files are available in the online version of the paper.
AUTHOR CONTRIBUTIONS
B.L.W., A.G. and G.S. planned the experiments, interpreted results and wrote the manuscript. B.L.W. developed the integrated microfluidic screening system and performed the xylose consumption experiments. A.G. performed the lactate production experiments. H.Z. created the xylose-consuming strains. H.Z. and B.L.W. constructed the yeast genomic DNA library and performed analysis on the high xylose–consuming strain. G.R.F. provided guidance in designing and constructing the yeast genomic DNA library. J.A. built the microfluidic detection and sorting stand. D.A.W. and J.A. provided technical advice regarding the microfluidic droplet system.
COMPETING FINANCIAL INTERESTS
The authors declare no competing financial interests.
References
- 1.Alper H, Fischer C, Nevoigt E, Stephanopoulos G. Tuning genetic control through promoter engineering. Proc Natl Acad Sci USA. 2005;102:12678–12683. doi: 10.1073/pnas.0504604102. [DOI] [PMC free article] [PubMed] [Google Scholar]
- 2.Bailey JE, et al. Inverse metabolic engineering: a strategy for directed genetic engineering of useful phenotypes. Biotechnol Bioeng. 1996;52:109–121. doi: 10.1002/(SICI)1097-0290(19961005)52:1<109::AID-BIT11>3.0.CO;2-J. [DOI] [PubMed] [Google Scholar]
- 3.Martin VJJ, Pitera DJ, Withers ST, Newman JD, Keasling JD. Engineering a mevalonate pathway in Escherichia coli for production of terpenoids. Nat Biotechnol. 2003;21:796–802. doi: 10.1038/nbt833. [DOI] [PubMed] [Google Scholar]
- 4.Atsumi S, Hanai T, Liao JC. Non-fermentative pathways for synthesis of branched-chain higher alcohols as biofuels. Nature. 2008;451:86–89. doi: 10.1038/nature06450. [DOI] [PubMed] [Google Scholar]
- 5.Alper H, Moxley J, Nevoigt E, Fink GR, Stephanopoulos G. Engineering yeast transcription machinery for improved ethanol tolerance and production. Science. 2006;314:1565–1568. doi: 10.1126/science.1131969. [DOI] [PubMed] [Google Scholar]
- 6.Doshi R, Nguyen T, Chang G. Transporter-mediated biofuel secretion. Proc Natl Acad Sci USA. 2013;110:7642–7647. doi: 10.1073/pnas.1301358110. [DOI] [PMC free article] [PubMed] [Google Scholar]
- 7.Liu X, Sheng J, Curtiss R. Fatty acid production in genetically modified cyanobacteria. Proc Natl Acad Sci USA. 2011;108:6899–6904. doi: 10.1073/pnas.1103014108. [DOI] [PMC free article] [PubMed] [Google Scholar]
- 8.Wei N, Xu HQ, Kim SR, Jin YS. Deletion of FPS1, encoding Aquaglyceroporin Fps1p, improves xylose fermentation by engineered Saccharomyces cerevisiae. Appl Environ Microbiol. 2013;79:3193–3201. doi: 10.1128/AEM.00490-13. [DOI] [PMC free article] [PubMed] [Google Scholar]
- 9.Sonderegger M, Schumperli M, Sauer U. Selection of quiescent Escherichia coli with high metabolic activity. Metab Eng. 2005;7:4–9. doi: 10.1016/j.ymben.2004.05.005. [DOI] [PubMed] [Google Scholar]
- 10.Weaver JC, Williams GB, Klibanov A, Demain AL. Gel microdroplets - rapid detection and enumeration of individual microorganisms by their metabolic-activity. Bio/Technology. 1988;6:1084–1089. [Google Scholar]
- 11.Tawfik DS, Griffiths AD. Man-made cell-like compartments for molecular evolution. Nat Biotechnol. 1998;16:652–656. doi: 10.1038/nbt0798-652. [DOI] [PubMed] [Google Scholar]
- 12.Aharoni A, Amitai G, Bernath K, Magdassi S, Tawfik DS. High-throughput screening of enzyme libraries: thiolactonases evolved by fluorescence-activated sorting of single cells in emulsion compartments. Chem Biol. 2005;12:1281–1289. doi: 10.1016/j.chembiol.2005.09.012. [DOI] [PubMed] [Google Scholar]
- 13.Miller OJ, et al. Directed evolution by in vitro compartmentalization. Nat Methods. 2006;3:561–570. doi: 10.1038/nmeth897. [DOI] [PubMed] [Google Scholar]
- 14.Link DR, Anna SL, Weitz DA, Stone HA. Geometrically mediated breakup of drops in microfluidic devices. Phys Rev Lett. 2004;92:054503. doi: 10.1103/PhysRevLett.92.054503. [DOI] [PubMed] [Google Scholar]
- 15.Ahn K, Agresti J, Chong H, Marquez M, Weitz DA. Electrocoalescence of drops synchronized by size-dependent flow in microfluidic channels. Appl Phys Lett. 2006;88:264105. [Google Scholar]
- 16.Ahn K, et al. Dielectrophoretic manipulation of drops for high-speed microfluidic sorting devices. Appl Phys Lett. 2006;88:024104. [Google Scholar]
- 17.Huebner A, et al. Quantitative detection of protein expression in single cells using droplet microfluidics. Chem Commun (Camb) 2007;12:1218–1220. doi: 10.1039/b618570c. [DOI] [PubMed] [Google Scholar]
- 18.Agresti JJ, et al. Ultrahigh-throughput screening in drop-based microfluidics for directed evolution. Proc Natl Acad Sci USA. 2010;107:4004–4009. doi: 10.1073/pnas.0910781107. [DOI] [PMC free article] [PubMed] [Google Scholar]
- 19.Zhou M, Diwu ZJ, Panchuk-Voloshina N, Haugland RP. A stable nonfluorescent derivative of resorufin for the fluorometric determination of trace hydrogen peroxide: applications in detecting the activity of phagocyte NADPH oxidase and other oxidases. Anal Biochem. 1997;253:162–168. doi: 10.1006/abio.1997.2391. [DOI] [PubMed] [Google Scholar]
- 20.Zhu A, Romero R, Petty HR. Amplex UltraRed enhances the sensitivity of fluorimetric pyruvate detection. Anal Biochem. 2010;403:123–125. doi: 10.1016/j.ab.2010.04.008. [DOI] [PMC free article] [PubMed] [Google Scholar]
- 21.Chundawat SPS, Venkatesh B, Dale BE. Effect of particle size based separation of milled corn stover on AFEX pretreatment and enzymatic digestibility. Biotechnol Bioeng. 2007;96:219–231. doi: 10.1002/bit.21132. [DOI] [PubMed] [Google Scholar]
- 22.Hahn-Hagerdal B, Karhumaa K, Jeppsson M, Gorwa-Grauslund MF. In: Biofuels. Olsson L, editor. Springer; Berlin: 2007. pp. 147–177. [DOI] [PubMed] [Google Scholar]
- 23.Kuyper M, et al. Evolutionary engineering of mixed-sugar utilization by a xylose-fermenting Saccharomyces cerevisiae strain. FEMS Yeast Res. 2005;5:925–934. doi: 10.1016/j.femsyr.2005.04.004. [DOI] [PubMed] [Google Scholar]
- 24.van Maris AJA, et al. Alcoholic fermentation of carbon sources in biomass hydrolysates by Saccharomyces cerevisiae: current status. Antonie van Leeuwenhoek. 2006;90:391–418. doi: 10.1007/s10482-006-9085-7. [DOI] [PubMed] [Google Scholar]
- 25.Jeffries TW. Engineering yeasts for xylose metabolism. Curr Opin Biotechnol. 2006;17:320–326. doi: 10.1016/j.copbio.2006.05.008. [DOI] [PubMed] [Google Scholar]
- 26.Wagschal K, Franqui-Espiet D, Lee CC, Robertson GH, Wong DWS. Enzyme-coupled assay for beta-xylosidase hydrolysis of natural substrates. Appl Environ Microbiol. 2005;71:5318–5323. doi: 10.1128/AEM.71.9.5318-5323.2005. [DOI] [PMC free article] [PubMed] [Google Scholar]
- 27.Smith DR, et al. Rapid whole-genome mutational profiling using next-generation sequencing technologies. Genome Res. 2008;18:1638–1642. doi: 10.1101/gr.077776.108. [DOI] [PMC free article] [PubMed] [Google Scholar]
- 28.Ohnishi J, et al. A novel methodology employing Corynebacterium glutamicum genome information to generate a new L-lysine-producing mutant. Appl Microbiol Biotechnol. 2002;58:217–223. doi: 10.1007/s00253-001-0883-6. [DOI] [PubMed] [Google Scholar]
- 29.Zhou H, Cheng JS, Wang BL, Fink GR, Stephanopoulos G. Xylose isomerase overexpression along with engineering of the pentose phosphate pathway and evolutionary engineering enable rapid xylose utilization and ethanol production by Saccharomyces cerevisiae. Metab Eng. 2012;14:611–622. doi: 10.1016/j.ymben.2012.07.011. [DOI] [PubMed] [Google Scholar]
- 30.Zhang JZ. Evolution by gene duplication: an update. Trends Ecol Evol. 2003;18:292–298. [Google Scholar]
- 31.Grabar TB, Zhou S, Shanmugam KT, Yomano LP, Ingram LO. Methylglyoxal bypass identified as source of chiral contamination in L(+) and D(−)-lactate fermentations by recombinant Escherichia coli. Biotechnol Lett. 2006;28:1527–1535. doi: 10.1007/s10529-006-9122-7. [DOI] [PubMed] [Google Scholar]
- 32.Baret JC, Beck Y, Billas-Massobrio I, Moras D, Griffiths AD. Quantitative cell-based reporter gene assays using droplet-based microfluidics. Chem Biol. 2010;17:528–536. doi: 10.1016/j.chembiol.2010.04.010. [DOI] [PubMed] [Google Scholar]
- 33.Yamashita M, et al. Isolation, characterization, and molecular cloning of a thermostable xylitol oxidase from Streptomyces sp IKD472. J Biosci Bioeng. 2000;89:350–360. doi: 10.1016/s1389-1723(00)88958-6. [DOI] [PubMed] [Google Scholar]
- 34.Sun H, Treco D, Schultes NP, Szostak JW. Double-strand breaks at an initiation site for meiotic gene conversion. Nature. 1989;338:87–90. doi: 10.1038/338087a0. [DOI] [PubMed] [Google Scholar]
- 35.Siegel AC, Bruzewicz DA, Weibel DB, Whitesides GM. Microsolidics: fabrication of three-dimensional metallic microstructures in poly(dimethylsiloxane) Adv Mater. 2007;19:727–733. [Google Scholar]
Associated Data
This section collects any data citations, data availability statements, or supplementary materials included in this article.