Abstract
We have reported that a rapid tail vein injection of a large volume of plasmid DNA solution into a mouse results in high level of transgene expression in the liver. Gene transfer efficiency of this hydrodynamics-based procedure is determined by the combined effect of a large volume and high injection speed. Here, we show that the hydrodynamic injection induces a transient irregularity of heart function, a sharp increase in venous pressure, an enlargement of liver fenestrae, and enhancement of membrane permeability of the hepatocytes. At the cellular level, our results suggest that hepatic delivery by the hydrodynamic injection is accomplished by the generation of membrane pores in the hepatocytes.
Keywords: transfection, naked DNA, hydrodynamic delivery
Introduction
Elucidation of the physiological function of genes in the postgenome era has become rate-limiting step in the quest to understand the molecular basis of human diseases. Defining the physiological functions of a genomic sequence requires an analysis in the context of an entire organism using a gain- or loss-of-function approach. A crucial element to the successful physiologic assessment of gene function is an effective strategy for intracellular delivery of a genetic modifier into the target cells in the form of DNA, RNA, proteins or small chemicals.
We and others have reported in mice that efficient plasmid DNA delivery to liver can be achieved by a rapid tail vein injection of a large volume of DNA solution.1,2 This method, called the hydrodynamics-based procedure, has been widely utilized by the gene therapy community for evaluating therapeutic activities of various genes (see, for reviews, Liu and Knapp3 and Herweijer and Wolff4). Other reported applications of this technique include studies to define the regulatory functions of DNA sequences,5-9 investigations to evaluate gene suppression activity of siRNA,10-12 and experiments to establish animal models for viral infection.13,14
Despite many desirable features of the hydrodynamics-based procedure such as simplicity, convenience, and high efficiency, further improvement and new applications of this procedure require a full understanding of the mechanisms underlying this technique. For tail vein injection and hepatic delivery in mice, the route for which the current protocol was established, the hydrodynamic injection is able to overcome at least three physical barriers, (1) a spatial barrier between the site of injection (tail vein) and the targeted organ (liver); (2) the structural barrier of liver fenestrae that prevent the access of large molecules to parenchyma hepatocytes; and (3) the plasma membrane barrier of the hepatocytes that limits the entry of hydrophilic molecules into the cytoplasm, especially large molecules like DNA, RNA, and proteins. In the current study, we conducted a series of experiments to elucidate the mechanisms by which each of the three physical barriers is overcome by the hydrodynamic procedure. We discuss our results in the context of how our conclusions can be used for the development of new and improved procedures.
Results
Hydrodynamic injection induces a transient irregularity in heart function and a rapid increase in vena cava pressure
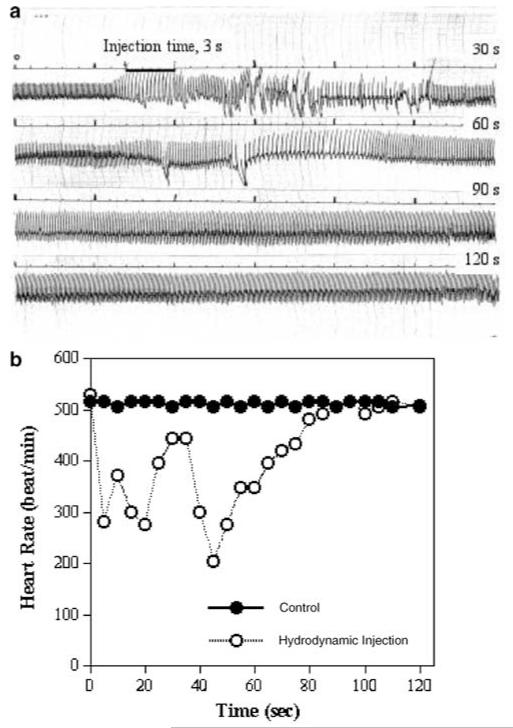
We suspect that the hydrodynamic injection would result in changes in heart function and venous pressure because the injection volume required for efficient hepatic delivery is approximately equivalent to the total blood volume of a mouse.1,2 To provide a quantitative assessment of the cardiovascular changes, we recorded the electrocardiogram (ECG) and pressure in mice following hydrodynamic treatment. Figure 1 summarizes the changes that occurred in the measured parameters. Figure 1a is a representative ECG of a mouse undergoing the entire hydrodynamic injection. It is evident that cardiac rhythm was interrupted as the injection initiated. However, the irregular rhythm lasted only about 60 s before a regular pattern of ECG was restored (Figure 1a). The heart rate decreased from about 510 beat/min to 280 beat/min within 3 s and returned to a normal level in about 2 min (Figure 1b). The increased amplitude of the QRS complex after the recovery of normal heart rate indicates that the cardiac chambers were enlarged due to the increased volume in circulation. Clearly, the hydrodynamic injection causes a transient heart congestion.
Figure 1.
Impact of the hydrodynamic injection on cardiac function. (a) Representative ECG from mice following the hydrodynamic injection and (b) the heart rate.
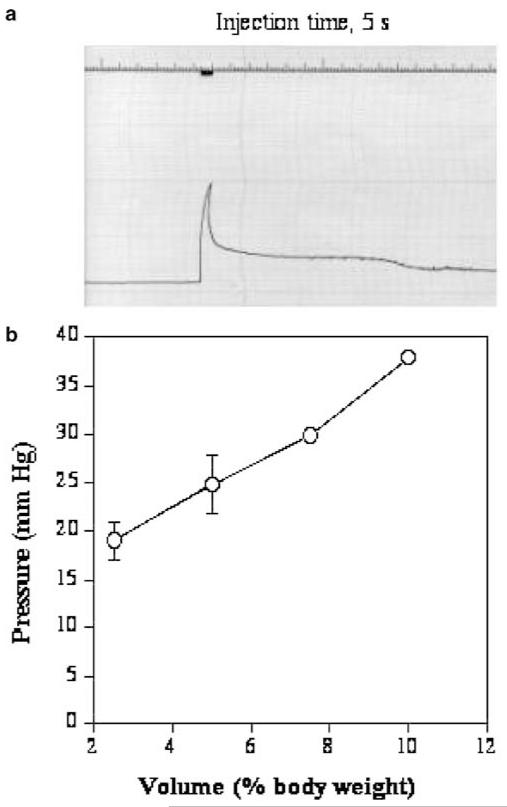
The effect of the hydrodynamic injection on venous pressure was evaluated using a saline-filled catheter inserted retrograde into the right renal vein to the point at which the renal vein enters the inferior vena cava. The renal vein was selected as the catheter insertion site to minimize the potential interference of circulation. As shown in Figure 2a, the abrupt increase in venous pressure coincides with the reduction in cardiac rate (Figure 1b). The venous pressure attained a peak level at the end of injection and then fell rapidly to a level of 10–15 mmHg above the original baseline pressure, followed by a much slower phase of decline. The relationship between the injection volume and venous pressure is shown in Figure 2b. A pressure at about 40 mmHg is attained with the injection volume equivalent to 10% of body weight, a volume which gives a maximal level of hepatic gene delivery in mice.1,2
Figure 2.
Impact of the hydrodynamic injection on inferior vena cava pressure. Catheter was inserted to the point of vena cava through a renal vein. (a) Polygraph showing the intravascular pressure of the inferior vena cava as the function of time. (b) Relationship between the injection volume and venous pressure (n = 3–5). Each grade on the top line represents 1 s and each horizontal line represents 5 mmHg.
The rapid decrease of venous pressure soon after the injection (Figure 2a) and before a full recovery of heart function (Figure 1a) indicates that a rapid venous pressure equilibration occurs. Significant liver expansion was observed when the hydrodynamic injection was performed in anesthetized animals with the liver visually exposed via an abdominal incision. In addition, the color of the liver changed from its normal reddish hue to whitish soon after the hydrodynamic injection was initiated and then returned to its normal color. This finding suggests that the injected solution transiently displaces and dilutes the blood flowing through the liver. Moreover, these observations indicate that DNA enters the liver before homogeneous mixing with blood can occur.
Hydrodynamic injection enlarges liver fenestrae
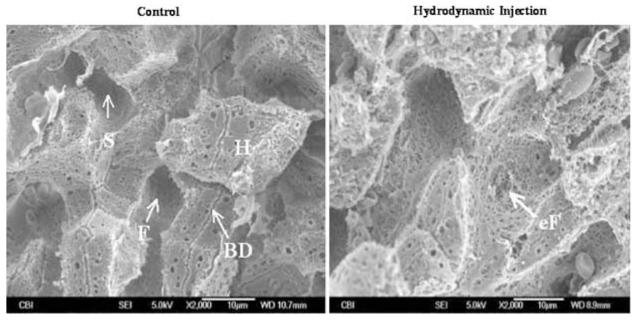
Capillaries of the liver are lined with endothelial cells. Approximately 92–94% of the surface area of the liver endothelial cells is sealed preventing direct access of blood constituents to the hepatocytes.15 The other 6–8% consists of pores with an average diameter of 100 nm.16 These pores, referred to as the liver fenestrae, appear to be too small to allow large molecules like plasmid DNA to pass through. Therefore, the liver endothelium, although being porous, serves as a physical barrier for delivery of large molecules to the hepatocytes. Fraser et al17 reported an enlargement of liver fenestrae when high pressure was used in liver perfusion. We hypothesized that the pressure increase imposed by the hydrodynamic injection would result in an enlargement of the pore diameter of the fenestrae and thereby facilitate DNA transfer across the liver capillary endothelial cells. To test this possibility, we examined the capillary structure of animals after the hydrodynamic injection and compared it to that of control animals. The left panel in Figure 3 is a scanning electron microscopy (SEM) micrograph of a liver section from a control animal showing sinusoids and uniformly sized pores of liver fenestrae in well-organized patterns. In hydrodynamically treated animals, however, some of the fenestrae are enlarged and irregular (Figure 3, right panel). Pores as large as a few μm in diameter were seen. It is important to point out that while distorted endothelial cells is evident in the liver of hydrodynamically treated animals, the endothelial cells with normal appearance also exist. These results suggest that the impact of the hydrodynamic injection on liver capillaries is not homogeneous; some areas are affected more than others. This could explain why only 40% of the hepatocytes were transfected by a single hydrodynamic injection.1
Figure 3.
SEM micrograph showing capillary structures of the liver. Left panel: liver from a control mouse. Right panel: liver from a hydrodynamically treated mouse. BD, bile duct; H, hepatocytes; F, fenestrae; S, sinusoid; eF, enlarged fenestrae.
Hydrodynamic delivery to the hepatocytes is a nonspecific process
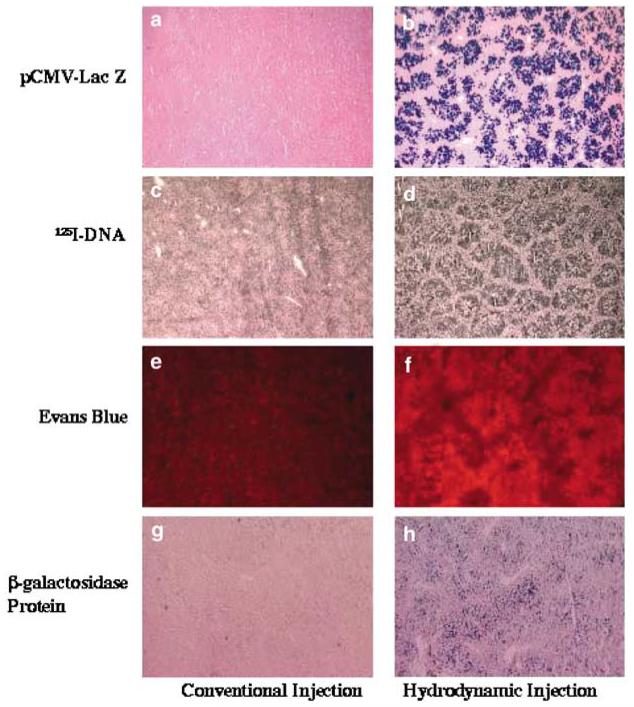
To evaluate the versatility of the hydrodynamics-based procedure at the cellular level and to determine the mechanistic nature of the intracellular delivery, we have injected into mice with various types of molecules that are different in structure and property. Among these are unlabeled plasmid DNA containing a reporter gene, 125I-labeled plasmid DNA, Esherichia coli β-galactosidase, and a fluorescence dye. The liver uptake and hepatic distribution of these molecules were examined separately using histochemical methods and compared to those of control animals that received the same dosage of substances in a small volume (200–300 μl). Figure 4 shows that all four types of molecules are efficiently delivered to the hepatocytes by the hydrodynamic injection (Figure 4, right column), while minimal signal was seen in controls (Figure 4, left column). Patterns of tissue distribution of transgene expression shown in Figure 4b are very similar to those of 125I-DNA (Figure 4d), Evans Blue (Figure 4f), and β-galactosidase protein (Figure 4h). The fact that these structurally different molecules were delivered to a portion of the hepatocytes with similar efficiency and virtually the same patterns of hepatic distribution suggest that hepatic delivery by the hydrodynamic injection is a nonspecific process.
Figure 4.
Hepatic distribution of gene product, 125I-DNA, Evans Blue, and β-galactosidase protein. (a, b) β-galactosidase gene expression in the liver of mouse injected with 50 μg of pCMV-Lac Z plasmid DNA; (c, d) autoradiograms of a liver section from a mouse injected with 300 μg of 125I-DNA (specific activity = 1 ×10⁷ c.p.m./μg); (e, f) hepatic distribution of Evans Blue; (g, h) hepatic distribution of β-galactosidase protein in the liver of a mouse injected with 30 U of β-galactosidase protein. Photographs on the left column are from control animals and those on the right are from animals receiving the hydrodynamic injection.
Hydrodynamic injection generates membrane pores in the hepatocytes
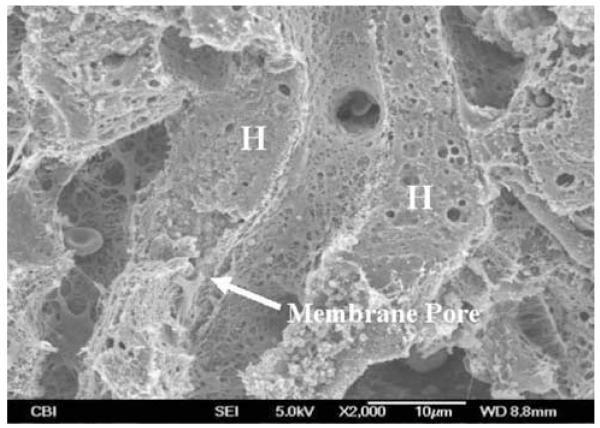
The nonspecific nature of the hydrodynamic delivery was further studied. We reasoned that the hydrodynamic force generated by a rapid injection of a large volume of solution could generate membrane defects (or pores) in the hepatocytes. Consequently, these membrane defects may allow a direct entry of DNA or other substances into the cytoplasm. To test this possibility, we examined liver samples from the hydrodynamically treated animals using SEM. Figure 5 shows an example of membrane defect identifiable under an electron microscope (arrow). It is worth noting that the interior of the cell shown in Figure 5 appears disturbed. An entry mark of solution into cells is clearly identifiable near the membrane entry site and becomes progressively less obvious towards the far side of the same cell. These results suggest that hydrodynamically injected solution generates membrane defects and disturbs the cell interior.
Figure 5.
SEM micrograph showing membrane defect generated by the hydrodynamic injection. H; hepatocytes.
Membrane pores reseal with time
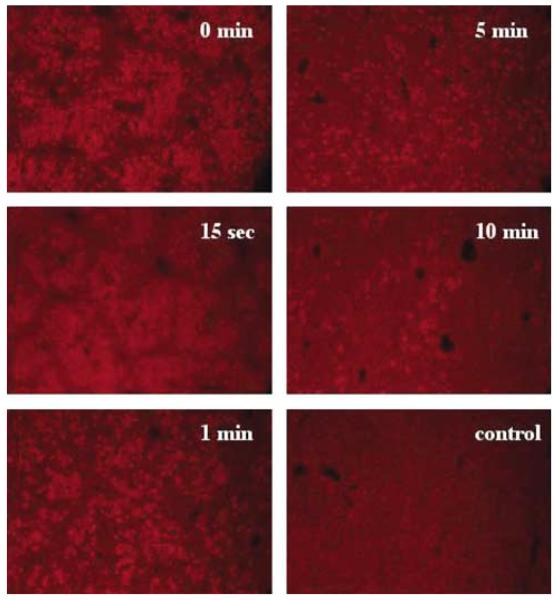
To measure how long these membrane defects remain open after the hydrodynamic injection, we treated the mice with the hydrodynamic injection of saline prior to a conventional injection of Evans Blue (200 μl), which is one of the most commonly used markers for membrane permeability studies.18 In these experiments, animals were killed 6 h after Evans Blue injection. Liver sections from the animals were made and examined under a fluorescence microscope. Figure 6 shows that a relative level of Evans Blue in the liver decreases with increasing the interval time between the two injections, indicating a reduced membrane permeability of liver cells with time. At an interval time of 15 s, a slight decrease in Evans Blue-positive cells was seen compared to that of single injection (t = 0 min). However, many fewer Evans Blue-positive cells were seen in liver sections when the interval time increased to 10 min, suggesting that most of the membranes had resealed.
Figure 6.
Time-dependent membrane resealing. Animals were hydrodynamically injected with saline followed by an injection of Evans Blue solution (3 mg per mouse in 200 μl) with an interval time of 0, 15 s, 1, 5, or 10 min, respectively. The control animal received 200 μl of saline for the first injection.
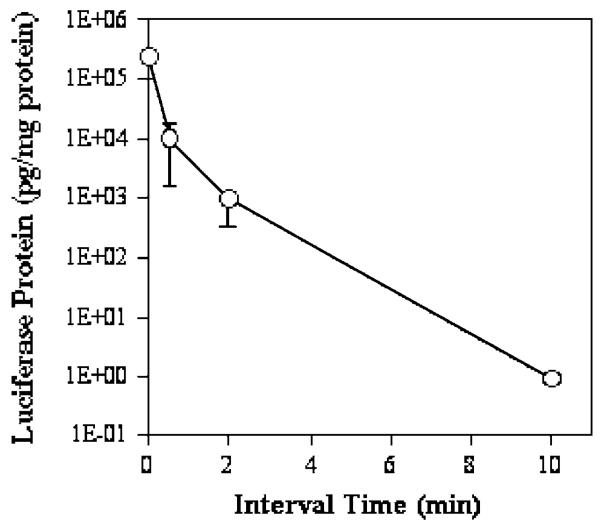
In a parallel set of experiments, plasmid DNA with a reporter gene was utilized as a different membrane permeability probe in the second injection. An additional purpose of these experiments was to prove that cells with membrane pores are able to recover not only structurally but also functionally using transgene expression as a measure. There is a 5 × 10⁵-fold drop in luciferase expression in the liver of animals injected with an interval time of 10 min compared to that of animals with a single injection (t = 0 min) (Figure 7). These results provide convincing evidence that the hydrodynamic injection increases membrane permeability of the hepatocytes by generating membrane defects.
Figure 7.
Effect of sequential injection of saline (1st) and plasmid DNA (2nd) on the level of transgene expression. Hydrodynamically treated animals were injected with 50 μg of pCMV-Luc plasmid DNA (in 200 μl) at different time intervals. Luciferase gene expression was analyzed 8 h post-DNA injection (n = 5).
Effect of volume increase in cytosol on transgene expression
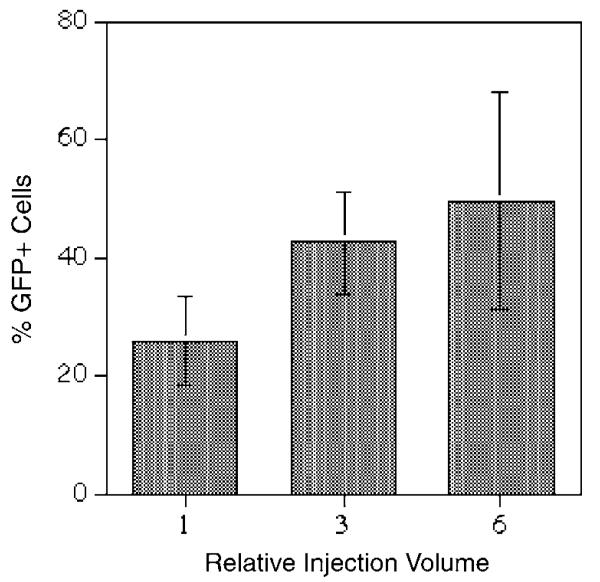
Previous studies have shown that diffusion rate of plasmid DNA in cytoplasm is very low due to a well-organized cytosolic structure.19 For this reason, transfer of DNA from cytoplasm to nucleus where gene expression initiates has been considered as an intracellular barrier for nonviral gene delivery.20 On the other hand, a high level of transgene expression in the hepatocytes by hydrodynamics-based procedure would suggest that this intracellular barrier is overcome effectively. We hypothesized that the volume entering the hepatocytes upon the hydrodynamic injection may be relatively large due to the high extracellular pressure. A large volume of solution entering the hepatocytes may play a role in inducing a high level of transgene expression. To test this possibility, we have examined the volume effect on transgene expression from cells receiving exogenous DNA. In these experiments, GFP-expressing plasmid DNA was injected into individual cells using a standard microinjection technique.21 The same copy number of GFP plasmids was injected into cells with increasing volume (from approximately 5 to 10% cytoplasmic volume at a relative injection volume of 1 to 50–70% cytoplasmic volume at a relative volume of 6) under the same intracellular pressure. The level of GFP expression in each injected cell was examined 6 h later using a fluorescence microscope. At 6 h postinjection, GFP expression should be a measure of cytoplasmic trafficking and nuclear import of DNA, since the cells have not yet divided.22 Data in Figure 8 show that the percentage of GFP-positive cells increases with increasing injection volume. The percentage of GFP-positive cells almost doubles when the injection volume increased from a relative volume of 1 (~5–10% cytoplasmic volume) to 6 (~50–70% cytoplasmic volume) per cell. Transfection efficiency reaches 50% with a relative injection volume of 6 compared to 26% at a relative injection volume of 1.
Figure 8.
Effect of the injection volume on transfection efficiency. Each cell was injected with 35 fg (approximately 5000 copies) of pCMV-GFP plasmid DNA in various volumes. GFP-positive cells were determined 6 h postinjection using a fluorescence microscope (n = 339 for a relative volume 1, 208 for 3, and 303 for 6).
Discussion
Successful delivery of DNA to the hepatocytes via the tail vein injection needs to overcome at least three barriers, including the spatial barrier between the injection site and the liver, the endothelial barrier of liver capillaries, and the plasma membrane barrier of the hepatocytes. It is evident from the data presented in this and our previous studies1,23 that these barriers are overcome, at least to a certain degree, by using hydrodynamics-based procedure. Based on these data, we propose a model to explain the mechanism underlying hydrodynamic delivery to the hepatocytes.
A rapid injection of a large bolus of substance-containing solution via the tail vein results in an accumulation of the injected solution in the inferior vena cava as the volume of injected solution exceeds the capacity of the heart to pump blood from the venous side of the circulation to the arterial side. Subsequently, a high pressure develops in this venous region, which in turn causes a retrograde movement of the solution into the liver, the largest organ in the body with an expandable structure and direct vascular connection to the inferior vena cava. A large portion of the injected solution enters the liver via the hepatic vein at a high hydrodynamic pressure, forcing blood in the hepatic circulation to flow backward toward the portal blood vessels. As a consequence of the elevated pressure the pore sizes of the liver fenestrae are enlarged and the membrane of the hepatocytes is permeabilized due to the generation of membrane pores (defects). Consequently, substances are driven into the hepatocytes by a high intravascular pressure. The membrane of the hepatocytes reseals with time, trapping the substances inside. With time the cardiovascular system adapts to the volume load and normal circulatory homeostasis is restored.
The fact that less than half of the total hepatocytes in the liver are susceptible to the hydrodynamics-based procedure1,23 indicates that the hydrodynamic impact at cellular level is not homogenous. This could be explained by the differences in the capillary structure of the liver. Hepatic sinusoids can be seen as conduits connecting the terminal portal venules and terminal hepatic arteriole with the hepatic venules. These conduits are neither geographically nor structurally equivalent. Morphometric measurements of sinusoidal profiles performed by image analysis have shown that periportal sinusoids are narrower and more tortuous, while perivenular sinusoids are straighter and wider.24 A more tortuous sinusoid is essential for a better adsorption of nutrients gathered from the intestine entering the liver via the portal vein. After the hydrodynamic injection, the flow of the injected solution is slowed down when it reaches the junction of the perivenular and periportal sinusoids. The narrower path and more tortuous structure of periportal sinusoids restrain the flow dynamics of the injected solution, causing congestion in the perivenular region and the expansion of the perivenular sinusoids. Consequently, fenestrae are enlarged and membrane pores are generated on the hepatocytes by high-pressure solution in perivenular regions. Owing to the limited volume of solution reaching the periportal venules, the hydrodynamic pressure in periportal sinusoids is not sufficient to enhance the permeability of fenestrae and plasma membrane of the hepatocytes, limiting the delivery to those hepatocytes in the perivenous sinusoids. This explanation is supported by our previous work demonstrating the perivenous sinusoids as the predominant site of transgene expression in mice.25
It is appropriate to point out that how DNA crosses the plasma membrane and enters the hepatocytes has been a critical issue in the past few years with respect to the hydrodynamic delivery. Budker et al26 have hypothesized that DNA entry is mediated by unidentified receptors on the hepatocytes. Their hypothesis was based on an observation that the reporter gene expression decreased by approximately 10–50% when dextran sulfate, salmon sperm DNA, or heparin was coinjected with reporter containing plasmid DNA. However, the data from our laboratory and from others24 are in favor of a different mechanism that stresses the physical nature of the procedure, not a receptor-mediated DNA internalization. Our hypothesis was based on the observation that the hydrodynamic delivery does not exhibit any specificity toward DNA structures. Plasmid DNA either in supercoil or linear, large or small was all effectively delivered into the hepatocytes with the same efficiency. The nonspecific nature of the hydrodynamic delivery has been further strengthened by recent studies demonstrating hepatic delivery of siRNA,10-12 PCR fragments,27 RNA,13,14 antibodies, and polyethyleneglycol.24
The data presented in the current study provide additional evidence in support of our initial hypothesis and prove that hepatic transfer of DNA via the hydrodynamic injection is a physical process. Similar to the mechanism of electroporation where membrane pores are generated by ion movement in an electric field, the hydrodynamics-based procedure generates membrane pores by a highly pressured solution in the liver. Thus, we propose the term ‘hydroporation’ (pores generated by aqueous solution) to describe this process as an analogous term to the technique of electroporation. The mechanisms underlying pore formation and membrane resealing process with respect to these two different techniques will be an interesting subject for additional studies.
Despite that the hydrodynamic delivery is mostly utilized for hepatic gene delivery, its applications to other tissues have not been fully explored in the past. However, efforts are noticeable along this direction in recent publications. Zhang et al28 showed an efficient gene transfer to muscle cells by intravascular injection with the help of transient occlusion of the blood flow. High level of gene expression was also reported in the kidney cells through a hydrodynamic infusion of DNA solution to the renal vein.29 Employing a catheter-based injection system in rabbits, Easterman et al30 demonstrated local gene delivery within the liver at the catheter insertion site. The importance of these studies is a demonstration of a sound strategy to combine the principles of the hydrodynamic injection with the well-established medical devices for site-specific gene delivery. The promise of this strategy lies in the possibility of new procedure or devices that are applicable to large animals. The challenge we face is to establish hydrodynamic pressure in the target tissues that is sufficient to enhance the permeability of the endothelium and plasma membrane of the parenchyma cells.
Although the hydrodynamics-based procedure was initially developed for in vivo gene delivery,1 the physical nature of the procedure supports the possibility that it can be utilized for intracellular delivery of any substances that are injectable. Additional work on elucidating the mechanism of membrane resealing after the hydrodynamic injection, and on defining the role of volume increase in cytosol with respect to subcellular distribution of the delivered substances will provide information on how a physical stimulation to cells couples with biochemical response. In the current stage, hydrodynamic delivery appears to be the most simple, convenient, and efficient method for intracellular delivery in vivo.
Materials and methods
Materials
pCMV-Luc, pCMV-LacZ, and pCMV-GFP plasmids containing CMV-driven firefly luciferase, Lac-Z or green fluorescence protein gene (cDNA) were purified by the method of CsCl-ethidium bromide gradient centrifugation and kept in TE buffer (10 mm Tris-HCl, 1 mm EDTA, pH 8.0). The purity of the plasmid was checked by absorbency at 260 and 280 nm and 1% agarose-gel electrophoresis. Evans Blue and β-galactosidase protein were purchased from Sigma (Saint Louis, MO, USA); carrier-free Na125I was from DuPont NEN (Boston, MA, USA) and DNA iodination was performed according to Wolf et al,31 and luciferase assay kit was from Promega (Madison, WI, USA). CD-1 mice (18–20 g male) were obtained from Charles River (Wilmington, MA, USA).
Hydrodynamic injection
Animals were injected via the tail vein in a volume equivalent to 10% of the body weight in 5 s according to previously published procedure.1 Unless specified, saline was used as a carrier solution for injection.
Electrocardiogram
The ECG was recorded in anesthetized animals using two fine-needle electrodes inserted subcutaneously on the ventral thorax approximately above the base and apex of the heart. A third electrode served as ground and was placed in the left scapular region. The leads from the electrodes were connected to a tachograph (Grass Model 7P4) and the ECG and heart rate were continuously displayed on a Grass Model 7 polygraph.
Measurement of venous pressure
An abdomen incision was made on anesthetized animals to expose the internal organs in peritoneal cavity. A saline-filled catheter was inserted and advanced into the inferior vena cava by passing it retrogradely through the right renal vein. Venous pressure was continuously monitored on a Grass polygraph using a Gould Statham Pressure Transducer (Model P23 ID).
Autoradiography of the liver
125I-labeled pCMV-Luc plasmid DNA (300 μg/mouse, specific activity 107 c.p.m./μg) was injected into the mice using hydrodynamic procedure or the conventional method (control). At 5 min after injection, the animals were anesthetized and the livers were perfused with 10 ml of saline through the portal vein to remove blood and unbound DNA. The inferior vena cava was cut to create an outlet for perfusate drainage during washing, and the liver was dissected from the animal and immediately frozen on dry ice. Approximately 10 min elapsed between the injection of 125I-DNA and liver collection. Liver sections (10 μm) were performed using a Cryostat, stained with eosin, and coated with photographic emulsion. The emulsion-coated slides were exposed for 7 days at 41C in light-sealed container. The developed slides were observed under a light microscope.
Scanning electron microscopy
Anesthetized mice were hydrodynamically injected with saline. Immediately after injection, an incision was made at the abdomen and the liver was perfusion fixed with 10 ml of 2.5% glutaraldehyde in phosphate-buffered saline (PBS) at a perfusion rate of 2 ml/min. The liver was removed from the animal and immersed in the same fixative overnight. Livers slices (1 mm thick) were washed three times in PBS, postfixed for 1 h in aqueous 1% osmium tetroxide, and then washed three times in PBS. Samples were dehydrated through a graded ethanol series (30–100%), further dehydrated by three additional 15 min washes with absolute ethanol then critical point dried (Emscope CPD 750, Ashford, Kent UK). Dried slices were mounted onto aluminum stubs then sputter coated with gold/platinum (Cressington Auto 108, Cressington, Watford, UK). Samples were viewed in a JEOL JSM-6330F scanning electron microscope (Peabody, MA) at 10 kV.
Fluorescence microscopy
Mice were injected using the hydrodynamic procedure or the conventional method (300 μl/mouse) with saline containing 3.0 mg of Evans Blue. Animals were killed 6 h later and the liver was removed from the animal and immediately frozen in powdered dry ice. Liver sections (10 μm thick) were prepared using a Cryostat and immediately examined by fluorescence microscope using a rhodamine filter.
β-galactosidase assay in the liver
pCMV-Lac Z plasmid DNA (50 μg) were injected into animals by either the conventional or the hydrodynamic injection. Histochemical analysis of β-galactosidase gene expression in the liver was performed 8 h postinjection. For animals injected with 30 U of β-galactosidase protein, histochemical analysis was performed 4 h postinjection. The analysis was performed as described previously.1 Briefly, mice were killed at the desirable time. The liver was dissected from the animals and frozen in powdered dry ice immediately after dissection. Liver sections (10 μm thick) were made using a Cryostat and fixed with 1% glutaraldehyde solution. For animals injected with pCMV-Lac Z, slides were then stained for 2 h at room temperature in 400 μg/ml X-gal solution and counterstained with eosin. For mice injected with β-galactosidase protein, slides were stained overnight at room temperature.
Luciferase assay
Luciferase assay was performed according to an established procedure.1 Briefly, approximately 200 mg of liver was homogenized in 1 ml of lysis buffer (0.1 m Tris-HCl, 2 mm EDTA, 0.1% Triton X-100, pH 7.8), followed by centrifugation for 10 min at 4°C and 10 000 g in a microcentrifuge. The supernatant was diluted, if needed, using HEPES buffer (70 mM HEPES, 7 mM MgSO4, 2 mM dithiothreitol, 0.1% bovine serum albumin, pH 7.7). The diluted samples (10 μl) were then used for the measurement of luciferase activity using automatic luminometer (AutoLumat LB 953, EG&G Berthold, Bad Wildad, Germany), which pumps 100 μl of luciferase assay reagent and measures photons for 10 s. Luciferase activity obtained as relative light units (RLUs) was converted to luciferase mass using a standard curve established using reagents and procedure from Analytic Luminescence Laboratory (ALL, San Diego, CA, USA). The conversion formula is [luciferase protein in pg] = [7.98 × 10⁻⁵] × [RLU] + 0.093, where R2 = 0.9999. Protein concentration of the liver extract was determined by Bradford’s method using a protein assay kit (BioRad, Hercules, CA, USA). Luciferase activity was normalized to pg luciferase per mg extracted protein.
Microinjection
TC7 cells, a subline of African Green monkey kidney epithelial cells, were grown on Cellocate coverslips (Eppendorf, Westbury, NY) to approximately 50% confluency as described previously.19 Plasmid pCMV-GFP was suspended in Tris buffer (Tris-HCl, 10 mm, pH 8, 1 mm EDTA, 70 mm NaCl) and quantified spectrophotometrically. Cells were cytoplasmically microinjected using an Eppendorf Femtojet microinjection system using a pressure of 145 hPa, but with varying injection times. To inject the same numbers of plasmids at varying volumes, cells were cytoplasmically injected with plasmid at 300 ng/μl for 0.1 s, 100 ng/μl for 0.3 s, or 50 ng/μl for 0.6 s. At an injection time of 0.3 s, approximately 0.1 pl was injected, corresponding to ~20% of the cytoplasmic volume of TC7 cells.21 Approximately 100 cells were injected at each concentration in each of the three independent experiments. At 6 h postinjection, cells were scored for GFP expression by fluorescence microscopy.
Acknowledgements
We would like to acknowledge that the term ‘hydroporation’ was originally proposed by Dr Ning-Sun Yang at the Institute of BioAgricultural Sciences, Academia Sinica, Taipei, Taiwan. This work was supported in part by grants from NIH CA72529 to D Liu, HL60652 to X Gao, and HL59956, HL71643 to D Dean.
References
- 1.Liu F, Song YK, Liu D. Hydrodynamics-based transfection in animals by systemic administration of plasmid DNA. Gene Therapy. 1999;6:1258–1266. doi: 10.1038/sj.gt.3300947. [DOI] [PubMed] [Google Scholar]
- 2.Zhang G, Budker V, Wolff JA. High levels of foreign gene expression in hepatocytes after tail vein injections of naked plasmid DNA. Hum Gene Ther. 1999;10:1735–1737. doi: 10.1089/10430349950017734. [DOI] [PubMed] [Google Scholar]
- 3.Liu D, Knapp JE. Hydrodynamics-based gene delivery. Curr Opin Mol Ther. 2001;3:192–197. [PubMed] [Google Scholar]
- 4.Herweijer H, Wolff JA. Progress and prospects: naked DNA gene transfer and therapy. Gene Therapy. 2003;10:453–458. doi: 10.1038/sj.gt.3301983. [DOI] [PubMed] [Google Scholar]
- 5.Ehrhardt A, et al. Optimization of cis-acting elements for gene expression from nonviral vectors in vivo. Hum Gene Ther. 2003;14:215–225. doi: 10.1089/10430340360535779. [DOI] [PubMed] [Google Scholar]
- 6.Kramer MG, et al. In vitro and in vivo comparative study of chimeric liver-specific promoters. Mol Ther. 2003;7:375–385. doi: 10.1016/s1525-0016(02)00060-6. [DOI] [PubMed] [Google Scholar]
- 7.Rivera IR, Kim J, Kemper B. Transcriptional analysis in vivo of the hepatic genes, Cyp2b9 and Cyp2b10, by intravenous administration of plasmid DNA in mice. Biochim Biophys Acta. 2003;1619:254–262. doi: 10.1016/s0304-4165(02)00484-1. [DOI] [PubMed] [Google Scholar]
- 8.Yant SR, et al. Somatic integration and long-term transgene expression in normal and haemophilic mice using a DNA transposon system. Nat Genet. 2000;25:35–41. doi: 10.1038/75568. [DOI] [PubMed] [Google Scholar]
- 9.Alino SF, Crespo A, Dasi F. Long-term therapeutic levels of human alpha-1 antitrypsin in plasma after hydrodynamic injection of nonviral DNA. Gene Therapy. 2003;10:1672–1679. doi: 10.1038/sj.gt.3302065. [DOI] [PubMed] [Google Scholar]
- 10.McCaffrey AP, et al. RNA interference in adult mice. Nature. 2002;418:38–39. doi: 10.1038/418038a. [DOI] [PubMed] [Google Scholar]
- 11.Lewis DL, et al. Efficient delivery of siRNA for inhibition of gene expression in postnatal mice. Nat Genet. 2002;32:107–108. doi: 10.1038/ng944. [DOI] [PubMed] [Google Scholar]
- 12.Song E, et al. RNA interference targeting Fas protects mice from fulminant hepatitis. Nat Med. 2003;9:347–351. doi: 10.1038/nm828. [DOI] [PubMed] [Google Scholar]
- 13.Chang JH, Sigal LJ, Lerro A, Taylor J. Replication of the human hepatitis delta virus genome is initiated in mouse hepatocytes following intravenous injection of naked DNA or RNA sequence. J Virol. 2001;75:3469–3473. doi: 10.1128/JVI.75.7.3469-3473.2001. [DOI] [PMC free article] [PubMed] [Google Scholar]
- 14.Yang PL, Althage A, Chung J, Chisari FV. Hydrodynamic injection of viral DNA: a mouse model of acute hepatitis B virus infection. Proc Natl Acad Sci USA. 2002;99:13825–13830. doi: 10.1073/pnas.202398599. [DOI] [PMC free article] [PubMed] [Google Scholar]
- 15.Gumucio JJ, Berkowitz CM, Webster ST, Thornton AJ. Structure and functional organization of the liver. In: Kaplowitz N, editor. Liver and Billiary Diseases. Williams and Wilkins; Baltimore, MD: 1996. pp. 3–19. [Google Scholar]
- 16.Wisse E, et al. The liver sieve: considerations concerning the structure and function of endothelial fenestrae, the sinusoidal wall and the space of Disse. Hepatology. 1985;5:683–692. doi: 10.1002/hep.1840050427. [DOI] [PubMed] [Google Scholar]
- 17.Fraser R, et al. High perfusion pressure damages the sieving ability of sinusoidal endothelium in rat liver. Br J Exp Pathol. 1980;61:222–228. [PMC free article] [PubMed] [Google Scholar]
- 18.Matsuda R, Nishikawa A, Tanaka H. Visualization of dystrophic muscle fibers in mdx mouse by vital staining with Evans Blue: evidence of apoptosis in dystrophin-deficient muscle. J Biochem (Tokyo) 1995;118:959–964. doi: 10.1093/jb/118.5.959. [DOI] [PubMed] [Google Scholar]
- 19.Lechardeur D, et al. Metabolic instability of plasmid DNA in the cytosol: a potential barrier to gene transfer. Gene Therapy. 1999;6:482–497. doi: 10.1038/sj.gt.3300867. [DOI] [PubMed] [Google Scholar]
- 20.Zabner J, et al. Cellular and molecular barriers to gene transfer by a cationic lipid. J Biol Chem. 1995;270:18997–19007. doi: 10.1074/jbc.270.32.18997. [DOI] [PubMed] [Google Scholar]
- 21.Dean DA. Import of plasmid DNA into the nucleus is sequence-specific. Exp Cell Res. 1997;230:293–302. doi: 10.1006/excr.1996.3427. [DOI] [PubMed] [Google Scholar]
- 22.Dean DA, Dean BS, Muller S, Smith LC. Sequence requirements for plasmid nuclear entry. Exp Cell Res. 1999;253:713–722. doi: 10.1006/excr.1999.4716. [DOI] [PMC free article] [PubMed] [Google Scholar]
- 23.Zhang G, Song YK, Liu D. Long-term expression of human alpha 1-antitrypsin gene in mouse liver achieved by intravenous administration of plasmid DNA using a hydrodynamics-based procedure. Gene Therapy. 2000;7:1344–1349. doi: 10.1038/sj.gt.3301229. [DOI] [PubMed] [Google Scholar]
- 24.Kobayashi N, et al. Hepatic uptake and gene expression mechanisms following intravenous administration of plasmid DNA by conventional and hydrodynamics-based procedure. J Pharmacol Exp Ther. 2001;297:853–860. [PubMed] [Google Scholar]
- 25.Liu D, Zhang G. Hepatic delivery of nucleic acids using hydrodynamics-based procedure. In: Mahato RI, Kim SW, editors. Pharmaceutical Perspectives of Nucleic Acid-Based Therapeutics. Taylor & Francis Inc.; London and New York: 2002. pp. 455–468. [Google Scholar]
- 26.Budker V, et al. Hypothesis: naked plasmid DNA is taken up by cells in vivo by a receptor-mediated process. J Genet Med. 2000;2:76–88. doi: 10.1002/(SICI)1521-2254(200003/04)2:2<76::AID-JGM97>3.0.CO;2-4. [DOI] [PubMed] [Google Scholar]
- 27.Hofman CR, et al. Efficient in vivo gene transfer by PCR amplified fragment with reduced inflammatory activity. Gene Therapy. 2001;8:71–74. doi: 10.1038/sj.gt.3301373. [DOI] [PubMed] [Google Scholar]
- 28.Zhang G, et al. Efficient expression of naked DNA delivered intraarterially to limb muscles of nonhuman primates. Hum Gene Ther. 2001;12:427–438. doi: 10.1089/10430340150504046. [DOI] [PubMed] [Google Scholar]
- 29.Maruyama H, et al. Kidney-targeted naked DNA transfer by retrograde renal vein injection in rats. Hum Gene Ther. 2002;13:455–468. doi: 10.1089/10430340252792585. [DOI] [PubMed] [Google Scholar]
- 30.Eastman SJ, et al. Development of catheter-based procedures for transducing the rabbit liver with plasmid DNA. Hum Gene Ther. 2002;13:2065–2077. doi: 10.1089/10430340260395910. [DOI] [PubMed] [Google Scholar]
- 31.Wolf P. The radioiodination of RNA and DNA to high specific activities. Methods Cell Biol. 1976;13:121–152. doi: 10.1016/s0091-679x(08)61800-2. [DOI] [PubMed] [Google Scholar]


