Abstract
In multi-cellular organisms, biological function emerges when heterogeneous cell types form complex organs. Nevertheless dissection of tissues into mixtures of cellular subpopulations is currently challenging. We introduce an automated massively parallel single-cell RNA sequencing approach for analyzing in vivo transcriptional states in thousands of single cells. Combined with unsupervised classification algorithms, this facilitates ab initio cell type characterization of splenic tissues. Modeling single-cell transcriptional states in dendritic cells and additional hematopoietic cell types uncovers rich cell-type heterogeneity and gene-modules activity in steady-state and after pathogen activation. Cellular diversity is thereby approached through inference of variable and dynamic pathway activity rather than a fixed pre-programmed cell-type hierarchy. These data demonstrate single-cell RNA-Seq as an effective tool for comprehensive cellular decomposition of complex tissues.
Understanding the heterogeneous and stochastic nature of multi-cellular tissues is currently approached through a priori defined cell-types that are used to dissect cell populations along developmental and functional hierarchies (1–3). This methodology heavily relies on enumeration of cell types and their precise definition, which can be controversial (4–7) and is based in many cases on indirect association of function with cell surface markers (5–8). Perhaps the best understood model for cellular differentiation and diversification is the hematopoietic system. The developmental tree branching from hematopoietic stem cells toward distinct immunological functions was carefully worked out through many years of study, and effective cell surface markers are available to quantify and sort the major hematopoietic cell-types. Even in this well explored system, however, it is becoming increasingly difficult to explain modern genome-wide and in vivo data with refined cell types hierarchy and functions that extend beyond the classical myeloid and lymphoid cell types. For example, dendritic cells (DC) are antigen-presenting cells that were originally characterized through their unique morphology (9), but are now understood to represent a highly heterogeneous group (10) with multiple functions, regulatory circuits and phenotypes (6, 7, 9). Despite considerable efforts and progress using the marker-based approach, much of the known functional heterogeneity within the DC group is not truly compatible with any of the DC sub-classification schemes (6, 7, 11). Such lack of definitive models for cell types and states is common in many fields of biology.
An attractive alternative to marker-based cellular dissection of complex tissues is to characterize in vivo cell type compositions through unsupervised sampling and modeling of transcriptional states in single cells. This natural approach was so far difficult to implement due to many technical limitations that are being progressively alleviated with the advent of single-cell RNA-Seq (12–20). Sampling and sequencing RNA from dozens of single cells was recently used to estimate stochastic transcriptional variation in stationary cultured cells (14) or during a dynamic process (12–14, 16, 19). An unsupervised framework for dissecting transcriptional heterogeneity within complex tissues may therefore be envisioned, provided that many thousands of cells can be assayed routinely using single-cell RNA-Seq and that data from such experiments can be normalized and modeled effectively even when cells represent highly diverse cell types and states.
We developed an automated massively parallel RNA single-cell sequencing framework (MARS-Seq, figures S1 to S6 and Supplementary methods (21)) that is designed for in vivo sampling of thousands of cells by multiplexing RNA sequencing while maintaining tight control over amplification biases and labeling errors. The method is based on FACS sorting of single cells into 384-well plates and subsequent automated processing that is done mostly on pooled and labeled material, leading to a dramatic increase in throughput and reproducibility. To explore the new technique we sequenced RNA from over 4000 mouse spleen single cells (Table S1), focusing initially on a heterogeneous cell population enriched for expression of the CD11c surface marker. We hypothesized that this strategy for cell acquisition will sample a diverse collection of splenic cell types while focusing on the challenging DC populations (6, 7).
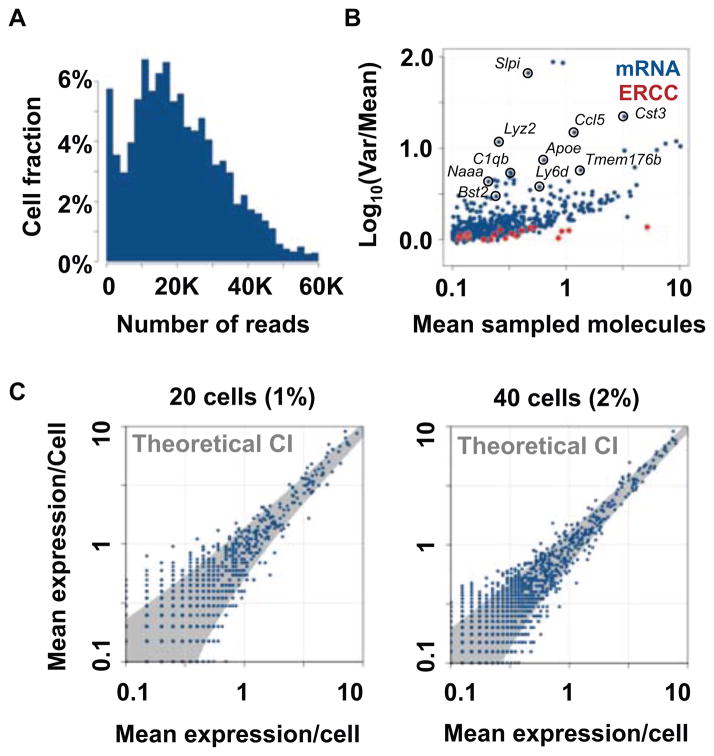
Our methodology employs three levels of barcoding (molecular, cellular, and plate level tags) to facilitate molecule counting with high degree of multiplexing. The strategy is to characterize cell subpopulations by first classifying single cells based on low-depth RNA sampling, and then study transcriptional profiles at high resolution by integrating data from dozens to hundreds of cells within each unsupervised class. As shown in Fig. 1A, multiplexing 1536 cells in one sequencing lane provided an average of 22 thousands aligned reads per cell, and following extensive normalization, these can be used to unambiguously define 200–1500 distinct RNA molecules from each cell. Importantly, our labeling and filtering scheme ensures that spiked-in technical controls show cell-to-cell variance that is compatible with the theoretical (binomial) sampling noise, comparing favorably to previously reported techniques (18) (Fig. 1B). This technical stability significantly increases the information content of the sampled transcriptional states, which can be directly modeled as unbiased samples of the cells’ mRNA pool. Importantly, in contrast to technical spike-in controls or the bulk of detected genes, we observe high cellular variance for a significant number of genes, many of which are well known cell-type specific markers, suggesting this attests for the high degree of heterogeneity within the splenic cell population (Fig. 1B) and promoting the idea of classifying cells into sub-populations based on co-variation of such heterogeneous markers.
Figure 1. Massively parallel single-cell RNA-seq.
(A) Distribution of mapped reads per cell in a multiplexed 1536 cell experiment. (B) Mean and variance in mRNA (blue) and spike-in controls (red). (C) Mean mRNA counts in replicated pooled population of homogeneous (FACS sorted) pDC.
To test how sensitive our strategy can be for characterizing the transcriptional state of subpopulations in the sample, we estimated coverage and mean mRNA molecule count reproducibility for groups of 10–40 single-cell profiles, representing 0.6%–3% of the cells on one sequencing lane. Analysis of single-cell mRNA profiles from FACS-sorted plasmacytoid DC (pDC) (Fig. 1C, Fig. S6) confirmed that pooling of homogeneous cell populations provides rich and highly reproducible transcriptional profiles. For a sub-population at a frequency of 2.5%, the assay report on 1255 genes with a standard deviation of less than 35% of the mean, and on 324 genes with a standard deviation of 20% of the mean. Together, the availability of high variance marker genes, and the dynamic range provided by pooled single-cell transcriptional profiles enable unsupervised dissection and characterization of heterogeneous cell populations, opening the way for ab initio cell type decomposition of splenic populations at a high level of details.
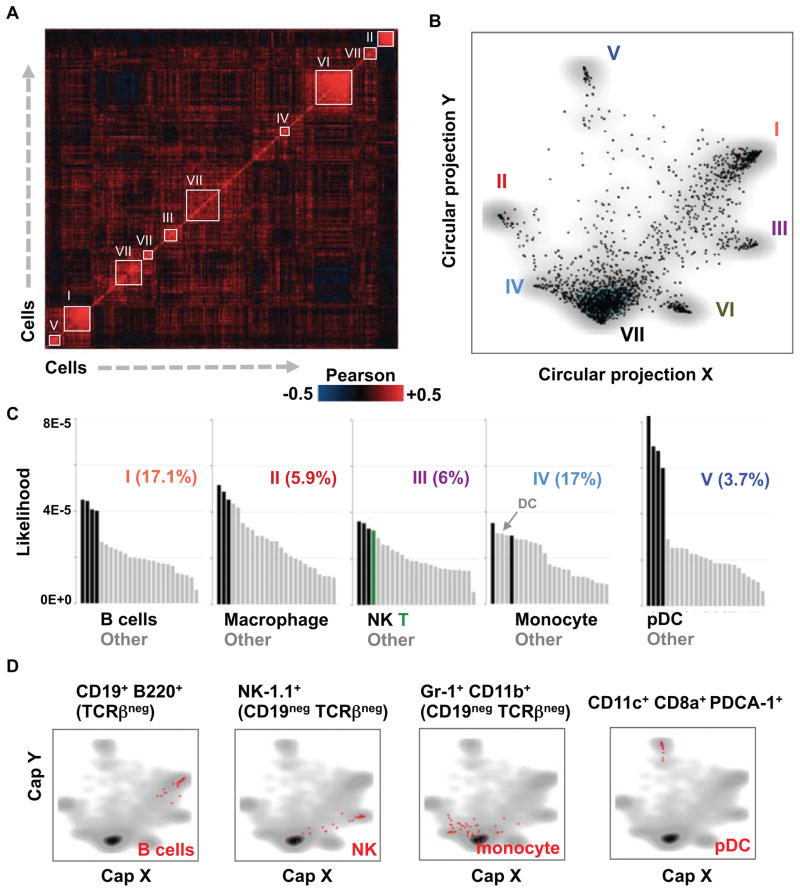
We have implemented a probabilistic strategy for unsupervised classification of cells into “idealized types”. Hierarchical clustering (Fig. 2A) defined seeds of highly correlated cells, leading to the initialization of a probabilistic mixture model and classification of single cells into types or families of homogeneous states. Visualization of the multi-class data using a new circular a posteriori projection technique (Fig. 2B) represented the splenic cell population as a combination of several molecular behaviors, five of which (class I–V) being distinctively separated from a group of more loosely defined classes (class VI–VII). The frequencies of class I–V range between 3.7–17%, allowing in all cases to infer rich transcriptional states by in silico pooling of single-cell mRNA profiles within each class. Analysis of gene enrichment (Table S2, figs. S7 and S8), and comparison of these profiles with existing transcriptional profiles of classical hematopoietic populations (immgen.org), unambiguously linked class I–V to B cells, NK cells, macrophages (MF), monocytes (Mo) and pDC (Fig. 2C). The remaining classes were all linked to DC. Direct FACS gating and counting using classical surface markers confirmed our in silico estimations of the frequency of B cells and pDC within the CD11c-enriched splenic cell population (fig. S9). Further analysis and additional single-cell qPCR experiments confirmed that “marker” genes are robustly enriched in their relevant subpopulations (figs. S10 and S11). Using classical marker-based sorting we further validated our approach with additional single-cell RNA-Seq data from FACS-sorted B cells, NK cells, pDC and monocytes. Projection of the new data onto the model we generated from the splenic population showed remarkable compatibility between the traditional marker-based cell-type definition and the marker-free single-cell RNA-Seq technique (Fig. 2D). Analysis of splenic cell populations therefore showcased single-cell RNA-Seq as a direct and unsupervised way for identifying and characterizing sub-populations within heterogeneous tissues.
Figure 2. Single-cell dissection of immune cell types.
(A) Color-coded correlation matrix of single-cell mRNA profiles. Groups of strongly correlated cells that are used to initialize a probabilistic mixture model are numbered and marked with white frames. (B) Circular a-posteriori projection (CAP) plot summarizing the predictions of the probabilistic mixture model for the CD11c+ cells. Each cell is projected onto the two dimensional sphere based on the posterior probability of its association with the model’s classes. The dimensions of the CAP plot should not be interpreted linearly or as principle components. (C) Bar plots depicting correlations of mean RNA counts in inferred types and Immgen expression profiles. The most correlated group of Immgen profiles is colored specifically as indicated for each type. (D) Shown are CAP-plots depicting single-cell RNA-Seq datasets acquired from marker-based FACS sorting for single pDC, B cells, NK cells and monocytes. Sorted cells are shown in red; density of the CD11c+ pool is shown in gray.
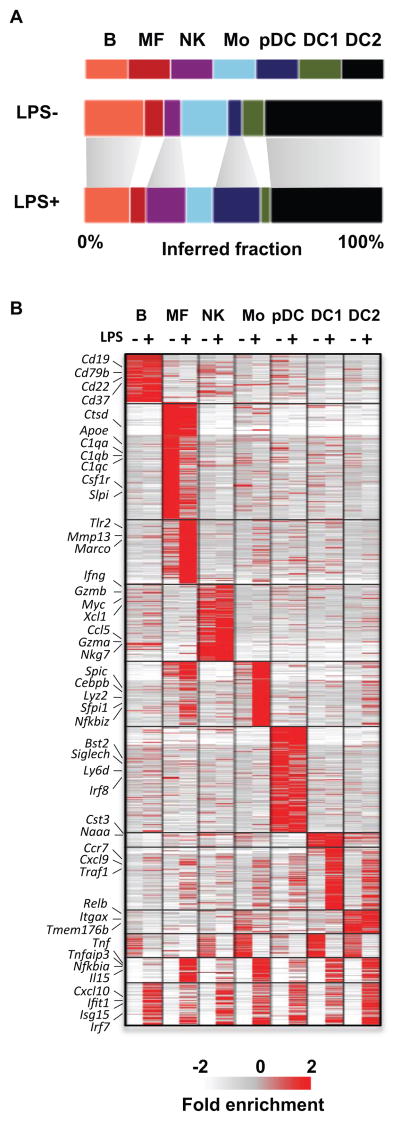
We profiled additional 1536 single cells from spleens that were exposed to LPS for 2 hours (22), aiming to test how an immediate response to a stimulus mimicking infection can be deciphered across the heterogeneous splenic cell population. We found that the LPS-treated cells are broadly classified into similar cell types to those observed in untreated cells, with some changes in the relative representation of different types (Fig. 3A). Using the non-LPS mixture model we classified the non-LPS and LPS exposed cells into classes, and inferred a rich transcriptional profile within each class before and after treatment. Clustering 1575 variable genes, identified groups of cell type-specific response genes (e.g. Tnf and Marco in macrophages, Xcl1 and Gzmb in NK cells), and a large group of type I interferon response genes (Irf7, Stat2, Ifit1, Cxcl10 and hundreds more) activated pervasively in all or almost all cell types (Fig. 3B, fig. S12, Table S3–4).
Figure 3. Response to LPS across multiple cell types.
(A) Inferred cell type frequencies before and after LPS treatment. (B) Clustering of over 1300 genes give mean inferred transcriptional mean in each cell type before and after LPS infection (−/+). Full gene list is provided in Table S4.
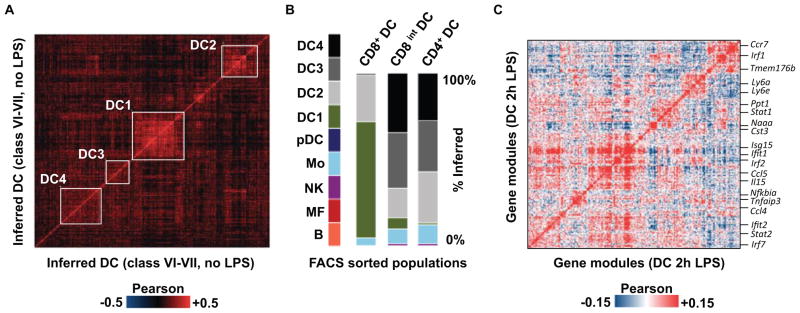
With thousands of samples readily available, single-cell RNA-Seq is poised to go beyond the classical cell types hierarchies that are outlined by current marker-based approaches, examining complex relations between cell subpopulations or continuous spectra of types. Analysis of 1031 single cells that were associated with DC-related classes (VI–VII) in our unsupervised CD11c+ model (Fig. 4A) indicated that while 15% of these cells (class DC1) are strongly linked together, the remaining bulk of DC could not be organized along a clear clustering hierarchy (11). Nevertheless, we found strong support for significant internal organization within the remaining DC population (DC2-4, Table S5), including a group of cells co-expressing Relb, Nfkbia and additional associated genes (DC2) (fig. S13). More generally, we have identified several gene modules that represent combinatorial pathway activity within the DC bulk (fig. S14), indicating that despite the lack of a clear hierarchy, the DC cell population is governed by a high degree of transcriptional organization. Additional single-cell sequencing of CD8+ CD86+, CD8int CD86− and CD4+ FACS sorted populations (Fig. 4B) showed that this organization can be approached to a limited extent with existing marker-based classification. Remarkably, exposure to LPS reorganizes the DC population significantly, with a large number of gene modules being activated in a highly heterogeneous fashion (Fig. 4C and fig. S15). According to our analysis, certain specific CD4+ DC subpopulations are activating the Irf4, TNF and TGFb pathways (fig. S16, Table S6), while other pathways (e.g. Irf7) are activated pervasively (table S5). This combinatorial activity of pathways within the LPS exposed DC pool is not represented in pre-existing DC subtypes according to our data. In summary, committed and developmentally stable myeloid and lymphoid cell types maintain their identity during immediate response to infection while responding through generic and cell type specific pathways. These pathways create significant cell-to-cell variance and define new cell sub-populations within each of these cell types (fig. S17), forming diversity that may have functional implications. Observation of transcriptional subpopulations, however, does not necessarily imply the existence of further committed and pre-programmed cell sub-type hierarchy.
Figure 4. Gene modules and the distribution and redistribution of DC cell states.

(A) Single-cell correlation matrix for cells classified as DC, showing detected subclasses using white frames. (B) Type/class distributions of single-cell RNA-Seq data from three different FACS sorted DC (CD11c enriched) populations: CD8a+ CD86+; CD8a intermediate (int) CD86 negative; CD8a negative CD4+ ESAM+ (fig. S13A). (C) Gene correlation matrix is depicting potential LPS-dependent interactions between 225 genes. Key genes are indicated, with the complete list available in fig. S15.
We presented a new framework for broad sampling of single-cell transcriptional states from tissues and demonstrated how it can be used to dissect complex functions in a bottom-up fashion. MARS-Seq can be readily applied to tissues and organs in normal and disease states to redefine their cell type and cell state compositions and link it to detailed genome-wide transcriptional profiling. Given the inherent stochasticity and heterogeneity of multi-cellular tissues, this approach can prove essential for understanding how in vivo biological function emerges from complex cell ensembles.
Supplementary Material
Acknowledgments
Research was supported by ERC and ISF (1782/11, 1050/12) grants to IA and AT.
Footnotes
Data accession numbers: RNA-seq data is deposited in GEO, GSE54006.
References and Notes
- 1.Acar M, Mettetal JT, van Oudenaarden A. Nat Genet. 2008;40:471–475. doi: 10.1038/ng.110. [DOI] [PubMed] [Google Scholar]
- 2.Elowitz MB, Levine AJ, Siggia ED, Swain PS. Science. 2002;297:1183–1186. doi: 10.1126/science.1070919. [DOI] [PubMed] [Google Scholar]
- 3.Germain RN. Nat Immunol. 2012;13:902–906. doi: 10.1038/ni.2404. [DOI] [PMC free article] [PubMed] [Google Scholar]
- 4.Bendall SC, et al. Science. 2011;332:687–696. doi: 10.1126/science.1198704. [DOI] [PMC free article] [PubMed] [Google Scholar]
- 5.Bradford BM, Sester DP, Hume DA, Mabbott NA. Immunobiology. 2011;216:1228–1237. doi: 10.1016/j.imbio.2011.08.006. [DOI] [PubMed] [Google Scholar]
- 6.Geissmann F, Gordon S, Hume DA, Mowat AM, Randolph GJ. Nat Rev Immunol. 2010;10:453–460. doi: 10.1038/nri2784. [DOI] [PMC free article] [PubMed] [Google Scholar]
- 7.Hume DA. J Leukoc Biol. 2011;89:525–538. doi: 10.1189/jlb.0810472. [DOI] [PubMed] [Google Scholar]
- 8.Nussenzweig MC, Steinman RM, Witmer MD, Gutchinov B. Proc Natl Acad Sci U S A. 1982;79:161–165. doi: 10.1073/pnas.79.1.161. [DOI] [PMC free article] [PubMed] [Google Scholar]
- 9.Steinman RM, Cohn ZA. J Exp Med. 1973;137:1142–1162. doi: 10.1084/jem.137.5.1142. [DOI] [PMC free article] [PubMed] [Google Scholar]
- 10.Bar-On L, et al. Proc Natl Acad Sci U S A. 2010;107:14745–14750. doi: 10.1073/pnas.1001562107. [DOI] [PMC free article] [PubMed] [Google Scholar]
- 11.Hashimoto D, Miller J, Merad M. Immunity. 2011;35:323–335. doi: 10.1016/j.immuni.2011.09.007. [DOI] [PMC free article] [PubMed] [Google Scholar]
- 12.Hashimshony T, Wagner F, Sher N, Yanai I. Cell Rep. 2012;2:666–673. doi: 10.1016/j.celrep.2012.08.003. [DOI] [PubMed] [Google Scholar]
- 13.Islam S, et al. Nat Protoc. 2012;7:813–828. doi: 10.1038/nprot.2012.022. [DOI] [PubMed] [Google Scholar]
- 14.Ramskold D, et al. Nat Biotechnol. 2012;30:777–782. doi: 10.1038/nbt.2282. [DOI] [PMC free article] [PubMed] [Google Scholar]
- 15.Sasagawa Y, et al. Genome Biol. 2013;14:R31. doi: 10.1186/gb-2013-14-4-r31. [DOI] [PMC free article] [PubMed] [Google Scholar]
- 16.Shalek AK, et al. Nature. 2013;498:236–240. doi: 10.1038/nature12172. [DOI] [PMC free article] [PubMed] [Google Scholar]
- 17.Tang F, Lao K, Surani MA. Nat Methods. 2011;8:S6–11. doi: 10.1038/nmeth.1557. [DOI] [PMC free article] [PubMed] [Google Scholar]
- 18.Wu AR, et al. Nat Methods. 2014;11:41–46. doi: 10.1038/nmeth.2694. [DOI] [PMC free article] [PubMed] [Google Scholar]
- 19.Deng Q, Ramskold D, Reinius B, Sandberg R. Science. 2014;343:193–196. doi: 10.1126/science.1245316. [DOI] [PubMed] [Google Scholar]
- 20.Islam S, et al. Nat Methods. 2013 [Google Scholar]
- 21.See supplementary materials on Science Online.
- 22.Amit I, et al. Science. 2009;326:257–263. doi: 10.1126/science.1179050. [DOI] [PMC free article] [PubMed] [Google Scholar]
Associated Data
This section collects any data citations, data availability statements, or supplementary materials included in this article.


