

Scientific Abstract
Adults with autism spectrum disorder (ASD) face substantial challenges accomplishing basic tasks associated with daily living, which are exacerbated by their broad and pervasive difficulties with social interactions. These challenges put people with ASD at increased risk for psychophysiological distress, which likely factors heavily into social functioning for adults with ASD, as suggested by a growing literature on stress in children that indicates that children with ASD have differential responses to stress than healthy children. We hypothesized that adults with ASD and without intellectual disability (n=38) would experience more stress than healthy volunteers (n=37) and that there would be an inverse relationship between stress and social functioning in individuals with ASD. Baseline, semi-structured interview data from a randomized-controlled trial of two treatments for adults with ASD were used to assess differences in stress between adults with ASD and healthy volunteers and to assess the relationship between stress response and social functioning in adults with ASD. Findings indicate that adults with ASD experience greater perceived and interviewer-observed stress than did healthy volunteers and that stress is significantly related to social functioning in adults with ASD. These findings highlight the role of stress in adult functioning and outcomes and suggest the need to develop and assess treatments designed to target stress and coping in adults with ASD.
Keywords: Emotion regulation, coping, anxiety, adult outcome, pervasive developmental disorder
Introduction
An estimated 50,000 children with autism spectrum disorder (ASD) will turn 18 this year alone (Shattuck, Narendorf, et al., 2012; Shattuck, Roux, Hudson, Taylor, et al., 2012), and the number of adults with ASD will increase rapidly in the coming years (Gerhardt & Lainer, 2011; Shattuck, Narendorf, et al., 2012). However, poor outcomes in terms of education, employment, and the development of social relationships are quite common for this group (Levy & Perry, 2011; Seltzer, Shattuck, Abbeduto, & Greenberg, 2004; Shattuck, Narendorf, et al., 2012), and there is little understanding of discrete reasons for these poor outcomes. The impact of poor outcomes for adults with ASD over the life course combines with the growing population of individuals with ASD (Centers for Disease Control and Prevention, 2012; Shattuck, Roux, Hudson, Taylor, et al., 2012) to make it imperative to understand the behavioral underpinnings of poor adult outcomes.
Effectively addressing the substantial and varied needs of the growing number of adults with ASD is thus one of the greatest challenges currently faced by both service providers and the ASD research community. Despite work that has examined the myriad of challenges and problems faced by children with ASD and has led to the development of an array of effective treatments that have helped children with ASD substantially (Cohen, 1980; Odom, Boyd, Hall, & Hume, 2010; Odom, Collet-Klingenberg, Rogers, & Hatton, 2010; Ruble, Heflinger, Renfrew, & Saunders, 2005), there remains a paucity of research that focuses on the specific needs of adults with ASD (Bishop-Fitzpatrick, Minshew, & Eack, 2013; Gerhardt & Lainer, 2011; Levy & Perry, 2011; Shattuck, Roux, Hudson, Taylor, et al., 2012). Most notably, we know very little about why between 50% and 75% of adults with ASD, including those who are more cognitively able, function poorly in terms of achieving some form of formal education, maintaining employment, living independently, and sustaining social relationships (Eaves & Ho, 1996; Howlin, Goode, Hutton, & Rutter, 2004; Levy & Perry, 2011; Shattuck, Narendorf, et al., 2012). We know even less about how to improve these outcomes through some combination of treatments and services designed to target the specific needs of this population.
Adults with ASD face many substantial challenges accomplishing basic tasks associated with daily living (Shattuck, Roux, Hudson, Lounds Taylor, et al., 2012; Smith, Maenner, & Seltzer, 2012; Taylor & Seltzer, 2011) which are further exacerbated by their broad and pervasive difficulties with social interactions (Gillespie-Lynch et al., 2012; Klin et al., 2007; Wing & Gould, 1979). These challenges, coupled with biobehavioral vulnerabilities inherent to ASD (Klin et al., 2007; Stanfield et al., 2008; Wing & Gould, 1979), put people with these conditions at increased risk for psychosocial distress (Corbett, Mendoza, Abdullah, Wegelin, & Levine, 2006; Corbett, Mendoza, Wegelin, Carmean, & Levine, 2008; Corbett, Schupp, Levine, & Mendoza, 2009; Jansen, Gispen-de Wied, van der Gaag, & van Engeland, 2003; Lanni, Schupp, Simon, & Corbett, 2012; Levine et al., 2011; Spratt et al., 2011). Stress, and more specifically the way that one responds to and copes with stress, is essential to adjustment in adulthood (Cohen, Kamarck, & Mermelstein, 1983; Cohen & Williamson, 1988; Selye, 1956; Williams, 2008) and likely factors heavily into both daily life and long-term outcomes for adults with ASD, as suggested by a growing literature on stress in children with ASD that indicates that children with ASD have differential biobehavioral responses to physiological arousal than children without an ASD diagnosis (Corbett et al., 2006; Corbett et al., 2008; Corbett et al., 2009; Lanni et al., 2012; Levine et al., 2011; Spratt et al., 2011). In order to design interventions that might help adults with ASD better manage stress and, as a result, function better in adulthood, we must first understand how adults with ASD perceive and respond to stress and how stress factors into adult outcomes for individuals with ASD.
A small but growing area of research describes the biological bases behind physiological arousal to stress in children with ASD. Specifically, two recent studies (Levine et al., 2011; Spratt et al., 2011) have examined the relationship between cortisol levels and stress in children with ASD. Levine and colleagues (2011) found that children with high functioning autism are more likely than non-affected children to have a decrease in salivary cortisol levels following a social stress simulation, representing decreased levels of stress in contrast to control participants. Spratt and colleagues (2011) found that a sample of children with ASD had significantly higher peak cortisol levels, a prolonged duration of peak cortisol levels, and a slower recovery from cortisol elevation than a sample of non-affected children. These results are mixed yet suggest that children with ASD may have different reactivity to stress and novel stimuli compared with non-affected children and may indicate a mechanism by which children with ASD are differentially able to adapt to novel social situations.
The literature on stress and coping in individuals with ASD indicates that children with ASD respond differently to stress than children without ASD and that children with ASD may have either more or less extreme psychophysiological reactions to stress. While the literature on stress in individuals with ASD focuses solely on children (Levine et al., 2011; Spratt et al., 2011), it is likely that adults with ASD also experience differential psychosocial distress and biological stress in social situations. However, no research indicates whether or not this is the case, and no research associates stress response with social functioning.
This paper seeks to address this gap in the literature by examining the relationship between both perceived- and interviewer-observed stress and social functioning in adults with ASD, compared to healthy volunteers. We hypothesized that adults with ASD would experience more perceived and interviewer-observed stress than healthy volunteers. Additionally, we hypothesized that there would be an inverse relationship between stress and social functioning such that higher perceived- and interview-observed stress predicts poorer social functioning in adults with ASD.
Methods
Procedures
Participants were recruited from local colleges and universities, support groups, previous research studies, and local advocacy groups. Recruited participants were assessed for diagnostic and IQ eligibility by trained research staff from the University of Pittsburgh Autism Center for Excellence and the University of Pittsburgh PERSPECTIVES program who have extensive experience with adults with ASD. Staff were supervised by a study psychologist. Eligibility determinations were made in consensus meetings based on review of all available diagnostic, testing, and interview data. Eligible participants were then assigned to 18 months of active treatment with either Cognitive Enhancement Therapy (CET) and Enriched Supportive Therapy (EST). The data utilized in this study was collected prior to beginning treatment, during the second visit to our study clinic after study eligibility was assessed. Master's- and doctoral-level study clinicians completed video-taped structured interviews with the participants and used data from these interviews and their observations to complete the rating scales used for this study. The study was approved by the University of Pittsburgh Institutional Review Board.
Participants
Participants included 38 adults with ASD who were participants in a randomized-controlled clinical trial of CET and EST and 37 healthy volunteers. Eligibility criteria for adults with ASD included meeting expert clinical opinion and research criteria for ASD using the Autism Diagnostic Observation Schedule (Lord et al., 2000), age 16-45 (although all of our participants were aged 18 or older), intelligence quotient (IQ) ≥ 80 as assessed by the Wechsler Abbreviated Scale of Intelligence (Wechsler, 2008), not abusing substances in the 3 months prior to enrollment, not exhibiting substantial and negatively impactful behaviors (e.g., behaviors that might prevent an adult with ASD from being able to participate in a structured treatment program), and the presence of significant cognitive and social disability that would warrant treatment as assessed by the Cognitive Styles and Social Cognition Eligibility Interview (Hogarty, Flesher, Ulrich, & et al., 2004).
Participants who served as healthy volunteers had similar, but not identical, inclusion criteria. They were between the ages of 18 and 55 and had no current psychiatric disability, as confirmed through the Structured Clinical Interview for the DSM-IV (First, Spitzer, Gibbon, & Williams, 2002). These participants were recruited through advertisements and signs posted around the University of Pittsburgh campus and within the community.
Participants in the ASD group had either an autism (n = 19) or autism spectrum disorder (n = 19) diagnosis and were, on average, 23.13 (SD = 5.50) years old and had a full-scale IQ of 109.45 (SD = 15.18). Overall, 84.21% (n = 32) of participants with ASD were male and 78.95% (n = 30) were white (n = 30). Participants with ASD had generally poor functional outcomes as 76.32% (n = 29) did not graduate from college, 63.12% (n = 24) were unemployed, and 78.65% (n = 30) were not living independently. Descriptive statistics are detailed in Table 1.
Table 1. Demographic Characteristics of Participants.
| Variable | ASD Group (n = 38) | Control Group (n = 37) | p-value |
|---|---|---|---|
| Age, mean(SD) | 23.13(5.50) | 26.32(5.48) | .001 |
| Full-Scale IQ, mean(SD) | 109.42 (15.18) | 105.27(9.62) | .163 |
| Male, number(%) | 32(84.21) | 27(72.97) | .183 |
| White, number(%) | 30(78.95) | 31(83.78) | .405 |
| College Graduate, number(%) | 9(23.68) | 29(78.38) | .001 |
| Employed, number(%) | 14(36.84) | 20(54.05) | .103 |
| Living Independently, number(%) | 8(21.05) | -- | -- |
| Autism Spectrum Disorder Diagnosis, number(%) | 19(50.00) | -- | |
| Autism Diagnosis, number(%) | 19(50.00) | -- | -- |
Participants who served as healthy volunteers were, on average, 26.32 (SD = 5.48) years old and had a full-scale IQ of 105.27 (SD = 9.62). Overall, 72.97% (n = 27) were male and 83.78% (n = 31) were white. Participants who served as healthy volunteers functioned somewhat better than participants with ASD as 78.38% (n = 29) graduated from college and 54.05% (n = 20) were employed. Independent living was not reported for participants who served as healthy volunteers because it was deemed during data collection to be a factor of clinical interest only to participants with ASD. Descriptive statistics are detailed in Table 1.
Measures
Stress
Degree of stress was quantified based on a composite of two subscales that measure perceived anxiety and tension on the Brief Psychiatric Rating Scale (BPRS; Overall & Gorham, 1962), a structured clinical interview administered by trained clinical raters and embedded within a broader clinical interview. The BPRS was developed as an efficient tool to evaluate current psychiatric symptoms (Overall & Gorham, 1962) and has been widely used in psychiatric research (Hatton et al., 2005) to assess overall symptom levels in patients with psychiatric disabilities (e.g., Leucht et al., 2005; Morlan & Tan, 1998; Overall & Beller, 1984), neurological disorders (Lotan, Fireman, Weizman, & Steiner, 2014), and developmental disabilities, including autism (Boso, Emanuele, Minazzi, Abbamonte, & Politi, 2007; Siegel & Gabriels, 2014). It has been recently used in adult autism research to assess functioning in terms of psychomotor agitation, aberrant behavior, and lack of interaction with peers and therapists in young adults with severe autism (Boso et al., 2007). The BPRS has acceptable psychometric properties, with good inter-rater reliability (r = .56 to r = .87), good internal consistency (α = .70 to α = .89), and sufficient test-retest reliability (r = .40 to r = .72) across a number of studies (e.g., Hafkenscheid, 1993; Hedlund & Vieweg, 1980; Overall & Beller, 1984; Overall & Gorham, 1962). Consistent with the use of select BPRS subscales to measure symptoms in adults with ASD (Boso et al., 2007), two subscales were used in this research. The subscales that were utilized in this research assessed “worry, fear, over-concern for present or future, uneasiness,” and “physical and motor manifestations of nervousness, over-agitation.” Characterization of observed stress (tension) was based on the clinical rater's impression of physical and motor manifestations of stress and tension, not including manifestations of stereotyped or repetitive behavior. These two subscales were included in this research because they conceptually relate to perceived stress and interviewer-observed stress, respectively. For each domain, scores ranged from 0 to 7, where 0 = not assessed, 1 = not present, 2 = very mild, 3 = mild, 4 = moderate, 5 = moderately severe, 6 = severe, 7 = extremely severe. A composite “stress” score was created by taking the mean of these two scores for each participant.
Social functioning
Social functioning is conceptualized in this research as a composite of global functioning and social disability. Global functioning and social disability were measured independently, and a z-metric composite score for social functioning was created.
Global functioning is conceptualized in this research as a continuum of functioning and considers psychological, social, and occupational functioning. Global functioning was measured with the Global Assessment Scale (GAS; Endicott, Spitzer, Fleiss, & Cohen, 1976), a rating scale with structured anchors used to evaluate overall functioning during a specified time period. Scores range from 1, which represents poor global functioning, to 100, which represents the excellent global functioning. For instance, scores from 91 to 100 represent “superior functioning in a wide range of activities, life's problems never seem to get out of hand, is sought out by others because of his or her positive qualities” while scores from 1 to 10 represent “persistent danger or severely hurting self or others…OR persistent inability to maintain minimal personal hygiene OR serious suicidal act with clear expectation of death.” Current GAS scores were determined by trained clinical raters at the end of a broader structured clinical interview.
Social disability was conceptualized as deficiencies in the quality and/or quantity of an individual's interpersonal relations, relationships with family members, and participation in social activities (Schooler, Weissman, & Hogarty, 1979). It was assessed using the Social Adjustment Scale-II (SAS-II; Schooler et al., 1979), a structured interview-based measure that assesses social disability, and relative level of social functioning, in the domains of work, household life, family life outside of the household, social leisure, and personal well-being. The SAS-II contains 45 items covering the aforementioned domains. Scores on individual items range from 0 to 4, with higher scores representing more social disability. Five global ratings are also provided in the domains of work, household life, family life outside of the household, social leisure, and general social adjustment, based on scores across the entire interview. Scores on global composites range from 0 to 6, with higher scores representing more social disability. The SAS-II has adequate internal consistency (α = .92 to .99) in psychiatric populations (Bellack, Morrison, Mueser, Wade, & Sayers, 1990; Davies, Bromet, Schulz, & Dunn, 1989; Glazer, Aaronson, Prusoff, & Williams, 1980; Schooler et al., 1979).
Analyses
Preliminary Analyses
Prior to investigating the primary analytic aims of this research, preliminary analyses were conducted to check assumptions associated with the statistical tests linked to each study hypothesis and to inform the primary analyses about the potential effects of demographic heterogeneity. First, the distribution of continuous variables was examined in order to ensure that all measures met the assumptions of parametric testing. These analyses were conducted by calculating skewness statistics in order to assess skewed data distributions, and visually inspecting histograms of data distributions in order to identify other non-normal (e.g., bimodal, uniform, exponential) distributions. Skewness statistics greater than 1.00 were considered to be indicative of moderately skewed distributions (Mardia, 1970) and were accordingly transformed using non-linear transformations in order to meet the assumptions of parametric testing. Second, the effects of study group (i.e., ASD or healthy volunteer) differences in demographics were examined. Any salient demographic variables for which there were differences between the ASD and control groups at the p < .05 level were determined before conducting analyses and included as covariates. These group differences were assessed using a t-test for age and IQ and a chi-square test for race, gender, employment, and education.
Analyses of study hypotheses
Data were used to assess differences in stress between adults with ASD and healthy volunteers (Hypothesis #1) using ANCOVA procedures and adjusting for salient demographic factors. In addition to the assumptions (e.g., normality, outliers) addressed in the preliminary analyses (see above), homogeneity of variance was assessed using the Brown-Forsythe test of homogeneity of variance (Brown & Forsythe, 1974) and homoscedasticity was assessed using the Breusch-Pagan test of homoscedasticity (Breusch & Pagan, 1979). Correction for multiple inference testing was not conducted due to the presence of only two study groups (Benjamini & Hochberg, 1995).
The relationship between stress response and social functioning in adults with ASD (Hypothesis #2) was examined using hierarchical multiple linear regression predicting social functioning from stress response, first for the whole sample and then for the ASD and control groups separately. For this hierarchical linear regression, salient covariates (e.g., age, race) were entered into the model in the first step in order to account for shared variance, and then the main independent variable (stress response) was entered into the model in the second step. Next, in order to test the combined impact of study group and stress on the prediction of social functioning, an interaction between study group (i.e., ASD versus control) and stress was tested for components of social functioning (i.e., global functioning and social disability) for which there was a significant prediction of social functioning by stress. Study group was indicator coded (Hardy, 1993), and stress was centered for the purpose of the interaction analysis in order to reduce the risk of multicollinearity (Marquardt, 1980). In addition to the assumptions (e.g., normality, outliers) addressed in the preliminary analyses, homogeneity of variance was assessed using the Brown-Forsythe test of homogeneity of variance (Brown & Forsythe, 1974), homoscedasticity was assessed using the Breusch-Pagan test of homoscedasticity (Breusch & Pagan, 1979), and independence of errors was assessed using the Durbin-Watson statistic (Durbin & Watson, 1950).
Results
Preliminary Analyses
After checking for normality, it was determined that age was skewed (skewness statistic = 1.71) and was thus transformed using the Box-Cox method with lambda set at -1.00 (Box & Cox, 1964). This transformation resulted in a skewness statistic for the transformed variable of -.051, which was determined to be adequate. Results of diagnostic testing related to ANCOVA and regression assumptions indicated that all other assumptions were met and that parametric tests were thus appropriate.
Differences between the ASD and control groups in the demographic factors of age, IQ, race, gender, education, and employment were examined to assess for group differences using a t-test for continuous variables (age and IQ) and a chi-square test for categorical variables (race, gender, education, employment). While there were no statistically significant differences between the ASD and control groups in race, gender, employment, or IQ, there were statistically significant differences between groups in age and education such that participants with ASD were younger than healthy volunteers, t(73) = 2.738, p = .008, and fewer participants with ASD than healthy volunteers graduated from college, χ2(1, N=75) = 22.436, p< .001. Therefore, age and education were included as covariates in subsequent analyses.
Group Differences in Stress (Hypothesis #1)
As expected, results of the ANCOVA models (Figure 1) indicated that adults with ASD experienced greater overall (composite) stress (M = 3.20, SD = 1.42) compared to healthy volunteers (M = 1.56, SD = .61), F(1,71) = 38.347, p < .001. Results indicated that adults with ASD also experienced greater perceived stress (M = 3.63, SD = 1.72) compared to healthy volunteers (M = 1.73, SD = .90), F(1,71) = 32.074, p < .001, and greater observed stress (M = 2.76, SD = 1.50) compared to healthy volunteers (M = 1.41, SD = .60), F(1,71) = 16.793, p < .001.
Figure 1.
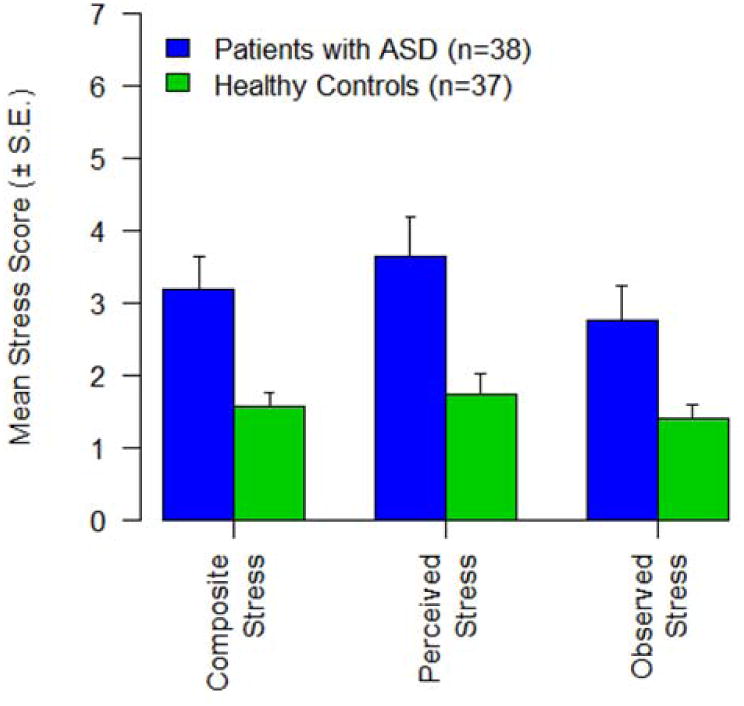
Stress in patients with ASD and Healthy Volunteers.
The Relationship between Stress and Social Functioning (Hypothesis #2)
To investigate how well stress predicted overall (composite) social functioning, global functioning, and social disability when controlling for age and education, a hierarchical multiple linear regression was performed for both groups together, for the ASD group, and for the control group. Results are presented in Table 2 and in Figure 2 (social functioning composite), Figure 3 (global functioning/GAS), and Figure 4 (social disability/SAS-II).
Figure 2.
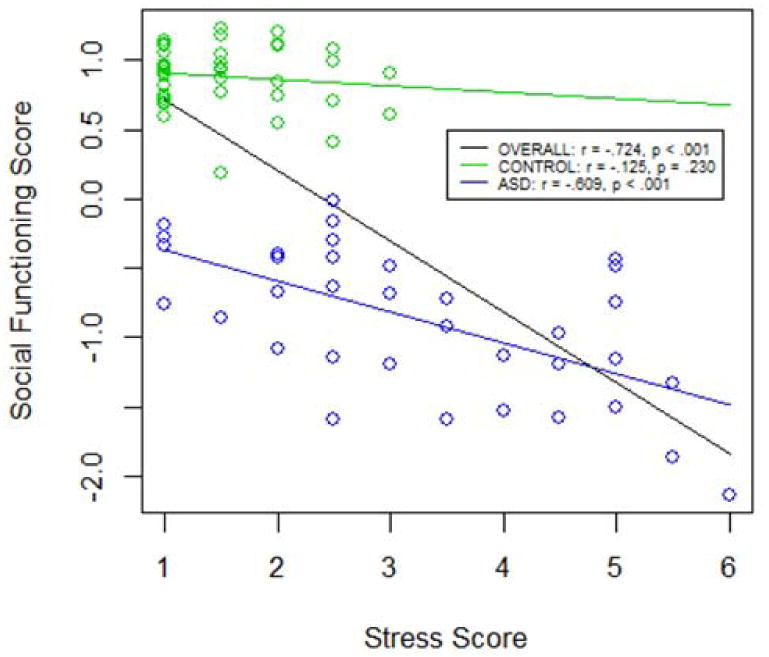
The Relationship between Stress and the Social Functioning Composite Score in Patients with ASD (n=38) and Healthy Volunteers (n=37).
Figure 3.
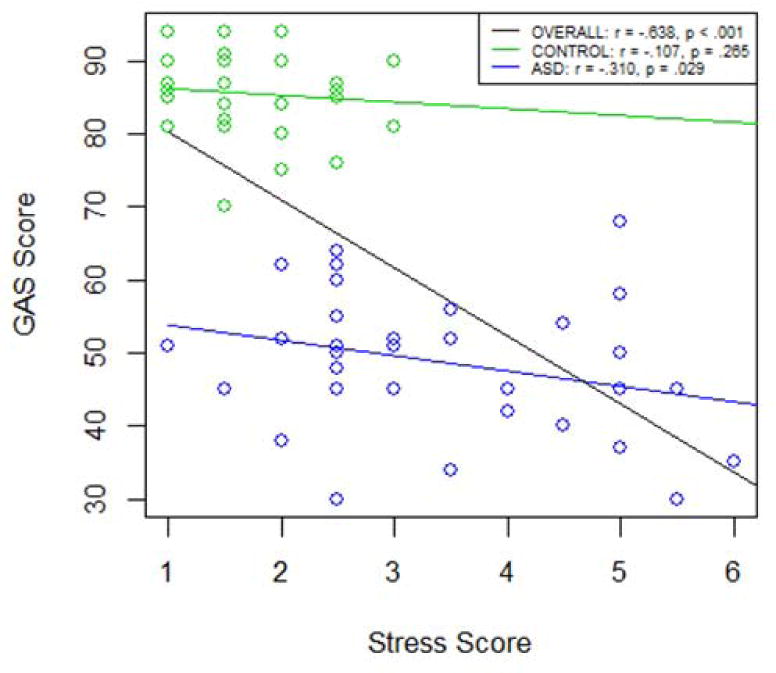
The Relationship between Stress and Global Functioning in Patients with ASD (n=38) and Healthy Volunteers (n=37).
Figure 4.
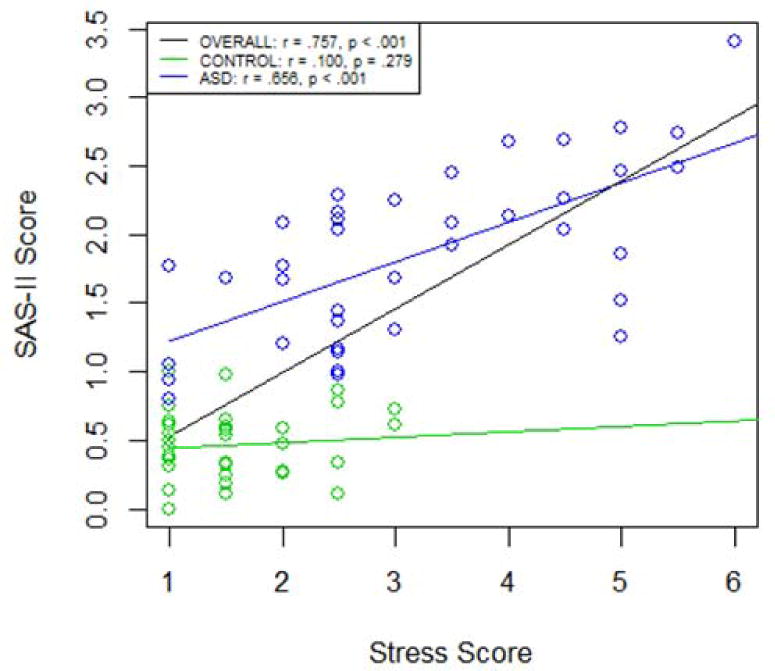
The Relationship between Stress and the Social Disability in Patients with ASD (n=38) and Healthy Volunteers (n=37).
Overall, for both adults with ASD and healthy volunteers, when age and education were entered into the model, they significantly predicted overall (composite) social functioning, F(2,72) = 12.34, p < .001, global functioning, F(2,72)= 16.10, p < .001, and social disability, F(2,72) = 8.13, p = .001. When overall (composite) stress was entered into the model, it significantly improved the prediction of overall (composite) social functioning, R2 change = .36, F(1,71)= 65.34, p < .001, global functioning, R2 change = .24, F(1,71) = 38.57, p < .001, and social disability, R2 change = .43, F(1,71) = 80.10, p < .001. The entire group of independent variables significantly predicted overall (composite) social functioning, F(3,71) = 37.36, p < .001, adjusted R2 = .60, global functioning, F(3,71) = 29.18, p < .001, adjusted R2 = .53, and social disability, F(3,71) = 38.08, p < .001, adjusted R2 = .60, all large effects according to Cohen (1988, 1992). As expected, the regression weights, presented in Table 2, suggest that overall (composite) stress contributed significantly and to the greatest degree to the prediction of overall (composite) social functioning, B = -.44, t(71) = -8.08, p < .001, sr2 = .36, global functioning, B = -7.58, t(71) = -6.21, p < .001, sr2 = .24, and social disability, B = .43, t(71) = 8.95, p < .001, sr2 = .43.
Table 2. Hierarchical Multiple Regression Analysis Summary for Stress, Age, and Education, Predicting Social Functioning Measures, for ASD (n=38) and Control Groups (n=37).
| Whole Sample | ASD Group | Control Group | ||||||||||||||
|---|---|---|---|---|---|---|---|---|---|---|---|---|---|---|---|---|
| Measure | Variable | B | SEB | β | R2 | ΔR2 | B | SEB | β | R2 | ΔR2 | B | SEB | β | R2 | ΔR2 |
| SFC | Step 1 | .26* | .20** | .06 | ||||||||||||
| Age | 8.30 | 14.00 | .07 | 32.69 | 11.38 | .56** | 2.38 | 6.04 | .07 | |||||||
| Education | 1.03 | .23 | .54* | .33 | .23 | .27 | .14 | .09 | .25 | |||||||
| Step 2 | .61* | .36* | .49* | .29* | .08 | .02 | ||||||||||
| Stress | -.44 | .06 | -.63* | -.20 | .05 | -.55* | -.05 | .06 | -.14 | |||||||
| GAS | Step 1 | .31* | .09 | .08 | ||||||||||||
| Age | -26.57 | 279.42 | -.011 | 371.39 | 222.83 | .35 | -8.97 | 141.92 | -.01 | |||||||
| Education | 21.80 | 4.58 | .55* | 7.05 | 4.59 | .32 | 3.62 | 2.17 | .28 | |||||||
| Step 2 | .55* | .24* | .16 | .07 | .09 | .01 | ||||||||||
| Stress | -7.58 | 1.22 | -.52* | -1.85 | 1.07 | -.28 | -1.11 | 1.47 | -.13 | |||||||
| SAS-II | Step 1 | .18** | .22** | .03 | ||||||||||||
| Age | -15.09 | 12.81 | -.15 | -39.34 | 13.38 | -.56** | -4.39 | 6.39 | -.18 | |||||||
| Education | -.82 | .21 | -.49* | -.25 | .28 | -.17 | -.08 | .10 | -.13 | |||||||
| Step 2 | .62* | .43* | .57* | .34* | .04 | .01 | ||||||||||
| Stress | .43 | .05 | .69* | .26 | .05 | .59* | .04 | .07 | .10 | |||||||
p<.001.
p<.05;
the social functioning composite is represented by the abbreviation “SFC”
In adults with ASD, when age and education were entered into the model, they significantly predicted overall (composite) social functioning, F(2,35) = 4.27, p = .022, and social disability, F(2,35) = 5.05, p = .012, but not global functioning, F(2,35) = 1.59, p = .219. When overall (composite) stress was entered into the model, it significantly improved the prediction of overall (composite) social functioning, R2 change = .29, F(1,34) = 19.29, p < .001, and social disability, R2 change = .34, F(1,34) = 26.62, p < .001, but did not improve the prediction of global functioning, R2 change = .07, F(1,34) = 2.95, p = .095. Similarly, the entire group of independent variables significantly predicted overall (composite) social functioning, F(3,34) = 10.76, p < .001, adjusted R2 = .44, and social disability, F(3,34) = 14.71, p < .001, adjusted R2 = .53, both large effects according to Cohen (1988, 1992), but not global functioning, F(3,34) = 2.10, p = .118, adjusted R2 = .08. The regression weights, presented in Table 2, suggest that overall (composite) stress contributed significantly and to the greatest degree to the prediction of overall (composite) social functioning, B = -.20, t(34) = -4.40, p < .001, sr2 = .29, and social disability, B = .26, t(34) = 5.16, p < .001, sr2 = .34, but did not contribute significantly to the prediction of global functioning B = -1.11, t(33) = -.75, p = .458, sr2 = .02.
In healthy volunteers, the entire group of independent variables did not predict overall (composite) social functioning, F(3,33) = 1.10, p = .35, adjusted R2 = .01, global functioning, F(3,33) =1.14, p = .348, adjusted R2 = .01, or social disability, F(3,33) = .47, p = .631, adjusted R2 = -.05. Similarly, stress did not contribute significantly to the prediction of overall (composite) social functioning, B = -.05, t(33)= -.81, p =.43, sr2 = .02, global functioning, B = -1.11, t(33) = -.75, p = .458, sr2 = .02, or social disability, B = .04, t(34) = .58, p = .569, sr2 = .01.
Given that the social disability component of overall (composite) social functioning was significantly predicted by stress in our analysis of main effects, a confirmatory analysis of the interaction between group (i.e., ASD or control) and stress was performed. This analysis indicated that there was a significantly greater prediction of social disability by stress for participants in the ASD group than the control group, B = -.71, t(72) = -3.38, p = .001, after controlling for age and education.
Discussion
This study investigated stress in adults with ASD. First, we hypothesized that adults with ASD would experience more perceived and interviewer-observed stress than healthy volunteers. Second, we hypothesized that there would be an inverse relationship between stress and social functioning such that greater perceived and interview-observed stress predicts poorer social functioning in adults with ASD.
Our results indicate that adults with ASD have significantly higher perceived stress, interviewer-observed stress, and composite stress scores than healthy volunteers. Moreover, the size of this difference is relatively large, at Cohen's d values of 1.50, 1.38, and 1.18, and effect size r of .60, .57, and .51, for composite stress, observed stress, and perceived stress, respectively. This indicates that adults with ASD are likely to experience substantially more stress than healthy volunteers.
Our results also indicate that, in the entire sample of both adults with ASD and healthy volunteers, stress contributes significantly to the prediction of social functioning. Additionally, education contributed to the prediction of social functioning in the entire sample while age did not. This was true for all three ways in which social functioning was measured in this paper (social functioning composite, global functioning, and social disability).
Results of these analyses for adults with ASD and healthy volunteers were different from each other and from the overall results. In adults with ASD, greater stress was associated with poorer composite social functioning and social disability scores, but not global functioning scores. Additionally, in adults with ASD, older age was associated with poorer social functioning composite scores but not global functioning or social disability scores. Education did not contribute significantly to the prediction of any measure of social functioning in adults with ASD. In healthy volunteers, neither stress, age, nor education contributed significantly to the prediction of any measure of social functioning, a finding that was unexpected yet may be explained by the restricted range of stress and functioning in this sample of healthy volunteers.
Our findings highlight the role of psychosocial distress in adult functioning and outcomes in adults with ASD. They also highlight the extent to which adults with ASD experience greater stress and appear more stressed than adults without ASD, which is consistent with findings that indicate that children with ASD experience more stress than children without ASD (Corbett et al., 2006; Corbett et al., 2008; Corbett et al., 2009; Lanni et al., 2012; Spratt et al., 2011). Beyond this, the size of the effect across all analyses indicates that stress may be a very pertinent predictor of social functioning and, in connection, social outcomes. These findings, while preliminary, suggest the need to develop and assess treatments that are designed to help adults with autism deal with stress, especially interventions that can be implemented easily in real-world settings.
Although our hypotheses framed stress as a possible contributor to poorer social functioning in ASD, our design precluded a test of directionality, and a bi-directional relationship is likely. The social and communication deficits inherent in ASD may cause adults with ASD to experience more stress. It is also possible that this relationship works in the other direction such that individuals with better social functioning experience less stress. In addition, stress may have an additive effect on social impairments. Our findings, and the possibility that this relationship works in both directions, also suggest the need to test the effect of interventions that improve social functioning and stress response.
Several limitations must be acknowledged. First, our relatively small sample size reduced the power of this study, and results should thus be considered preliminary. Second, our data on adults with ASD are baseline data from a clinical trial of CET and EST for adults with ASD without intellectual disability. This trial included only individuals who had IQ scores greater than or equal to 80, who were between the ages of 18 and 45, and who needed some treatment. Thus, the individuals with ASD included in this study are not necessarily representative of the entire spectrum of individuals with ASD and may, in fact, be functioning better overall than many individuals with an ASD diagnosis. However, we argue that studying stress and social functioning in this group of individuals with ASD paints a more cautious picture of differences in stress between individuals with ASD and healthy volunteers and the relationship between stress and social functioning in adults with ASD than would necessarily be found in the entire very heterogeneous population of adults with ASD. Third, our measures of stress (BPRS) and global functioning (GAS) were limited and were used in this preliminary investigation opportunistically from previously collected baseline data. More specifically, our stress measure was constructed from only two scales on the BPRS. This limitation is discussed separately below. However, these preliminary findings have informed research on stress and coping in adults with ASD that utilizes more specific questionnaires and stress biomarkers (Autism Speaks grant #8568). Finally, comorbid disorders, including social anxiety, were not fully assessed and could have impacted findings.
It must be noted that the BPRS was completed by trained clinical raters during a broader, structured clinical interview that took place over a three to four hour period. Trained clinical raters assessed perceived stress (anxiety) based on patient reports of recent apprehension, concern, tension, fear, and worry. The use of a structured clinical interview in this context has inherent limitations in that stress during an atypical and potentially uncomfortable social interaction such as this clinical interview may not reflect generally high stress or may instead reflect social anxiety.
We examined the relationship between our stress composite score and an assessment of anxiety, the Covi Anxiety Scale (Covi, Rickels, & Lipman, 1981) in a subsample of healthy controls (n = 13) in order to examine normative psychometrics that may inform understanding of the distinction between BPRS-measured stress and anxiety. We found only a modest relationship in healthy controls between Covi Anxiety Scale scores and perceived stress (r2 = .150) and observed stress (r2 = .181). Thus, anxiety explains 15.0% of variance in perceived stress and 18.1% of variance in observed stress in this subsample, indicating that some variance in stress scores remained unexplained by anxiety. Interestingly, the relationship between Covi Anxiety Scale scores and perceived stress (r2 = .494) and observed stress (r2 = .482) was stronger in a subsample of the ASD group (n = 26), indicating that anxiety explained 49.4% of variance in perceived stress and 48.2% of variance in observed stress. It is possible that poor emotion regulation skills lead to a stronger relationship between stress and anxiety in ASD (White, Mazefsky, Dichter, Chui, Richey, & Ollendick, 2014). Future research should further explore the role of stress in anxiety in ASD. However, the Covi Anxiety Scale could not be included as a covariate in our main analyses because the small sample size would limit overall statistical power. While this limits the ability of our findings to characterize the contribution of both anxiety and stress to social functioning, these psychometric findings indicate that stress, as characterized in this study, may represent a related yet different construct than anxiety.
Future work should accomplish a number of key aims in order to address the limitations of the current study. First, future work should include a larger sample of both adults with ASD and healthy volunteers, and potentially other psychiatric populations. Second, future work should sample a more heterogeneous group of adults with ASD in order to account for the broad diversity encompassed within the diagnostic framework of ASD. Finally, future work should include biological measures of stress (e.g., cardiovascular reactivity, cortisol reactivity) so as to reduce potential reporting bias for symptomatology in adults with ASD and look at mechanisms that may underlie increased stress in ASD, such as emotion regulation (e.g., Mazefsky et al., 2013; Samson, Huber, & Gross, 2012).
In conclusion, the current study provides emerging evidence that adults with ASD experience more stress than healthy volunteers and that there is an inverse relationship between stress and social functioning in adults with ASD. While preliminary, these findings highlight the role that stress may play in the lives of adults with ASD and suggest potential future opportunities to develop effective and targeted psychosocial interventions.
Acknowledgments
This work was supported by NIH grants MH-85851 (SME and NJM), MH-95783 (SME), RR-24154 (SME), and HD-55748 (NJM), as well as grants from Autism Speaks (5703, SME and NJM, and 8568, LBF), the Department of Defense (AR100344, SME and NJM), and the Pennsylvania Department of Health (NJM).
Footnotes
The authors have no conflict of interest to declare.
Literature Cited
- Bellack AS, Morrison RL, Mueser KT, Wade JH, Sayers SL. Role play for assessing the social competence of psychiatric patients. Psychological Assessment: A Journal of Consulting and Clinical Psychology. 1990;2(3):248. [Google Scholar]
- Benjamini Y, Hochberg Y. Controlling the false discovery rate: A practical and powerful approach to multiple testing. Journal of the Royal Statistical Society. 1995;57(1):289–300. [Google Scholar]
- Bishop-Fitzpatrick L, Minshew NJ, Eack SM. A systematic review of psychosocial interventions for adults with autism spectrum disorders. Journal of Autism and Developmental Disorders. 2013;43(3):687–694. doi: 10.1007/s10803-012-1615-8. [DOI] [PMC free article] [PubMed] [Google Scholar]
- Boso M, Emanuele E, Minazzi V, Abbamonte M, Politi P. Effect of long-term interactive music therapy on behavior profile and musical skills in young adults with severe autism. The Journal of Alternative and Complementary Medicine. 2007;13(7):709–712. doi: 10.1089/acm.2006.6334. [DOI] [PubMed] [Google Scholar]
- Box GE, Cox DR. An analysis of transformations. Journal of the Royal Statistical Society Series B (Methodological) 1964:211–252. [Google Scholar]
- Breusch TS, Pagan AR. A simple test for heteroscedasticity and random coefficient variation. Econometrica: Journal of the Econometric Society. 1979:1287–1294. [Google Scholar]
- Brown MB, Forsythe AB. The small sample behavior of some statistics which test the equality of several means. Technometrics. 1974;16:129–132. [Google Scholar]
- Centers for Disease Control and Prevention. Prevalence of autism spectrum disorders--Autism and developmental disabilities monitoring network, 14 Sites, United States 2008. Surveillance Summaries, MMWR 2012. 2012;61(No. 3) [PubMed] [Google Scholar]
- Cohen J. Statistical power analysis for the behavioral sciencies. 2nd. Hillsdale, NJ: Lawrence Erlbaum Associates; 1988. [Google Scholar]
- Cohen J. A power primer. Psychological Bulletin. 1992;112(1):155159. doi: 10.1037//0033-2909.112.1.155. [DOI] [PubMed] [Google Scholar]
- Cohen S. After effects of stress on human performance and social behavior: A review of research and theory. Psychological Bulletin. 1980;88(1):82–108. [PubMed] [Google Scholar]
- Cohen S, Kamarck T, Mermelstein R. A global measure of perceived stress. Journal of Health and Social Behavior. 1983;24(4):385–396. [PubMed] [Google Scholar]
- Cohen S, Williamson GM. Perceived stress in a probability sample of the United States. In: S S, O S, editors. The Social Psychology of Health. Newbury Park: Sage Publications; 1988. pp. 31–67. [Google Scholar]
- Corbett BA, Mendoza S, Abdullah M, Wegelin JA, Levine S. Cortisol circadian rhythms and response to stress in children with autism. Psychoneuroendocrinology. 2006;31(1):59–68. doi: 10.1016/j.psyneuen.2005.05.011. [DOI] [PubMed] [Google Scholar]
- Corbett BA, Mendoza S, Wegelin JA, Carmean V, Levine S. Variable cortisol circadian rhythms in children with autism and anticipatory stress. Journal of Psychiatry & Neuroscience. 2008;33(3):227–234. [PMC free article] [PubMed] [Google Scholar]
- Corbett BA, Schupp CW, Levine S, Mendoza S. Comparing cortisol, stress, and sensory sensitivity in children with autism. Autism Research. 2009;2(1):39–49. doi: 10.1002/aur.64. [DOI] [PMC free article] [PubMed] [Google Scholar]
- Covi L, Rickels K, Lipman OS. Effects of psychotropic agents on primary depression. Psychopharmacology Bulletin. 1981;1981:100–101. [Google Scholar]
- Davies MA, Bromet EJ, Schulz SC, Dunn LO. Community adjustment of chronic schizophrenic patients in urban and rural settings. Hospital & Community Psychiatry. 1989 doi: 10.1176/ps.40.8.824. [DOI] [PubMed] [Google Scholar]
- Durbin J, Watson GS. Testing for serial correlation in least squares regression: I. Biometrika. 1950;37(3/4):409–428. [PubMed] [Google Scholar]
- Eaves L, Ho H. Brief report: Stability and change in cognitive and behavioral characteristics of autism through childhood. Journal of Autism and Developmental Disorders. 1996;26(5):557–569. doi: 10.1007/BF02172276. [DOI] [PubMed] [Google Scholar]
- Endicott J, Spitzer RL, Fleiss JL, Cohen J. Global Assessment Scale: Procedure for measuring overall severity of psychiatric disturbance. Archives of General Psychiatry. 1976;33(6):766–771. doi: 10.1001/archpsyc.1976.01770060086012. [DOI] [PubMed] [Google Scholar]
- First M, Spitzer R, Gibbon M, Williams J. Structured Clinical Interview for the DSM-IV-TR Axis I Disorders, Research Version, Patient Edition. New York: Biometrics Research, New York State Psychiatric Institute; 2002. [Google Scholar]
- Gerhardt P, Lainer I. Addressing the needs of adolescents and adults with autism: A crisis on the horizon. Journal of Contemporary Psychotherapy. 2011;41(1):37–45. [Google Scholar]
- Gillespie-Lynch K, Sepeta L, Wang Y, Marshall S, Gomez L, Sigman M, Hutman T. Early Childhood Predictors of the Social Competence of Adults with Autism. Journal of Autism and Developmental Disorders. 2012;42(2):161–174. doi: 10.1007/s10803-011-1222-0. [DOI] [PMC free article] [PubMed] [Google Scholar]
- Glazer WM, Aaronson HS, Prusoff BA, Williams DH. Assessment of social adjustment in chronic ambulatory schizophrenics. The Journal of Nervous and Mental Disease. 1980;168(8):493–497. doi: 10.1097/00005053-198008000-00008. [DOI] [PubMed] [Google Scholar]
- Hafkenscheid A. Reliability of a standardized and expanded Brief Psychiatric Rating Scale: A replication study. Acta Psychiatrica Scandinavica. 1993;88:305–310. doi: 10.1111/j.1600-0447.1993.tb03464.x. [DOI] [PubMed] [Google Scholar]
- Hardy MA. Regression with dummy variables. Newbury Park, CA: Sage; 1993. [Google Scholar]
- Hatton C, Haddock G, Taylor JL, Coldwell J, Crossley R, Peckham N. The reliability and validity of general psychotic rating scales with people with mild and moderate intellectual disabilities: an empirical investigation. Journal of Intellectual Disability Research. 2005;49(7):490–500. doi: 10.1111/j.1365-2788.2005.00696.x. [DOI] [PubMed] [Google Scholar]
- Hedlund JL, Vieweg BW. The Brief Psychiatric Rating Scale (BPRS): A comprehensive review. Journal of Operational Psychiatry. 1980;11:48–65. [Google Scholar]
- Hogarty GE, Flesher S, Ulrich R, et al. Cognitive enhancement therapy for schizophrenia: Effects of a 2-year randomized trial on cognition and behavior. Archives of General Psychiatry. 2004;61(9):866–876. doi: 10.1001/archpsyc.61.9.866. [DOI] [PubMed] [Google Scholar]
- Howlin P, Goode S, Hutton J, Rutter M. Adult outcome for children with autism. Journal of Child Psychology and Psychiatry. 2004;45(2):212–229. doi: 10.1111/j.1469-7610.2004.00215.x. [DOI] [PubMed] [Google Scholar]
- Jansen LMC, Gispen-de Wied CC, van der Gaag RJ, van Engeland H. Differentiation between autism and multiple complex developmental disorder in response to psychosocial stress. Neuropsychopharmacology. 2003;28(3):582–590. doi: 10.1038/sj.npp.1300046. [DOI] [PubMed] [Google Scholar]
- Klin A, Saulnier CA, Sparrow SS, Cicchetti DV, Volkmar FR, Lord C. Social and communication abilities and disabilities in higher functioning individuals with autism spectrum disorders: The Vineland and the ADOS. Journal of Autism and Developmental Disorders. 2007;37(4):748–759. doi: 10.1007/s10803-006-0229-4. [DOI] [PubMed] [Google Scholar]
- Lanni KE, Schupp CW, Simon D, Corbett BA. Verbal ability, social stress, and anxiety in children with Autistic Disorder. Autism. 2012;16(2):123–138. doi: 10.1177/1362361311425916. [DOI] [PMC free article] [PubMed] [Google Scholar]
- Leucht S, Kane JM, Kissling W, Hamann J, Etschel E, Engel R. Clinical implications of brief psychiatric rating scale scores. The British Journal of Psychiatry. 2005;187(4):366–371. doi: 10.1192/bjp.187.4.366. [DOI] [PubMed] [Google Scholar]
- Levine TP, Sheinkopf SJ, Pescosolido M, Rodino A, Elia G, Lester B. Physiologic arousal to social stress in children with Autism Spectrum Disorders: A pilot study. Research in Autism Spectrum Disorders. 2011;6(1):177–183. doi: 10.1016/j.rasd.2011.04.003. [DOI] [PMC free article] [PubMed] [Google Scholar]
- Levy A, Perry A. Outcomes in adolescents and adults with autism: A review of the literature. Research in Autism Spectrum Disorders. 2011;5(4):1271–1282. [Google Scholar]
- Lord C, Risi S, Lambrecht L, Cook EH, Leventhal BL, DiLavore PC, et al. Rutter M. The Autism Diagnostic Observation Schedule-Generic: A standard measure of social and communication deficits associated with the spectrum of autism. Journal of Autism and Developmental Disorders. 2000;30(3):205–223. [PubMed] [Google Scholar]
- Lotan I, Fireman L, Weizman A, Steiner I. How Safe Is Acute High Dose Corticosteroid Therapy In Neurological Disorders? (P1.035) Neurology. 2014;82(10 Supplement):P1.035. [Google Scholar]
- Mardia KV. Measures of multivariate skewness and kurtosis with applications. Biometrika. 1970;57(3):519–530. [Google Scholar]
- Marquardt DW. You should standardize the predictor variables in your regression models. Journal of the American Statistical Association. 1980;75(369):87–91. [Google Scholar]
- Mazefsky CA, Herrington J, Siegel M, Scarpa A, Maddox BB, Scahill L, White SW. The role of emotion regulation in autism spectrum disorder. Journal of the American Academy of Child & Adolescent Psychiatry. 2013;52(7):679–688. doi: 10.1016/j.jaac.2013.05.006. [DOI] [PMC free article] [PubMed] [Google Scholar]
- Morlan KK, Tan SY. Comparison of the brief psychiatric rating scale and the brief symptom inventory. Journal of Clinical Psychology. 1998;54(7):885–894. doi: 10.1002/(sici)1097-4679(199811)54:7<885::aid-jclp3>3.0.co;2-e. [DOI] [PubMed] [Google Scholar]
- Odom SL, Boyd BA, Hall LJ, Hume K. Evaluation of comprehensive treatment models for individuals with autism spectrum disorders. Journal of Autism & Developmental Disorders. 2010;40(4):425–436. doi: 10.1007/s10803-009-0825-1. [DOI] [PubMed] [Google Scholar]
- Odom SL, Collet-Klingenberg L, Rogers SJ, Hatton DD. Evidence-based practices in interventions for children and youth with autism spectrum disorders. Preventing School Failure. 2010;54(4):275–282. [Google Scholar]
- Overall JE, Beller SA. The Brief Psychiatric Rating Scale (BPRS) in geropsychiatric research: I. Factor structure on an inpatient unit. Journal of Gerontology. 1984;39(2):187–193. doi: 10.1093/geronj/39.2.187. [DOI] [PubMed] [Google Scholar]
- Overall JE, Gorham DR. The Brief Psychiatric Rating Scale. Psychological Reports. 1962;10(3):799–812. [Google Scholar]
- Ruble LA, Heflinger CA, Renfrew JW, Saunders RC. Access and service use by children with autism spectrum disorders in Medicaid Managed Care. Journal of Autism and Developmental Disorders. 2005;35(1):3–13. doi: 10.1007/s10803-004-1026-6. [DOI] [PubMed] [Google Scholar]
- Samson AC, Huber O, Gross JH. Emotion regulation in Asperger's syndrome and high-functioning autism. Emotion. 2012;12(4):659–665. doi: 10.1037/a0027975. [DOI] [PubMed] [Google Scholar]
- Schooler N, Weissman M, Hogarty GE. Social adjustment scale for schizophrenics. In: Hargreaves WA, Attkisson CC, Sorenson J, editors. Resource material for community mental health program evaluators. 1979. pp. 290–303. DHHS Pub. No. (ADM) [Google Scholar]
- Seltzer MM, Shattuck P, Abbeduto L, Greenberg JS. Trajectory of development in adolescents and adults with autism. Mental Retardation and Developmental Disabilities Research Reviews. 2004;10(4):234–247. doi: 10.1002/mrdd.20038. [DOI] [PubMed] [Google Scholar]
- Selye H. The stress of life. New York, NY: McGraw Hill; 1956. [Google Scholar]
- Shattuck PT, Narendorf SC, Cooper B, Sterzing PR, Wagner M, Taylor JL. Postsecondary education and employment among youth with autism spectrum disorder. Pediatrics. 2012;129(6):1042–1049. doi: 10.1542/peds.2011-2864. [DOI] [PMC free article] [PubMed] [Google Scholar]
- Shattuck PT, Roux AM, Hudson LE, Lounds Taylor J, Maenner MJ, Trani JF. Services for adults with an autism spectrum disorder. Canadian Journal of Psychiatry. 2012;57(5):284–291. doi: 10.1177/070674371205700503. [DOI] [PMC free article] [PubMed] [Google Scholar]
- Shattuck PT, Roux AM, Hudson LE, Taylor JL, Maenner MJ, Trani JF. Services for adults with an autism spectrum disorder. Canadian Journal of Psychiatry. 2012;57(5):284–291. doi: 10.1177/070674371205700503. [DOI] [PMC free article] [PubMed] [Google Scholar]
- Siegel M, Gabriels RL. Psychiatric hospital treatment of children with autism and serious behavioral disturbance. Child and Adolescent Psychiatric Clinics of North America. 2014;23(1):125–142. doi: 10.1016/j.chc.2013.07.004. [DOI] [PubMed] [Google Scholar]
- Smith LE, Maenner MJ, Seltzer MM. Developmental trajectories in adolescents and adults with autism: The case of daily living skills. Journal of the American Academy of Child & Adolescent Psychiatry. 2012;51(6):622–631. doi: 10.1016/j.jaac.2012.03.001. [DOI] [PMC free article] [PubMed] [Google Scholar]
- Spratt E, Nicholas J, Brady K, Carpenter L, Hatcher C, Meekins K, et al. Charles J. Enhanced cortisol response to stress in children in autism. Journal of Autism and Developmental Disorders. 2011:1–7. doi: 10.1007/s10803-011-1214-0. [DOI] [PMC free article] [PubMed] [Google Scholar]
- Stanfield AC, McIntosh AM, Spencer MD, Philip R, Gaur S, Lawrie SM. Towards a neuroanatomy of autism: A systematic review and meta-analysis of structural magnetic resonance imaging studies. European Psychiatry. 2008;23(4):289–299. doi: 10.1016/j.eurpsy.2007.05.006. [DOI] [PubMed] [Google Scholar]
- Taylor J, Seltzer M. Employment and post-secondary educational activities for young adults with autism spectrum disorders during the transition to adulthood. Journal of Autism and Developmental Disorders. 2011;41(5):566–574. doi: 10.1007/s10803-010-1070-3. [DOI] [PMC free article] [PubMed] [Google Scholar]
- Wechsler D. Wechsler Adult Intelligence Scale® 4th Edition (WAIS®-IV) Harcourt Assessment; San Antonio, TX: 2008. [Google Scholar]
- White SW, Mazefsky CA, Dichter G, Chiu P, Richey JA, Ollendick TH. Neural, physiological, and cognitive mechanisms underlying emotion regulation difficulties: Understanding the common occurrence of anxiety in people with autism. International Journal of Developmental Neuroscience. 2014 doi: 10.1016/j.ijdevneu.2014.05.012. Advance online publication. [DOI] [PMC free article] [PubMed] [Google Scholar]
- Williams RB. Psychosocial and biobehavioral factors and their interplay in coronary heart disease. Annual Review of Clinical Psychology. 2008;4:349–365. doi: 10.1146/annurev.clinpsy.4.022007.141237. [DOI] [PubMed] [Google Scholar]
- Wing L, Gould J. Severe impairments of social interaction and associated abnormalities in children: Epidemiology and classification. Journal of Autism and Developmental Disorders. 1979;9(1):11–29. doi: 10.1007/BF01531288. [DOI] [PubMed] [Google Scholar]