Abstract
Cell adhesion molecule cadherins play important roles in both development and maintenance of adult structures. Most studies on cadherin expression have been carried out in developing organisms, but information on cadherin distribution in adult vertebrate brains is limited. In this study, we used in situ hybridization to examine mRNA expression of three cadherins, protocadherin-19, protocadherin-17 and cadherin-6 in adult zebrafish brain. Each cadherin exhibits a distinct expression pattern in the fish brain, with protocadherin-19 and protocadherin-17 showing much wider and stronger expression than that of cadherin-6. Both protocadherin-19 and protocadherin-17 expressing cells occur throughout the brain with strong expression in the ventromedial telencephalon, periventricular regions of the thalamus and anterior hypothalamus, stratum periventriculare of the optic tectum, dorsal tegmental nucleus, granular regions of the cerebellar body and valvula, and superficial layers of the facial and vagal lobes. Numerous sensory structures (e.g. auditory, gustatory, lateral line, olfactory and visual nuclei) and motor nuclei (e.g. oculomotor, trochlear, trigeminal motor, abducens and vagal motor nuclei) contain protocadherin-19 and/or protocadherin-17 expressing cell. Expression of these two protocadherins is similar in the ventromedial telencephalon, thalamus, hypothalamus, facial and vagal lobes, but substantially different in the dorsolateral telencephalon, intermediate layers of the optic tectum, and cerebellar valvula. In contrast to the two protocadherins, cadherin-6 expression is much weaker and limited in the adult fish brain.
Keywords: cell adhesion molecules, cerebellum, motor nuclei, sensory systems, RRID: 2DB-GENO-030619-2, RRID: AB_514497, Roche Cat. # 11093274910, RRID: AB_193290, RRID: XM_684743, RRID: BC_129243
Introduction
During vertebrate development, the anterior neural tube develops into the brain, while the posterior neural tube becomes the spinal cord. Formation of discrete and relatively large brain regions and patterning of the spinal cord are controlled by numerous regulatory molecules including members of Dlx, Pax, Otx and Hox gene families (reviewed by Puelles and Rubenstein, 1993; Stoykova and Gruss, 1994; Lumsden and Krumlauf, 1996; Bishop et al., 2000; Acampora et al., 2001; Briscoe and Ericson, 2001; Lichtneckert and Reichert, 2008; Trümpel et al., 2009), while stabilization of the embryonic brain divisions, formation of gray matter and functional neural circuits, axonal growth and pathfinding, synaptogenesis and synaptic plasticity depend on activities of many other molecules including cell adhesion molecule cadherins (reviewed by Redies et al., 2003; Kim et al., 2011; Hirano and Takeichi, 2012). Cadherins are Ca++-dependent transmembrane proteins that mediate cell-cell adhesion mainly through homophilic interactions (reviewed by Gumbiner, 2005; Takeichi, 2011; Hirano and Takeichi, 2012). Cadherins form a large super-family of genes that are divided into several groups including classical cadherins, protocadherins and desmosomal cadherins (Nollet et al., 2000). A typical classical cadherin protein (e.g. cadherin-1, cadherin-6) has an extracellular domain (EC) consisting of five homologous repeats, each about 110 amino acids in length, a transmembrane domain and a cytoplasmic domain. The cytoplasmic domain of the classical cadherins is more conserved than other regions of the molecule. It interacts with actin cytoskeletal proteins via catenins (Nollet et al., 2000; Hirano and Takeichi, 2012). Protocadherin (pcdh) subfamily has more members (about 80 in mammals) than any other cadherin subfamily (Yagi, 2003; 2008). Pcdhs are divided into clustered (e.g. α-, β- and γ-pcdhs) and non-clustered (δ-pcdhs). Like the classical cadherins, the δ-pcdhs (e.g. pcdh17 and pcdh19) contain three domains, but are different from the classical cadherins mainly in the number of EC repeats (six or seven) and in having a less conserved cytoplasmic domain (Redies et al., 2005; Vanhalst et al., 2005).
There is extensive knowledge of expression and function of both the classical cadherins and δ-pcdhs in embryonic vertebrate central nervous system (CNS) (reviewed by Redies, 2000; Redies et al., 2003; Redies et al., 2005; Kim et al., 2011; Hirano and Takeichi, 2012). Most of the cadherins show unique and dynamic expression during CNS development. For example, cadherin-2 (also called N-cadherin) is expressed widely in the neural epithelium in early stages of neural development in zebrafish, chicken and mammals, and its expression becomes progressively restricted as development proceeds (Hatta et al., 1987; Redies and Takeichi, 1993; Bitzur et al., 1994). Expression of cadherins often coincides with critical stages of CNS development, with locations of brain structures (e.g. neuromeres) and/or their boundaries (Redies, 2000; Hirano and Takeichi, 2012). Moreover, there is a close correlation between cadherin expression and formation of functional neural circuits in the developing vertebrate CNS (Redies, 1995; Redies et al., 2003). Functional studies of selective cadherins have demonstrated that these molecules participate in the overall CNS development (e.g. cadherin-2 in zebrafish and mouse embryos), as well as formation of specific neural circuits (e.g. cadherin-4 in embryonic chick retino-tectal pathway) through their homophilic bindings (for reviews, see Redies et al., 2003; Suzuki and Takeichi, 2008; Kim et al., 2011; Hirano and Takeichi, 2012).
In contrast to the wealth of information on cadherin expression and function in the developing vertebrate CNS, there are only a few published reports on the distribution of cadherins in the CNS of adult organisms. Moreover, most of these studies deal mainly with cadherin expression in a subset of brain structures (e.g. basal ganglia, Hertel et al., 2008). Persistent strong expression of cadherins (e.g. pcdh1) in these brain regions suggests that cadherins play a role in the CNS at adult stages (Hertel et al., 2008; Krishna-K et al., 2009). Both cadherin-2 and cadherin-11 were shown to be involved in long-term potentiation in the mammal hippocampus (reviewed by Hirano and Takeichi, 2012). Cadherins may also contribute to regeneration in the vertebrate CNS. Expression of cadherin-2 and cadherin-4 is greatly increased in regenerating adult zebrafish visual structures (e.g. retina and optic nerve) and cerebellum (Liu et al., 2002; Liu et al., 2004), and blocking cadherin-2 up-regulation using morpholino antisense oligonucleotides technology severely disrupts the optic nerve regeneration (Liu and Bhattarai, unpublished observation). Moreover, results from recent studies in mice and rats suggest that cadherin-2 promotes axonal regeneration in the spinal cord (Mollinari et al., 2009; Kasai et al., 2014). As the first step in determining cadherin function in normal and/or regenerating CNS of adult zebrafish, a model organism for studying adult neurogenesis, regeneration and human disorder (reviewed by Santana et al., 2012; Schmidt et al., 2013; Stewart et al., 2014), we examined mRNA expression of cadherin-6 (cdh6, a member of the classical cadherin family), pcdh17 and pcdh19 (both are members of the non-clustered δ-pcdhs) in the entire brain and anterior spinal cord of adult zebrafish using in situ hybridization method.
Methods and Materials
Animals
Adult zebrafish (Danio rerio) of 12–18 months old, raised from embryos obtained from in house breeding, were kept in 10-gallon tanks at 28°C on a 12-h light/12-h dark cycle and maintained according to standard procedures (Westerfield, 2007). All animal related procedures conformed to NIH standards and were approved by the University of Akron Committees on Use and Care of Animals in Research.
Tissue preparation
Twelve adult zebrafish of both sexes were killed with an overdose of tricaine methanesulfonate (Sigma, St. Louis, MO). The fish were placed on ice, and their brains were quickly removed and placed in an ice-cold fixative solution (4% paraformaldehyde in 0.1 M phosphate buffered saline, PBS, pH=7.4). After an overnight fixation at 4°C, the brains were rinsed in PBS, followed by immersion in 20% sucrose (dissolved in PBS) overnight at 4°C. The brains were embedded in a mixture (1:1) of 20% sucrose and OCT compound (Sakura, Netherland) as described previously (Barthel and Raymond, 1990). The embedded brains were stored at −80°C until cryosectioned at 16 μm. Sectioned tissues were collected on Fisher superfrost glass slides (Fisher Scientifics, Waltham, MA), and air-dried for one hour at room temperature before stored at −20°C. The sections were used for in situ hybridization within one week. Three sets of alternate cross sections from each brain were collected, each set for staining of one of three cadherin cRNA probes (see below).
In situ hybridization
A cDNA fragment corresponding to the nucleotides 228–1359 of zebrafish cdh6 (GenBank Accession No. AB 193290), obtained using primers (forward primer: 5′-GCGGAAAAGATGAGGACTTG-3′, reverse primer: 5′-CATCCACATCCTCGACACTG-3′) and cDNAs from 50 hours post fertilization (hpf) zebrafish embryos, was cloned into the pCRII-TOPO vector (Invitrogene, Carlsbad, CA) and used as a template to generate cdh6 cRNA probes (Liu et al., 2006). For synthesizing pcdh17 cRNA probes, a cDNA fragment corresponding to the nucleotides 678–1525 of zebrafish pcdh17 (GenBank Accession No. XM 684743), produced using primers (forward primer: 5′-CTGTGTTTGAACAGCCCTCA-3′, reverse primer: 5′-TTGCACCATCAGTGGGTTTA-3′) and cDNAs from 20–50 hpf zebrafish embryos, was cloned into the pCRII-TOPO vector, and used as the template (Liu et al., 2009). For making pcdh19 cRNA probes, a cDNA fragment corresponding to the nucleotides 43–985 of zebrafish pcdh19 (GenBank Accession No. BC 129243), obtained using primers (forward primer: 5′-CAATGGCGAGGTGGTCTACT-3′, reverse primer: 5′-CAACTCCAGCGTTTTTAGGG-3′) and cDNAs from 20–50 hpf zebrafish embryos, was also cloned into the pCRII-TOPO vector and used as the template (Liu et al., 2010). Procedures used for the generation of antisense digoxigenin (DIG)-labeled RNA probes and in situ hybridization on tissue sections were described in detail in Liu et al. (1999). Briefly, tissue sections were rehydrated in decreasing concentrations of ethanol, treated with proteinase K (0.01 mg/ml, Roche, Indianapolis, IN), incubated in 0.1 M triethanolamine (Sigma), followed by rinsing in 0.1 M triethanolamine with 0.25% acetic anhydride (Fisher). The tissue slides were dehydrated in increasing concentrations of ethanol and air-dried. Tissue sections on each slide were incubated with 75 μl hybridization solution (2 μg/ml of cRNA probes), overnight at 59°C. Detection of the DIG-labeled probes was performed using an alkaline phosphatase coupled anti-DIG antibody (AB_514497, Roche, diluted at 1:5,000). Visualization of the labeling was accomplished by incubating the sections overnight at room temperature in a solution made from NTB/BCIP tablets (Roche). Tissues used for each of the three cadherin cRNA probes were processed side by side, with identical treatments (e.g. color reaction time), except different cRNA probes were added.
Data Analysis
Brain sections processed for the in situ hybridization were observed under an Olympus BX51 microscope equipped with Normarski optics. Digital images were obtained with a SPOT Insight digital camera (Diagnostic Instrument Inc., Sterling Heights, MI). The images were slightly adjusted for contrast and sharpness using Adobe Photoshop 6.0 software (San Jose, CA). Schematic drawings at representative cross sections of low magnification images were made from either the left or right half of the brain using tracing papers over the digital images displayed on a computer monitor. All images show cross sections with dorsal side up. Section levels of most images were shown in Figure 1. Neuroanatomy of the Zebrafish Brain by Wullimann et al. (1996) was used as the main reference source for identification of brain regions and terminology, and supplemented with more recent works by Rink and Wullimann (2001), Mueller et al., 2004; Castro et al. (2006a, b) and Mueller and Guo (2009).
Figure 1.
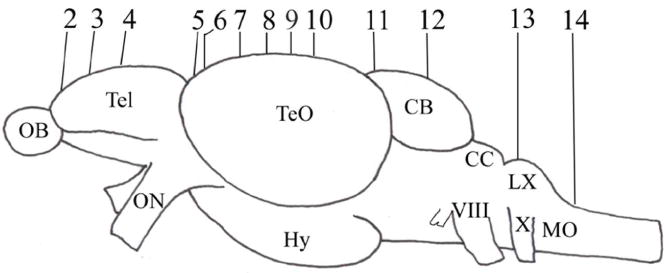
Schematic drawing of an adult zebrafish brain (lateral view) showing levels of cross sections. Numbers represent respective figure numbers. See list for abbreviations.
Results
Staining pattern and intensity for each cadherin cRNA probe were similar on tissue sections from all of the twelve brains. Although staining intensities of these three cRNA probes were similarly strong in embryonic tissues (Liu et al., 2006, 2009, 2010), their labeling intensities were obviously different in the adult brain, especially between those of the pcdhs (i.e. pcdh17 and pcdh19) and cdh6. Moreover, pcdh19 appeared to have the most widespread expression domains in the adult brain among the three cadherins, schematic drawings for helping localization of their distributions in the brain were made using tissue sections processed for pcdh19 staining as templates. It is therefore more convenient to first describe pcdh19 expression, followed by pcdh17, and finally cdh6 expression patterns. Description of cadherin expression patterns proceeded from anterior brain to posterior brain regions.
Telencephalon
Like most other vertebrates, the zebrafish telencephalon consists of a pair of olfactory bulbs and two telencephalic hemispheres, with the latter located posterodorsal to the former (Wullimann et al., 1996). In the olfactory bulb, pcdh19 expression was seen mainly concentrated in the central region, the internal cellular layer (ICL, Fig. 2A left panel and E). pcdh17 was also detected in ICL of the olfactory bulb, but some labeled cells were also seen scattered in more peripheral regions: the external cellular (ECL containing mitral cells) and glomerular layers (GL, Fig. 2A middle panel and F). There was little or no cdh6 expression in the olfactory bulb (Fig. 2A right panel and G). The telencephalic hemisperes can be divided into the dorsal telencephalon (dorsal telencephalic area) and ventral telencephalon (ventral telencephalic area), with the former regarded as the pallium, and the later viewed as the subpallium (Wullimann and Mueller, 2004; Mueller and Guo, 2009). In the anterodorsal telencephalon, pcdh19 expressing cells appeared to be evenly distributed throughout the region (Fig. 2B), and some cells located adjacent to the junction between the olfactory bulb and telencephalon, ventricular cells near the dorsomedial area (arrows) and lateral region showed stronger labeling. Expression of pcdh17 in this telecephalic region was confined mainly to the medial one third of the brain (Fig. 2C), while no obvious staining was seen for cdh6 in this brain area (Fig. 2D).
Figure 2.
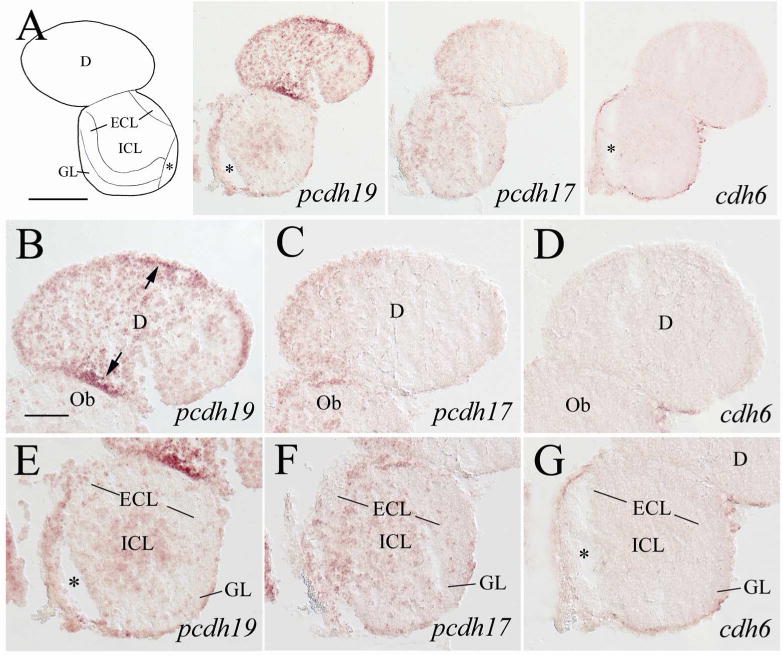
Expression of pcdh19, pcdh17 and cdh6 in the telencephalon (anterior region) and olfactory bulb. In the top panels, a schematic drawing of half of the brain section (left or right side) processed for pcdh19 staining is used to indicate major brain structures at this level, which is accompanied by low magnifications of half of the brain sections (left or right side, from adjacent areas). The anterior-posterior level of the brain region is shown in Figure 1. The top panels of most of the subsequent figures with low magnified views of brain sections are similarly arranged. B–D are higher magnifications of their respective dorsal telencephalon in the upper panels, while panels E–G are higher magnified views of the olfactory bulb in the upper panels. The arrows in panel B indicate cells with stronger staining. Asterisks indicate artificial cracks in the tissue sections. See list for abbreviations. Scale bar = 200 μm for the top panels, 50 μm for the lower panels (B–G have the same magnification).
In the precommissural telencephalon, expression of pcdh19 and pcdh17 in the dorsomedial region was similar in that labeled cells were located mainly in the ventricular layer (Fig. 3A–C). But their expression in the dorsolateral region was distinct, with numerous pcdh19 expressing cells present in this area (i.e. lateral zone and posterior zone of the dorsal telencephalic area, Dl and Dp, respectively, Fig. 3E), where pcdh17 staining was almost completely absent (Fig. 3F). In the ventral telencephalon adjacent to the midline (i.e. dorsal and ventral nuclei of the ventral telencephalic area, Vd and Vv respectively), expression of these two pcdhs was similar (Fig. 3A, H and I). The central nucleus of the telencephalic area (Vc) contained both pcdh19 (Fig. 3H) and pcdh17 (Fig. 3I). The dorsal part of the entopeduncular nucleus (ENd) had strongly labeled pcdh19 expressing cells (Fig. 3H), but there was little or no pcdh17 expression in this nucleus (Fig. 3I). cdh6 expression in the telencephalon at this level was absent, except in ventricular cells in the dorsal half of the telencephalon (Fig. 3A, right panel), also with stronger labeled cells in the dorsomedial region (Fig. 3D). Expression of pcdh19 in the dorsal telencephalon of the postcomissural telencephalon (Fig. 4) was similar to that in the more anterior telencephalon (Fig. 3) in that pcdh19 expressing cells were mainly found in the lateral region (Fig. 4A left panel, 4B). In the dorsolateral telencephalon, cells with stronger labeling appeared to be located along the border line between Dl and central zone (Dc), and between Dl and Dp (Fig. 4A left panel). Moreover, ventricular cells in Dl were more intensely stained than those in the medial zone of the dorsal telencephalon (Dm), separated by the sulcus ypsiloniforms (SY, Fig. 4B). A few pcdh19 expressing cells were also seen in a midline region (i.e. medial part of the postcommissural nucleus, Vp) in the ventral telencephalon (Fig. 4A left panel). pcdh17 expression in the dorsal telencephalon was somewhat similar to pcdh19 expression in the ventricular region of Dm (Fig. 4A middle panel), but different in ventricular cells adjacent to SY in that only a portion (about 50–60 μm in length) of the ventricular zone medial to SY was more strongly stained than those on either side of SY (Fig. 4C). Moreover, labeled cells in deeper part of this region outlined an area about 50 μm X 150 μm in Dm (Fig. 4C). There was less pcdh17 expression, compared to pcdh19, in Dl. pcdh17 expression in the ventromedial telencephalon (i.e. Vp, Fig. 4A middle panel) was similar to pcdh19 expression in this area. Weak pcdh19 and pcdh17 expression was detected in the ventrolateral telencephalon including both the dorsal and ventral parts of the entopeduncular nucleus (ENd and ENv, respectively; Fig. 4A left and middle panels). Expression of both pcdhs became stronger in ENv at a more posterior level (Fig. 5A left and middle panels). cdh6 expression was absent in the telencephalon at these levels, except in some ventricular cells medial to SY (Fig. 4A right panel, 4D), and a few scattered cells ventral to these cdh6 expressing ventricular cells. Interestingly, this cdh6 expressing ventricular segment was similar in length to the pcdh17 expressing ventricular segment (Fig. 4C).
Figure 3.
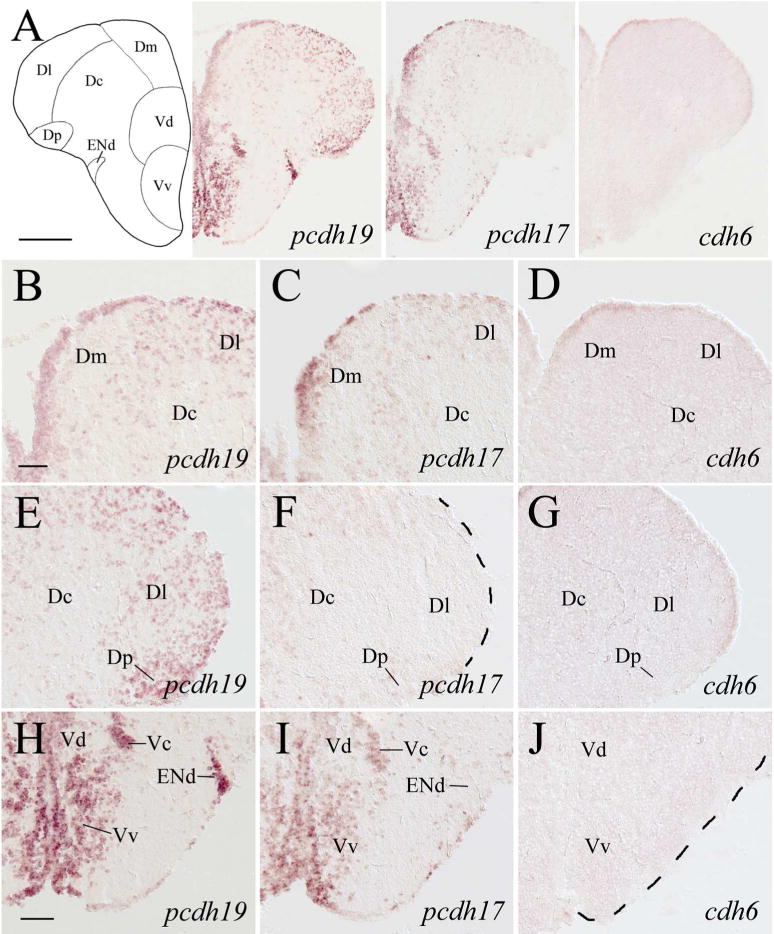
Expression of pcdh19, pcdh17 and cdh6 in the precommissural telencephalon. Images in the top panels show low magnified views of adjacent brain regions at a level shown in Figure 1. B–D show higher magnifications of the dorsomedial regions of the dorsal telencephalon, while E–G show higher magnified views of the dorsolateral regions of the dorsal telencephalon shown in the top respective panels. H–J are higher magnifications of the ventral regions of the telencephalon shown in the top panels. See the list for abbreviations. Scale bar = 200 μm for the top panels, 50 μm for the lower panels (B–G have the same magnification).
Figure 4.
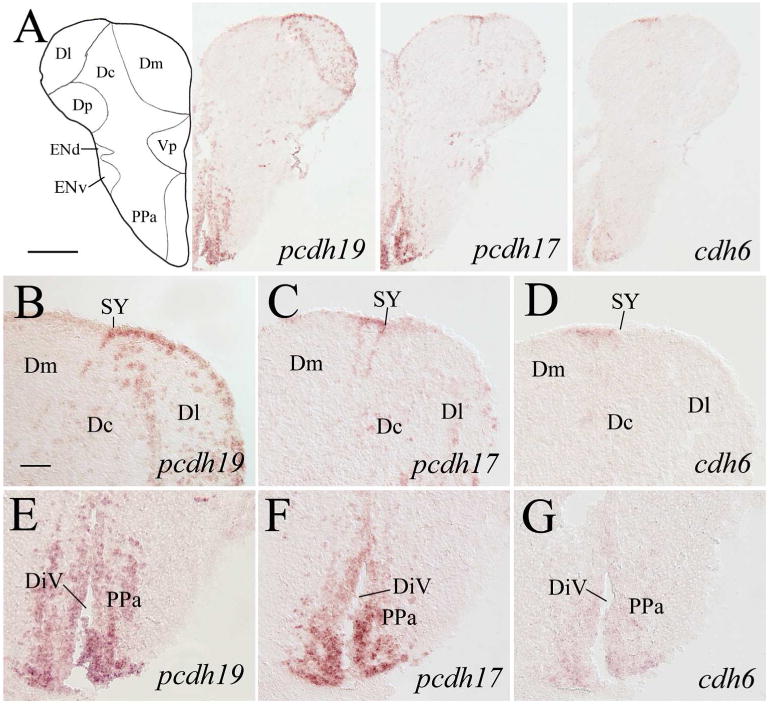
pcdh19, pcdh17 and cdh6 expression in the postcommissural telencephalon and anterior preoptic areas. Images in the top panels are low magnified views of adjacent brain sections from a level shown in Figure 1. B–D are higher magnifications of the dorsal telencephalon region adjacent to the sulcus ypsiloniformis (SY) shown in their respective top panels. E–G show magnified views of the ventral regions (part of the preoptic area) of their respective brain sections in the top panels. For other abbreviations, see the list. Scale bar = 200 μm for the top panels, 50 μm for the lower panels.
Figure 5.
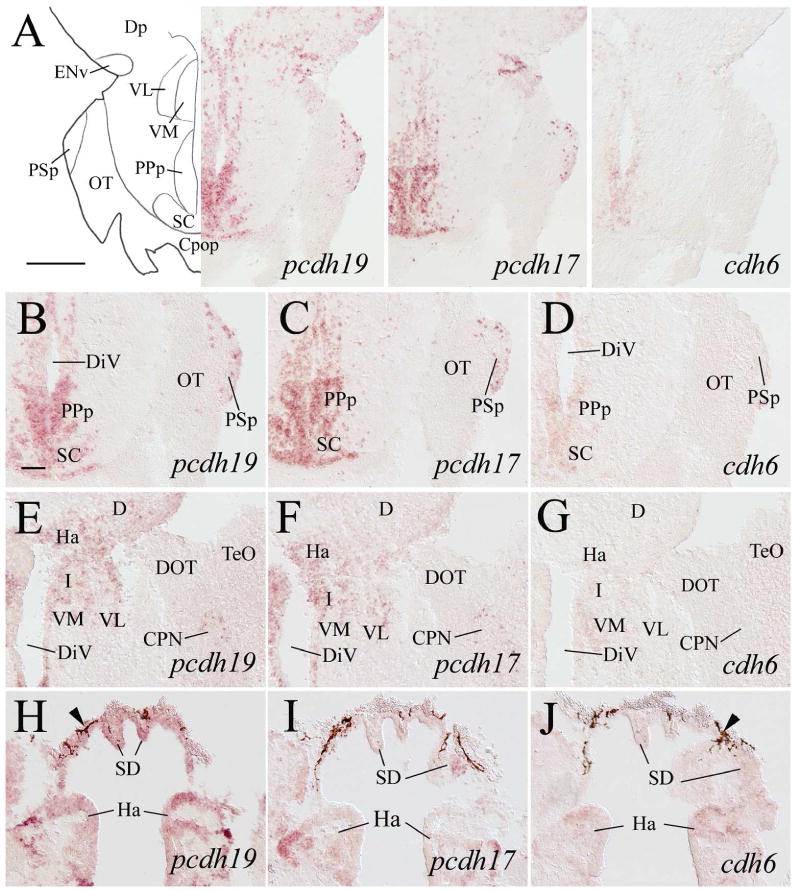
Expression of pcdh19, pcdh17 and cdh6 in the posterior preoptic areas, epithalamus, ventral thalamus, and pretectum. Top panel images show low magnifications of the brain from adjacent sections at a level indicated in Figure 1. B–D are higher magnifications of the posterior preoptic areas and the suprachiasmatic nucleus (SC) shown in the top pannels. The remaining panels are from sections 100–150 μm posterior to those shown in B–D, showing epithalamus and ventral thalamus. Arrowheads in H–J indicate pigmented epithelium. For other abbreviations, see the list. Scale bar = 200 μm for the top panels, 50 μm for the lower panels (B–J have the same magnification).
Preoptic region
In the preoptic region, intensely labeled pcdh19 cells in high density were found in the ventral portion of the anterior part of the parvocellular preoptic nucleus (PPa, Fig. 4E). pcdh17 expression in this area (Fig. 4F) was similar to pcdh19, while weakly labeled cdh6 expressing cells were also found in PPa (Fig. 4G). In the posterior part of the parvocellular preoptic nucleus (PPp), pcdh19 expressing cells were mainly found adjacent to the diencephalic ventricle (Fig. 5A left panel, 5B), which was similar to pcdh17 expression in this nucleus (Fig. 5A middle panel, 5C). As in PPa, cdh6 expression in PPp was weaker than the pcdhs (Fig. 5A right panel, 5D). Both pcdhs were also expressed in the suprachiasmatic nucleus (SC, Fig. 5B and C), whereas cdh6 expression in SC was much weaker (Fig. 5D).
Hypothalamus
Most pcdh19 expressing cells in the hypothalamus were located in periventricular regions such as the ventral zone of the periventricular nucleus (Hv) and lateral hypothalamus (LH), dorsal zone of the periventricular hypothalamus (Hd), and caudal zone of the periventricular hypothalamus (Hc) (Figs 6H, 7H, 8B). pcdh17 had a similar expression pattern as pcdh19 in these hypothalamic regions (Figs. 6I, 7I, 8C), except its expression in Hv and the anterior tuberal nucleus (ATN, Fig. 6I) was weaker than pcdh19 (Fig. 6H). Weak cdh6 expression was detected in Hd, Hv, LH and Hc (Figs. 7J, 8D), and no obvious labeling was seen in ATN (Fig. 7J).
Figure 6.
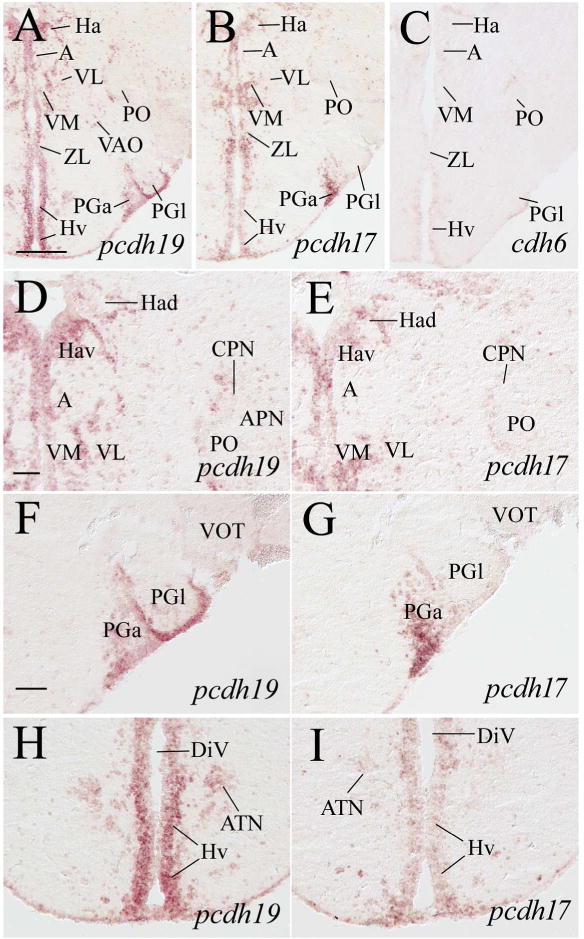
Expression of pcdh19, pcdh17 and cdh6 in habenular, pretectal, dorsal thalamic, ventral thalamic, anterior thalamic and preglomerular nuclei. Images in top panels show low magnifications of adjacent brain sections from a level shown in Figure 1. D and E are higher magnifications of the habenular, ventral thalamic and pretectal regions of their respective images in the top panels. F and G are higher magnifications of the preglomerular nuclei, while H and I are magnified views of the anterior hypothalamus shown in the top panels. See the list for abbreviations. Scale bar = 200 μm for the top panels, 50 μm for the lower panels (F–I have the same magnification).
Figure 7.
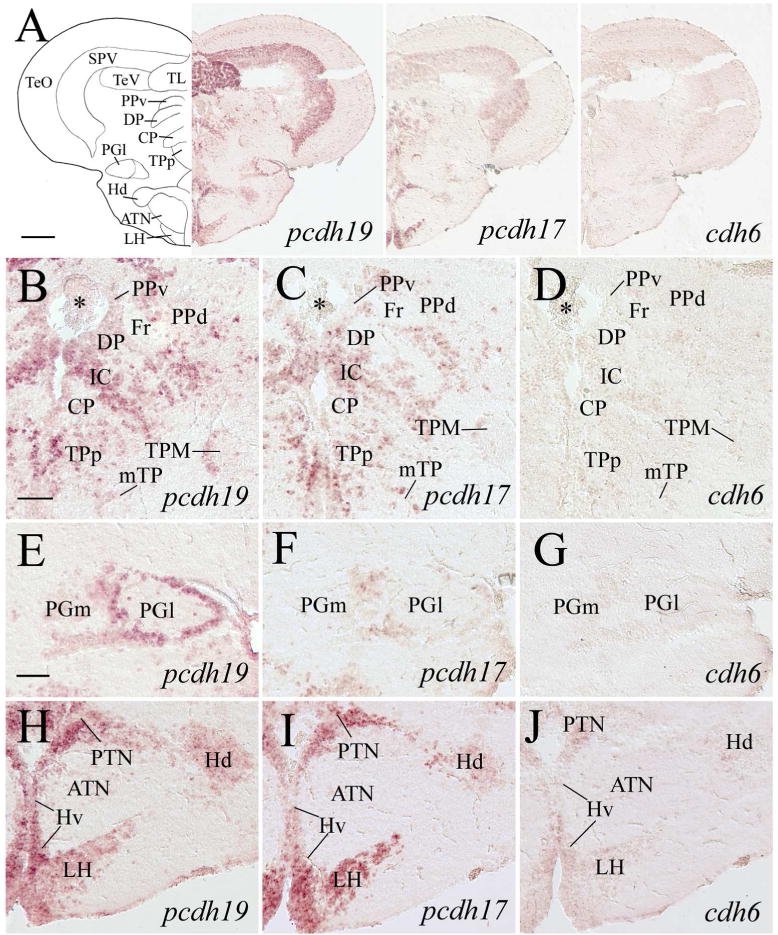
Expression of pcdh19, pcdh17 and cdh6 in the dorsal thalamus, pretectum, preglomerular nuclei, posterior tuberculum, hypothalamus and optic tectum. Images in the top panels show low magnifications of adjacent sections from a level shown in Figure 1. B–D are magnified views of the dorsal thalamus and periventricular pretectum from their respective images in the top panels. E–G show higher magnifications of the lateral preglomerular (PGl) and medial preglomerular (PGm) nuclei, while H–J are magnified views of the medial hypothalamus and posterior tuberculum shown in their respective top panels. Asterisks in B–D indicate clusters of cells in the diencephalic ventricle. For other abbreviations, see the list. Scale bar = 200 μm for the top panels, 50 μm for the lower panels (E–J have the same magnification).
Figure 8.
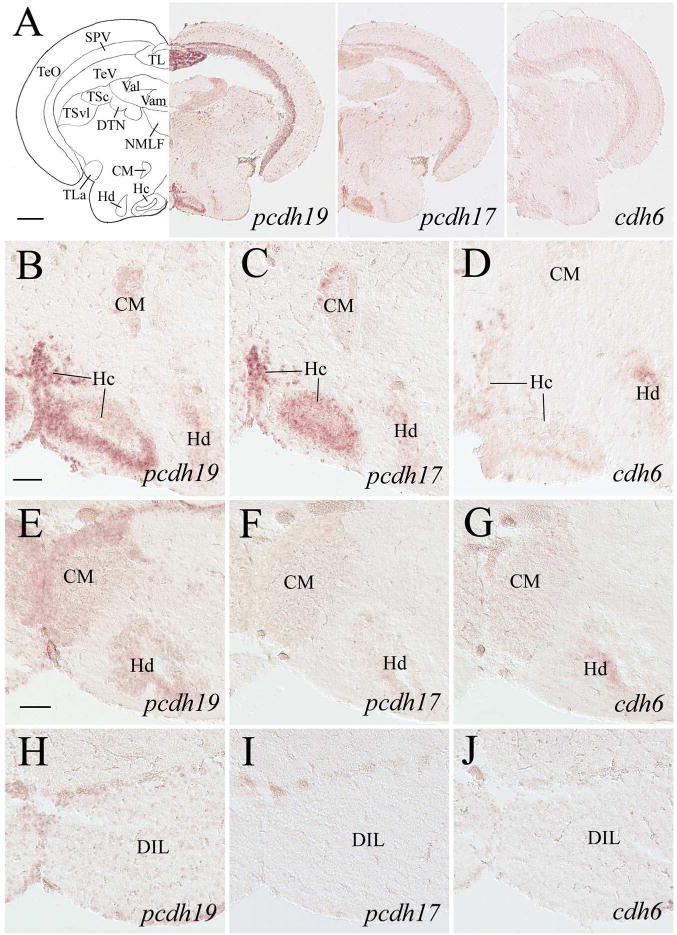
pcdh19, pcdh17 and cdh6 expression in the optic tectum, posterior tuberculum and hypothalamus. Top panels show low magnifications of sections from a level indicated in Figure 1. The section processed for cdh6 in situ hybridization was from a different fish showing similar hypothalamic areas. B–D show higher magnifications of the ventral posterior tuberculum and medial hypothalamus from their respective images in the top panels. E–J are higher magnifications of similar regions from sections posterior to those shown in the top panels: E–G are 100–150 μm posterior to B–D, while H–J are 100–150 μm posterior to E–G. See the list for abbreviations. Scale bar = 200 μm for the top panels, 50 μm for the remaining panels (B–J have the same magnification).
Diencephalon
The zebrafish diencephalon consists of epithalamus, dorsal thalamus, ventral thalamus, and posterior tuberculum (Wullimann et al., 1996). Structures in the epithalamus expressing pcdh19 and pcdh17 included the habenula (Ha) and dorsal saccus (SD) (Figs. 5E, 5F, 5H, 5I, 6D, 6E). cdh6 expression was also visible in these two structures (Fig. 5J). In the dorsal thalamus, pcdh19 and pcdh17 expression was found in the anterior thalamic nucleus (A, Fig. 6D and E), dorsal posterior thalamic nucleus (DP), intercalated nucleus (IC, Mueller and Guo, 2009), and central posterior thalamic nucleus (CP) (Fig. 7B and C). Expression of both pcdhs in IC was strong, and there appeared to be more pcdh19 expressing cells in these nuclei than pcdh17 expressing cells. cdh6 expression in A was barely detectable (Fig. 6C), while no obvious cdh6 expression was observed in DP, IC or CP (Fig. 7D). Regions in the ventral thalamus that expressed pcdh19 and pcdh17 included the intermediate thalamic nucleus (I, Fig. 5E and F), ventromedial (VM) and ventrolateral (VL) nuclei (Fig. 6A, B, D and E). cdh6 expression was barely detectable in VM (Fig. 5G), while there was no cdh6 expression seen in VL (Figs. 5G). In the posterior tuberculum, pcdh19 expressing cells were found in the periventricular nucleus of the posterior tuberculum (TPp), migrated nucleus of the posterior tuberculum (mTP, Mueller and Guo, 2009), posterior tuberal nucleus (PTN), anterior, lateral and medial preglomerular nuclei (PGa, PGl and PGm, respectively) (Figs. 6A, 6F, 7A, 7B, 7E 7H, 9D), tertiary gustatory nucleus (TGN, Fig. 9D), pretectomammillary tract and nucleus (TPM, Fig. 7B) and corpus mamillare (CM) (Fig. 8B and E). pcdh17 expression was also detected in these areas, but its expression was weaker in staining intensity and/or in fewer cells than pcdh19 expression in most of the structures (Figs. 6B, 6G, 7A, 7C, 7F, 7I), especially in PGl and CM. There was little or no cdh6 expression in the posterior tuberculum, except in PGl and PTN (Figs. 6C, 7D, 7G, 7J, 8D, 8G and 9F).
Figure 9.
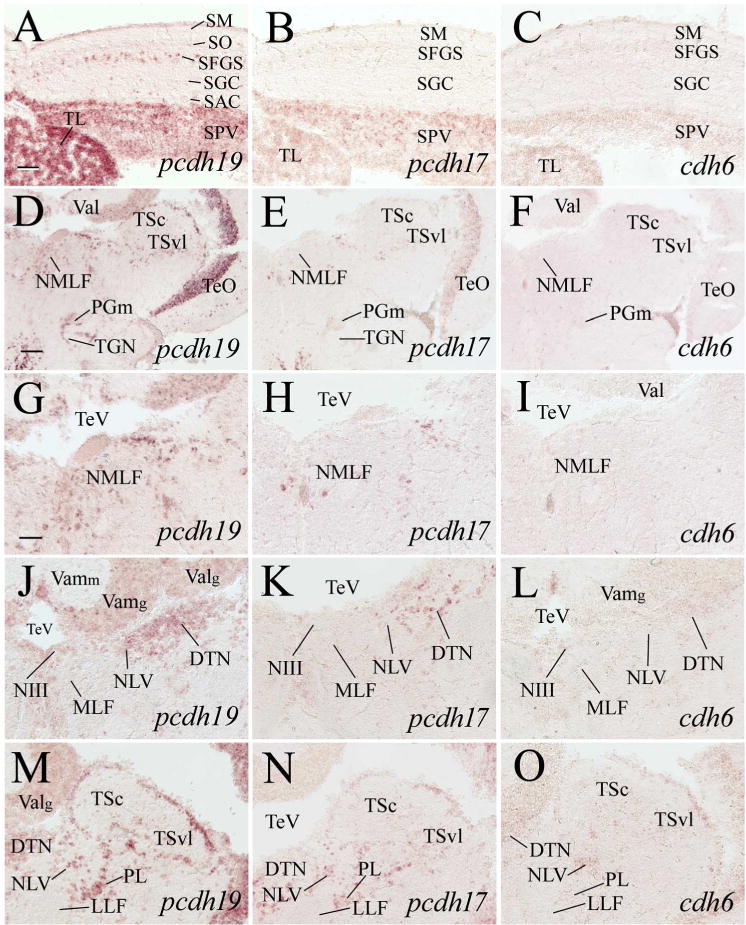
Expression of pcdh19, pcdh17 and cdh6 in the optic tectum, dorsal tegmentum, isthmus and cerebellar valvula. A–C are higher magnifications of adjacent sections of the medial optic tectum from images shown in the top panels in Figure 7. D–F are low magnified views of dorsal tegmenal region of adjacent sections at a level shown in Figure 1. G–I are higher magnifications of the nucleus of medial longitudinal fascicle (NMLF) of their respective images in D–F. J–O are magnified views of the dorsal tegmentum and isthmus from sections posterior (120–150 μm) to D–F, with J–L showing the medial region, while M–O showing the lateral region. See the list for abbreviations. Scale bar = 100 μm for D–F, 50 μm for the remaining panels (G–O have the same magnification).
pcdh19 was detected in most of the pretectal nuclei including the parvocellular superficial pretectal nucleus (PSp, 5B), central pretectal nucleus (CPN, Fig. 5E), ventral accessory optic nucleus (VAO, Fig. 6A), accessory pretectal nucleus (APN, Fig. 6D), posterior pretectal nucleus (PO, Fig. 6D), dorsal and ventral parts of the periventricular nucleus (PPd and PPv, respectively, Fig. 7B). However, there were only a few labeled cells in these structures. pcdh17 expression in the pretectum was similar to pcdh19, except with less expression in PPv and no pcdh17 expression in VAO (Figs. 5C, 5F, 6B, 6E and 7C). cdh6 expression in the pretectum was limited to a few cells located in the dorsomedial PO (Figs. 5D, 5G, 6C, 7D). In zebrafish, the nucleus of the medial longitudinal fascicle (NMLF), like the pretectum, is derived from the prosomere one (Wullimann and Puelles, 1999; Mueller and Guo, 2009). NMLF contained many pcdh19 expressing cells (Fig. 9G). There were only a few pcdh17 expressing cells in NMLF (Fig. 9H), and no cdh6 expression was detected in this nucleus (Fig. 9I).
Mesencephalon
The zebrafish mesencephalon is organized similarly to most other nonmammalian vertebrates, consisting of dorsally localized optic tectum and ventrally situated torus semicircularis and tegmentum (Wullimann et al., 1996). The optic tectum (TeO) is a well-laminated structure containing six layers (from surface toward the tectal ventricle): stratum marginale (SM), stratum opticum (SO), stratum fibrosum et griseum superficiale (SFGS), stratum griseum centrale (SGC), stratum album centrale (SAC) and stratum periventriculare (SPV) (Vanegas, 1983). pcdh19 was strongly expressed in SPV throughout the tectum (Figs. 7A and 8A left panels, 9A, 11A left panel). Closer examination of the optic tectum revealed that most cells in SPV were pcdh19 expressing (Fig. 9A). Many cells in SFGS were also labeled, and both SGC and SAC contained scattered pcdh19 expressing cells (Fig. 9A). Like pcdh19, pcdh17 was also expressed throughout the optic tectum (Figs. 7A and 8A middle panels, 9B, 11A middle panel), and its expression in SPV was almost uniform (Fig. 9B). But unlike pcdh19 expression in SPV, pcdh17 staining in this layer was apparently weaker. Moreover, there was little or no pcdh17 expression in the other tectal layers (Fig. 9B). cdh6 expression in the tectum was similar to pcdh17, except it was weaker (Fig. 9C).
Figure 11.
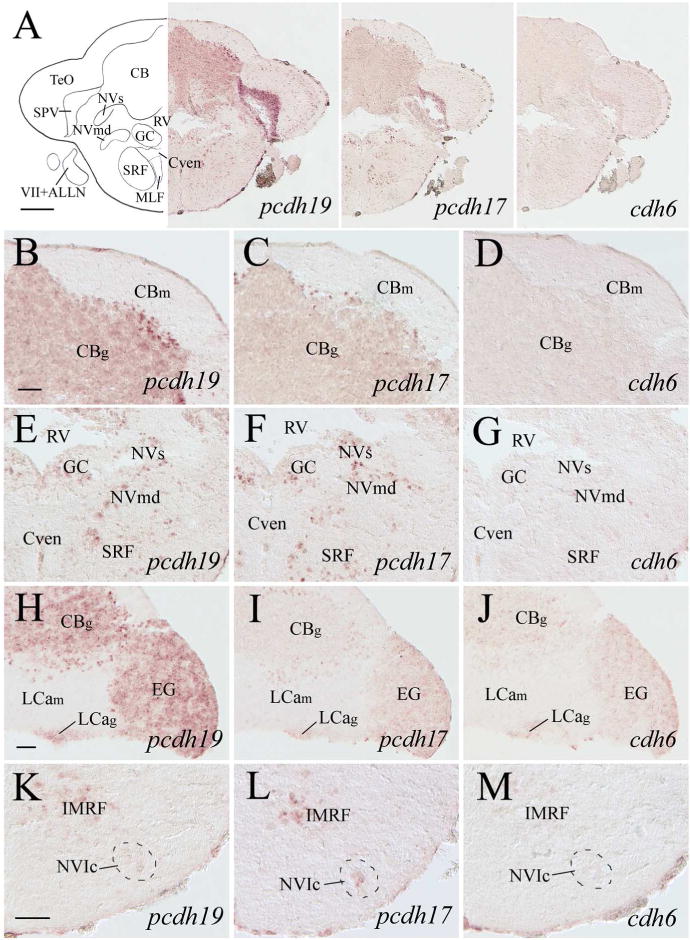
pcdh19, pcdh17 and cdh6 expression in the cerebellum and anterior medulla oblongata. Images at the top panels show low magnified views of cerebellar body (CB) and anterior medulla of adjacent sections from a level shown in Figure 1. B–D are higher magnifications of the dorsal half of the CB, while E–G are higher magnified views of the dorsomedial medulla of their respective images shown in the top panels. H–J show higher magnifications of the cerebellum from adjacent sections located 120–170 μm posterior to A–G. K–M are higher magnifications of the ventral medulla of adjacent sections from the same level as H–J. For other abbreviations, see the list. Scale bar = 200 μm for the top panels, and 50 μm for the remaining panels (B–G have the same magnification).
pcdh19 expression in the torus longitudinalis (TL) was stronger than its expression in most other regions of the zebrafish brain, and its expression appeared to be uniform (cells in the periphery and deeper regions were similarly stained) in this structure (Figs. 9A). pcdh17 expression in TL (Fig. 9B) was similar to its expression in SPV in that the expression was uniform and there was no obvious difference in the staining intensity between these two structures. Like pcdh19, cdh6 was also expressed in TL, and its staining in TL appeared to be stronger than its staining in most other brain regions (Fig. 9C).
The torus semicircularis (TS) of zebrafish consists of the central nucleus (TSc) and ventrolateral nucleus (TSvl) (Wullimann et al., 1996). Most pcdh19 expressing cells in TSc were located mainly in the cortical region where most cell bodies of the nucleus are localized, while pcdh19 expression in TSvl was found in both the cortical and central parts of the nucleus (Figs. 9M, 10G and 10M). There was little or no pcdh17 expression in the cortical region of TSc, and its expression in both the cortical and deeper regions of TSvl was weak (Figs. 9N, 10H and 10N). cdh6 expression was similar to pcdh17 in these two nuclei (Figs. 9O, 10I and 10O). The remaining mesencephalic structures that contained pcdh19 expressing cells included the dorsal tegmental nucleus (DTN) and oculomotor nucleus (NIII) (Fig.9J). pcdh17 expression was detected in DTN, but not in NIII (Fig. 9K), while there was no obvious cdh6 expression in either nuclei (Fig. 9L).
Figure 10.
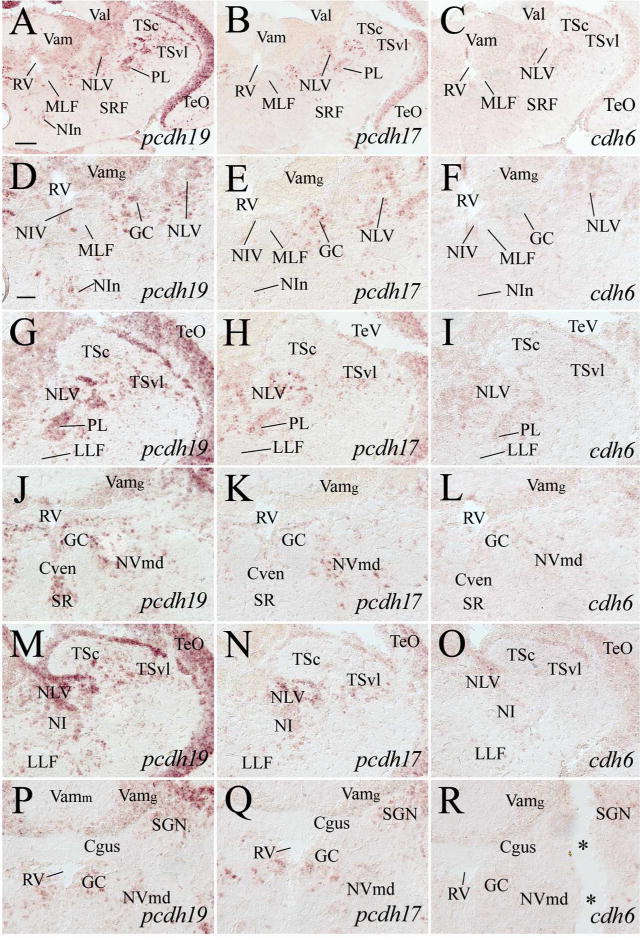
Expression of pcdh19, pcdh17 and cdh6 in the tegmentum, isthmus cerebellar valvula and anterior medulla. A–C are from adjacent sections from a level indicated by Figure 1. D–F are magnified views of the centromedial region, while G–I are higher magnifications of the dorsolateral region of their respective images in the top panels. J–L and M–O show similar respective regions from sections posterior (120–160 μm) to those shown in D–I. P–R are higher magnifications of similar areas shown in J–L, but from sections 30–50 μm posterior to J–L. The two asterisks in R indicate a large artificial crack in the tissue. See the list for abbreviations. Scale bar = 100 μm for A–C, 50 μm for the remaining panels (D–R have the same magnification).
Isthmus, rhombencephalon and spinal cord
Structures in the isthmus containing pcdh19 expressing cells included the griseum centrale (GC, Figs. 10D, 10J, 11E), interpeduncular nucleus (NIn, Fig. 10D), nucleus isthmi (NI, Fig. 10M), lateral valvular nucleus (NLV, Figs. 9J, 9M, 10D, 10G, 10M), perilemniscal nucleus (PL, Figs. 9M, 10G), secondary gustatory nucleus (Fig. 10P), superior raphe (Fig. 10J), trochlear nucleus (NIV, Fig. 10D), and nucleus of the lateral lemniscus (NLL, data not shown). pcdh17 expression was also detected in the majority of these nuclei (Figs. 9N, 10B, 10E, 10H, 10N, 10Q, 11F), but its expression domains were smaller and/or its staining intensity was not as strong as pcdh19. Moreover, pcdh17 was not detected in NIn (Fig. 10E), NIV (10E) and SR (Fig. 10K). Weak cdh6 expressing cells in this region were found mainly in GC, NLV, PL and SGN (Figs. 9O, 10C, 10I, 10L, 10R).
The cerebellum can be divided into three parts: 1) the vestibulolateral lobe containing the medial caudal lobe (LCa) and the paired lateral granular eminence (EG), 2) the cerebellar body (CB), and 3) the cerebellar valvula including the medial part (Vam) and lateral part (Val) (Wullimann et al., 1996). pcdh19 was expressed in all the three parts of the cerebellum, but its expression was limited to the granular regions of these structures (Figs. 9D, 9J, 10A, 10D, 10P, 11B, 11H, 12A left panel). Moreover, some cells (putative Purkinje cells) at the border between the granular and molecular layers of CB exhibited more intense labeling, and these cells were clustered in the lateral region (Fig. 11B). pcdh17 expression in the cerebellum was somewhat similar to pcdh19 in that it was detected in both CB and EG, it was mainly confined to the granular regions, and stronger labeled cells were observed at the border between the granular and cellular layers of CB (Figs. 11C, 11I, 12A middle panel). But pcdh17 expression in the cerebellum was different from pcdh19 expression in Val and Vam where there was little or no pcdh17 (Fig. 10B, E, K and Q), and pcdh17 expression in EG and the granular layer of CB (Figs. 11C, 11I, 12A middle panel) was weaker than pcdh19 (Figs. 11B, 11H, 12A left panel). cdh6 expression in the cerebellum was mainly limited to EG (Fig. 11D and J) and the granular layer of LCa (Figs. 11J, 12A right panel).
Figure 12.
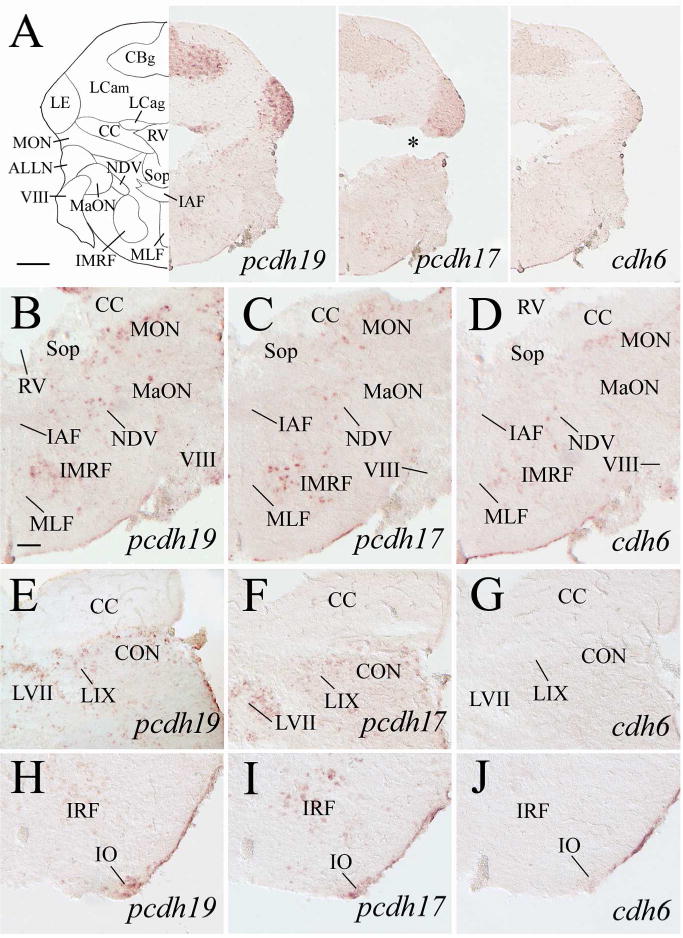
Expression of pcdh19, pcdh17 and cdh6 in the cerebellum and medulla oblongata. Top panels show lower magnifications of adjacent sections from a level shown in Figure 1. B–D are higher magnified views of ventral halves of their respective images in the top panels. E–J are from sections 200–250 μm posterior to A. E–G show magnified views of cerebellar crest (CC) and dorsal medulla, while H–J are magnified views of the ventral medulla. The asterisk in A (middle panel) indicates an artificial crack in the tissue section. For other abbreviations, see the list. Scale bar = 200 μm for the top panels, and 50 μm for the remaining panels (B–J have the same magnification).
Nuclei of the six cranial nerves (V to X) and the anterior and posterior lateral line nerves (ALLN and PLLN, respectively) are located in the zebrafish medulla oblongata (Wullimann et al., 1996). pcdh19 expressing cells were found in the sensory and motor nuclei of the trigeminal nerve (NVs and NVm, respectively, Figs. 10J, 11E) and nucleus of the descending trigeminal root (NDV, Fig. 12B), the caudal part of the abducens nucleus (NVIc, Fig. 11K). The facial lobe (LVII, facial sensory nerve terminal site, Wullimann et al., 1996; Figs. 12E, 13B) and the magnocellular octaval nucleus (MaON), one of the cranial nerve VIII sensory nuclei (Wullimann et al., 1996) also contained a few pcdh19 expressing cells (Fig. 12B). In addition, pcdh19 was expressed in the glossopharyngeal lobe (LIX, Fig. 12E) and vagal lobe (LX, Fig. 13B and H) that receive sensory inputs from the IX and X cranial nerves, respectively (Wullimann et al., 1996). Moreover, the vagal motor nucleus (NXm) also contained pcdh19 expressing cells (Fig. 13B and H). Both the medial and caudal octavolateralis nuclei (MON and CON, respectively), sensory nuclei related to the lateral line nerves in zebrafish (Wullimann et al., 1996), had many pcdh19 expressing cells (Fig. 12B and E). Additional structures in the medulla oblongata that showed pcdh19 expression included the inferior olive (mainly in more anterior portion, Fig. 12H), secondary octaval population (Sop, only a few scattered cells, Fig. 12B), medial funicular nucleus (MFN, Fig. 13H, 14B), commissural nucleus of Cajal (only a few scattered cells, Fig. 14B), a ventromedial region adjacent to the ventral funiculus (Fv) in the posterior medulla (Figs. 13L, 14E), and reticular formation (Figs. 11E, 11K, 12B, 13E, 14E). pcdh17 expression was detected in all of the above mentioned medullary structures (Figs. 10K, 11F, 11L, 12C, 12F, 12I, 13C, 13F, 13I, 13M), except MaON and Sop (Fig. 12C). Moreover, pcdh17 expression in the reticular formation was somewhat similar to pcdh19 at some levels (e.g. Fig. 12B and C), but different at other levels (e.g. Fig. 12H and I). Compared to the pcdh19 and pcdh17 expression in the medulla, cdh6 expression was mainly limited to the following structures: NDV (Fig. 12D), NVmd (Fig. 11G), MON (Fig. 12D), LX (Fig. 13D), the ventromedial region adjacent to Fv (Fig. 13N) and reticular formation (Fig. 12D). As in other brain areas, cdh6 expression in these regions was weaker and/or in fewer cells compared to pcdh19 or pcdh17.
Figure 13.
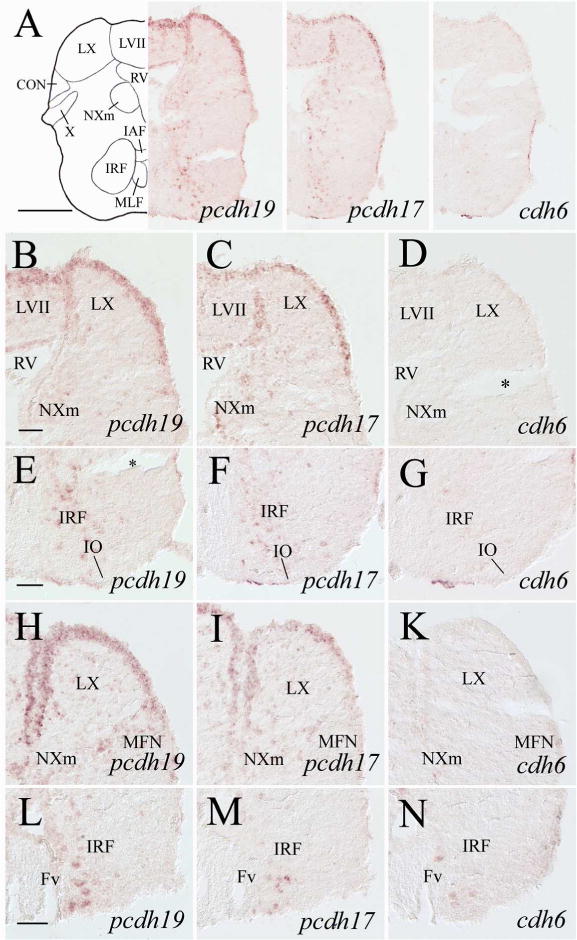
pcdh19, pcdh17 and cdh6 expression in the medulla oblongata. Top panels show low magnifications of adjacent sections from a level shown in Figure 1. B–D are higher magnified views of the dorsal halves, while E–G are ventral portions of their respective images in the top panels. H–N are from sections 200–250 μm posterior to A, with H–K showing magnified views of the dorsal medulla, while L–N showing the ventral medulla. Asterisks in D and E indicate artificial cracks in the sections. See the list for abbreviations. Scale bar = 200 μm for the top panels, 50 μm for the remaining panels (E–K have the same magnification).
Figure 14.
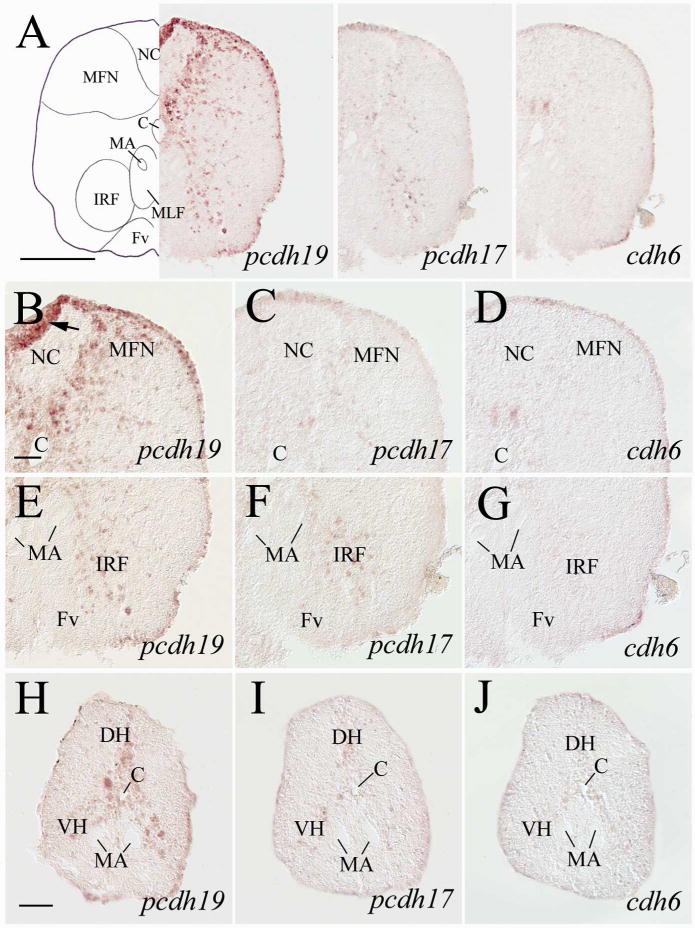
Expression of pcdh19, pcdh17 and cdh6 in the posterior medulla and anterior spinal cord. Top panels show lower magnifications of adjacent sections from a level shown in Figure 1. B–D are higher magnifications of the dorsal regions, while E–G are higher magnifications of the ventral regions of their respective images in the top panels. H–J are adjacent sections from the spinal cord at the cervical level. The arrow in B indicates a fold in the tissue. See the list for abbreviations. Scale bar = 200 μm for the top panels, 50 μm for the remaining panels.
In the spinal cord, pcdh19 expression was detected in the dorsal horn (DH), ventral horn (VH) and regions surrounding the central canal (Fig. 14H). pcdh19 expressing cells in DH (putative interneurons) were located along the midline. The labeled cells on both sides of the central canal and those lateroventral to the Mauthner axons are likely spinal cord visceromotor and somatomotor neurons, respectively (Mueller et al., 2004). pcdh17 expression in the spinal cord was found in a few weakly labeled cells in similar regions (Fig. 14I), while cdh6 expression in the spinal cord was limited to a couple of weakly stained cells lateral to the central canal (Fig. 14J).
Discussion
Comparison of expression of pcdh19, pcdh17 and cdh6 in adult zebrafish brain with their expression in other vertebrate brains
There are numerous reports on expression of these cadherins in embryonic vertebrate CNS (Wohrn et al., 1998, 1999; Redies et al., 2001; Becker and Redies, 2003; Luo et al., 2004; Gaitan and Bouchard, 2006; Liu et al., 2006; Emond et al., 2009; Tai et al., 2010; Liu et al., 2010; Terakawa et al., 2013), but only a few on their distribution in the brain of adult vertebrates (Dean et al., 2007; Kim et al., 2007; Hertel et al., 2008, 2012; Hertel and Redies, 2011; Stoya et al., 2014). Moreover, studies on their expression in the adult brains focus mainly on a subset of brain structures (e.g. the basal ganglia, Hertel et al., 2008). In the following section, expression of pcdh19, pcdh17 and cdh6 in the adult zebrafish brain is compared to their expression in adult brains of other vertebrates (if the information is available). Otherwise, the zebrafish data is compared to their expression in the brain of developing vertebrates.
pcdh17 expression in the olfactory bulb of adult zebrafish (in the glomerular layer, and external cellular layer that contains mitral cells) was somewhat similar to that of postnatal day 3 (P3) rats, with pcdh17 expressing cells found in multiple layers including the glomerular and mitral cell layers (Kim et al., 2007). However, pcdh19 expressing cells in the P3 rat olfactory bulb were limited to a narrow mitral cell layer (Kim et al., 2007), which is different from pcdh19 expression in the adult zebrafish olfactory bulb where labeled cells have a wider distribution (Fig. 2E). There is no obvious cdh6 expression in the fish olfactory bulb, although it is observed in the olfactory bulb of developing mouse (Akins et al., 2007).
In developing and adult mice and rats, pcdh17 and pcdh19 are detected in most cortical regions, basal ganglia, amygdale and/or hippocampus (Kim et al., 2007; Hertel et al., 2008; Hertel and Redies, 2011; Stoya et al., 2014). Both pcdhs are found in zebrafish dorsal telencephalon (pallium). Interestingly, the ventromedial part of the medial zone of the dorsal telencephalon (Dm), topologically corresponding to the mouse amygdala (Mueller et al., 2011), is strongly labeled with both pcdh19 and pcdh17 cRNA probes (Fig. 3B and C). The dorsolateral telencephalon (Dl), topologically corresponding to the mouse hippocampus (Mueller et al., 2011), contains many pcdh19 expressing cells (Fig. 3E). But there is little cadherin expression in the central zone of the dorsal telencephalon (Dc), topologically corresponding to the mouse cortex (Mueller et al., 2011). Both pcdhs are strongly expressed in zebrafish dorsal, central and ventral nuclei of the ventral telencephalic area (Vd, Vc and Vv, respectively, Fig. 3H and I). Vd and Vc are viewed as the fish striatal formation, while Vv as part of the septal formation (Wullimann and Mueller, 2004). Our findings about differential cadherin expression by ventricular cells adjacent to the sulcus ypsiloniforms (SY) (Fig. 4B–D), and the apparent stronger pcdh19 expression in the border region of Dl and Dc (Fig. 4A left panel), provide additional support for the existence of the distinct subdivisions in the zebrafish dorsal telencephalon (Wullimann et al., 1996, Mueller et al., 2011).
pcdh19 and pcdh17 expression in the zebrafish preoptic area, diencephalon and mesencephalon is also somewhat similar to their expression in similar brain regions in P3 rats (Kim et al., 2007) in that labeled cells are detected in the preoptic nuclei (e.g. suprachiasmatic nucleus), ventromedial thalamus and hypothalamus, pretectum, and optic tectum (superior and inferior colliculi in the rat). Moreover, expression of both pcdhs in the anterior and medial hypothalamus of both fish and rat is strong. Additionally like the zebrafish, pcdh19 expressing cells are also detected in the optic tectum of embryonic chicken (Tai et al., 2010).
Compared to pcdh19 and pcdh17 expression in the adult zebrafish brain, expression of cdh6 in the brain is restricted to fewer regions and/or greatly reduced in staining intensity. This is unlikely due to any deficiency of the cdh6 cRNA probe, because the same probe labeled strongly in embryonic zebrafish tissues (Liu et al., 2006, 2012), and in regenerating adult zebrafish retina (Liu et al., unpublished observation). Expression of cdh6 in the adult zebrafish brain was also confirmed using RT-PCR experiments (Liu et al., unpublished observation). Moreover, reduced expression of classical cadherins in adult zebrafish CNS has been observed for cadherin-2, cadherin-4 (Liu et al., 1999, 2001) and cadherin-7 (Liu unpublished observation). It will be interesting to see if this holds true (reduced expression in adult CNS) for other classical cadherins (e.g. cadherin-8, cadherin-10), while expression of other non-clustered pcdhs (e.g. pcdh9, pcdh10) remains strong in the adult CNS. Like other developing vertebrates (works before 2003 are reviewed in Redies et al., 2003; Becker and Redies, 2003; Luo et al., 2004; Inoue et al., 2009; Matsunaga et al., 2011; Terakawa et al., 2013), cdh6 is widely expressed in the diencephalon, mesencephalon and rhombencephalon of embryonic zebrafish (see below), although in general its expression in these brain regions is limited in the fish embryo, and even more restricted in the adult fish brain.
Comparison of expression of pcdh19, pcdh17 and cdh6 in adult zebrafish brain with their expression in developing zebrafish brains
Expression of pcdh19 and pcdh17 in the adult zebrafish brain is similar to that in developing zebrafish brain (Biswas and Jontes, 2009; Emond et al., 2009; Liu et al., 2009, 2010) in that their expression is widespread and the staining signals are generally strong. In both developing and adult zebrafish, pcdh19 and pcdh17 are expressed in the telencephalon, anterior hypothalamus diencephalon, optic tectum, cerebellum and medulla oblongata. Unlike the widespread pcdh19 and pcdh17 expression in both the developing and adult brains, cdh6 expression in the developing (1–2 day old, Liu et al., 2006) and adult zebrafish brains is restricted to much smaller domains. Similar to the adult fish brain, cdh6 is expressed by ventricular cells in the embryonic telencephalon, located in anterior dorsal regions. In the embryonic diencephalon, cdh6 expressing cells are mainly found in the epithalamus and a vertical stripe of tissue in the hypothalamus. Similarly in the adult brain, cdh6 is found in the epithalamus and in limited ventricular regions in the hypothalamus. cdh6 expression in the embryonic cerebellum and medulla is mainly limited to dorsolateral surface areas, which is also somewhat similar to its expression in the adult hindbrain (e.g. in limited granular regions of the cerebellum, and vagal lobes in the dorsal medulla). The major difference in cdh6 expression between the developing and adult brains is the staining intensity, with intense signals in the embryonic brain but weak labeling in the adult brain.
pcdh19 and pcdh17 expression in sensory systems
Our results show that prominent expression of both pcdh19 and pcdh17 is detected in most of the sensory systems (summarized in Table 1). Interestingly, pcdh19 and/or pcdh17 expressing cells are usually found in multiple structures and/or at several levels of each sensory system. In the olfactory system, pcdh19 and pcdh17 expressing cells are found both in the olfactory bulbs and their major brain targets, the dorsal and ventral nuclei of the ventral telencephalic area (Vd and Vv), and dorsoposterior zone of the telencephalon (Dp, Wullimann et al., 1996). In the visual system, expression of pcdh19 and pcdh17 is observed in the retina (Liu et al., unpublished observation) and the optic tectum, the major visual center of the fish brain. In addition to being expressed by most cells in the stratum periventriculare (SPV) of the optic tectum, pcdh19 expressing cells are also seen in the stratum fibrosum et griseum superficiale (SFGS) where the majority of retinal axons terminate in most teleost fishes (Vanegas, 1983). The zebrafish visual system also contains two ascending pathways, retina- anterior thalamic nucleus (A)-telencephalon, and retina-optic tectum-dorsal posterior thalamic nucleus (DP)-telencephalon, that resemble the geniculate and extrageniculate visual systems of mammals (Braford and Northcutt, 1983; Wullimann et al., 1996). pcdh19 and pcdh17 are expressed in all the above mentioned visual structures (Table 1).
TABLE 1.
Expression of pcdh19, pcdh17 and cdh6 in Sensory Systems
| pcdh19 | pcdh17 | cdh6 | |
|---|---|---|---|
| Olf. Sys. | |||
| Dp | ++ | + | − |
| Ob | ++ | ++ | − |
| Vd | ++ | ++ | − |
| Vv | +++ | +++ | − |
| Vis. Sys. | |||
| A | + | + | +/− |
| APN | + | + | − |
| CPN | + | + | − |
| Dl | ++ | + | +* |
| DP | +++ | ++ | − |
| I | ++ | ++ | +/− |
| NI | + | + | +/− |
| PPd/PPv | ++ | + | − |
| PPp | ++ | ++ | +/− |
| PSp | + | + | − |
| SC | ++ | ++ | − |
| TeO | +++ | ++ | + |
| VAO | + | − | − |
| VL | + | + | − |
| Aud. Sys. | |||
| CP | +++ | ++ | − |
| EG | +++ | ++ | + |
| MaON | + | + | − |
| Sop | + | − | − |
| TSc | +++ | + | + |
| Lat. Line Sys. | |||
| CON | ++ | + | − |
| EG | ++ | ++ | + |
| MON | +++ | + | +/− |
| PGl | +++ | + | +/−* |
| TSvl | +++ | + | + |
| Dl | ++ | + | +* |
| Dm | + | ++ | +* |
| Gen. visc. and Gus. Sys. | |||
| Dm | +++ | +++ | + |
| LVII | +++ | ++ | +/− |
| LIX | ++ | + | − |
| LX | +++ | +++ | + |
| MFN | ++ | + | − |
| NC | + | − | − |
| SGN | ++ | ++ | + |
| TGN | ++ | + | − |
| Somato. Sys. | |||
| VM/VL/DP | ++ | ++ | +/− |
| MFN | ++ | ++ | − |
| NDV | ++ | ++ | + |
| NVs | +++ | +++ | +/− |
Staining intensities are indicated by the number of plus signs: +, weak; ++, moderate; +++, strong. Minus sign means no labeling detected. +/− indicates that the labeling is barely detectable. Asterisks indicate that the staining is limited to superficial regions. Abbreviations: aud. sys., auditory system; Ge. visc. and gus. sys., general visceral and gustatory systems; lat. line sys., lateral line system; olf. sys., olfactory system; somato. sys., somatosensory system; vis. sys., visual system.
In the teleost auditory system, the octaval nerve projects to numerous brain targets including the magnocellular octaval nucleus (MaON) and descending octaval nucleus (DON) (Wullimann et al., 1991). DON sends axons to the secondary octaval population (Sop) and the central nucleus of the torus semicircularis (TSc), which in turn project to the central posterior thalamic nucleus (CP) (McCormick and Hernandez, 1996; Wullimann et al., 1996). pcdh19 and pcdh17 expressing cells are observed in most of these nuclei (Table 1). pcdh19 and pcdh17 are also detected in the lateral line circuit that mediate mechanoreception: medial and caudal octavolateralis nuclei (MON and CON)-ventrolateral nucleus of the torus semicircularis (TSvl)-lateral preglomerular nucleus (PGl)-dorsal telencephalon (Dm and Dl) (Wullimann et al., 1996). The gustatory system in fish is highly developed, with many structures involved in conducting and processing taste information (Morita et al., 1980; Finger, 1983; Kanwal and Caprio, 1987; Puzdrowski, 1987). These structures include the facial (LVII), glossopharyngeal (LIX) and vagal lobes (LX), medial funicular nucleus (MFN), secondary gustatory nucleus (SGN), tertiary gustatory nucleus (TGN) and dorsomedial telencephalon (Dm), all of these structures contain pcdh19 and pcdh17 expressing cells (Table 1).
pcdh19, pcdh17 and/or cdh6 expressing structures involved in sensory information processing also reside in the cerebellum. The teleost vestibulolateral lobe (consisting EG and LCa) and cerebellar body (CB) have similar connections and functions as their homologs in most other vertebrates (Wullimann et al., 1996). EG and LCa receive vestibular and lateral line (mechanoreception) inputs from the octaval nerve and lateral line nerve. Climbing fibers from the inferior olive (IO) and mossy fiber-like inputs from MON and reticular formation project to CB. Visual related pcdh19 and pcdh17 expressing structures in other parts of the brain (e.g. CPN, PPd, NI and VAO), in addition to projecting to the optic tectum, also send inputs to the CB (Wullimann et al., 1996).
pcdh19 and pcdh17 expression in the motor and premotor systems
Compared to the widespread expression of these two pcdhs in the sensory structures, their expression in the motor control related structures is limited. Motor nuclei of several cranial nerves contain pcdh19 and/or pcdh17 expressing cells. These nuclei include the nucleus of the medial longitudinal fascicle (NMLD), oculomotor nucleus (NIII), trochlear nucleus (NIV), trigeminal motor nucleus (NVm), caudal part of the abducens nucleus (NVIc), and the vagal motor nucleus (NXm). Other pcdh19 and/or pcdh17 expressing structures implicated in the control of movement include the superior raphe nucleus (SR), nucleus of the lateral lemniscus (NLL), reticular formation and motor neurons in the spinal cord.
The adult zebrafish torus longitudinalis (TL) is the structure where some of the most intensely labeled pcdh19 expressing cells are located, and it also contains both pcdh17 and cdh6 expressing cells (Figs. 7–10). Tract-tracing studies in teleosts reveal that TL is reciprocally connected with the optic tectum and cerebellum, and receives inputs from the pretectum and tegmentum (Wullimann, 1994; Ikenaga et al., 2002; Folgueira et al., 2007). Interestingly, the dorsal tegmental nucleus (DTN) and the lateral valvular nucleus (NLV), both projecting to (via mossy fibers) TL, also contain strong pcdh19 expressing cells and send a collateral mossy fiber input to the cerebellum (Wullimann, 1994). It is suggested that TL may provide a link in premotor circuitry descending from telencephalon to brain stem (Wullimann, 1994).
Conclusions
This study presents a comprehensive and detailed expression of pcdh19 and pcdh17, two δ-pcdhs, and cdh6, a classical cadherin, in the entire brain of adult zebrafish. Each cadherin exhibits a distinct expression pattern in the fish brain, with both pcdh19 and pcdh17 expression widespread, strong and overlapping, while cdh6 expression much limited in space and weaker in staining intensity. Expression of pcdh19 and pcdh17 in many structures of multiple sensory systems in the adult fish brain suggests that they are involved in the maintenance and normal function of these systems. Findings from this study, together with information from future studies examining expression of these cadherins in regenerating adult zebrafish CNS will set the stage for investigating their roles in normal and regenerating adult CNS.
Acknowledgments
This research was supported by NIH EY13879 (Q. Liu). S. Bhattarai, N. Wang and A. Sochacka were supported by teaching assistantships from the University of Akron.
This study is supported by NIH EY13879 (QL)
Abbreviations
- A
anterior thalamic nucleus
- ALLN
anterior lateral line nerves
- APN
accessory pretectal nucleus
- ATN
anterior tuberal nucleus
- C
central canal
- CC
cerebellar crest
- CB
corpus cerebellar body
- CBg
granular layer of CB
- CBm
molecular layer of CB
- Cgus
commissure of the secondary gustatory nucleus
- CM
corpus mamillare
- CON
caudal octavolateralis nucleus
- CP
central posterior thalamic nucleus
- CPN
central pretectal nucleus
- Cven
ventral rhombencephalic commissure
- D
dorsal telencephalic area
- Dc
central zone of dorsal telencephalic area
- DH
dorsal horn of the spinal cord
- DIL
diffuse nucleus of the inferior lobe
- DiV
diencephalic ventricle
- Dl
lateral zone of dorsal telencephalic area
- Dm
medial zone of dorsal telencephalic area
- DON
descending octaval nucleus
- DOT
dorsomedial optic tract
- DTN
dorsal tegmental nucleus
- Dp
posterior zone of dorsal telencephalic area
- ECL
external cellular layer of olfactory bulb
- EG
granular eminence
- ENd
entopeduncular nucleus, dorsal part
- ENv
entopeduncular nucleus, ventral part
- Fr
fasciculus retroflexus
- Fv
ventral funiculus
- GC
griseum centrale
- GL
glomerular layer of olfactory bulb
- Ha
Habenula
- Had
dorsal habenular nucleus
- Hav
ventral habenular nucleus
- Hd
dorsal zone of periventricular hypothalamus
- Hv
ventral zone of periventricular hypothalamus
- Hy
hypothalamus
- I
intermediate thalamic nucleus
- IC
intercalated nucleus
- ICL
internal cellular layer of olfactory bulb
- IMRF
intermediate reticular formation
- IO
inferior olive
- IRF
inferior reticular formation
- LCa
posterior cerebellar lobe
- LCag
granular layer of LCa
- LCam
molecular layer of LCa
- LH
lateral hypothalamic nucleus
- LVII
facial lobe
- LIX
glossopharyngeal lobe
- LLF
lateral longitudinal fascicle
- LX
vagal lobe
- MA
Mauthner axon
- MFN
medial funicular nucleus
- MLF
medial longitudinal fascicle
- MO
medulla oblongata
- MON
medial octavolateralis nucleus
- mTP
migrated nucleus of the posterior tuberculum
- NC
commissural nucleus of Cajal
- NIII
oculomotor nucleus
- NIn
interpeduncular nucleus
- NIV
trochlear nucleus
- NLV
lateral valvular nucleus
- NMLF
nucleus of medial longitudinal fascicle
- NVIc
abducens nucleus, caudal part
- NVmd
trigeminal motor nucleus, dorsal part
- NVs
primary sensory trigeminal nucleus
- NXm
vagal motor nucleus
- Ob
olfactory bulb
- PGa
anterior preglomerular nucleus
- PGl
lateral preglomerular nucleus
- PGm
medial preglomerular nucleus
- PL
perilemniscal nucleus
- PPd
periventricular pretectal nucleus, dorsal part
- PPa
parvocellular preoptic nucleus, anterior part
- PPp
parvocellular preoptic nucleus, posterior part
- PPv
periventricular pretectal nucleus, ventral part
- PO
posterior pretectal nucleus
- PSp
parvocellular superficial pretectal nucleus
- PTN
posterior tuberal nucleus
- RV
rhombencephalic ventricle
- SAC
stratum album centrale
- SC
suprachiasmatic nucleus
- SD
dorsal saccus
- SFGS
stratum fibrosum et griseum superficiale
- SGC
stratum griseum centrale
- SGN
secondary gustatory nucleus
- SM
stratum marginale
- SO
stratum opticum
- Sop
secondary octaval population
- SPV
stratum periventriculare
- SR
superior raphe
- SRF
superior reticular formation
- SY
sulcus ypsiloniformis
- Tel
telencephalon
- TeO
optic tectum
- TeV
tectal ventricle
- TL
torus longitudinalis
- TPM
pretectomamillary tract and nucleus
- TPp
periventricular nucleus of posterior tuberculum
- TSc
central nucleus of torus semicircularis
- TSvl
ventrolateral nucleus of torus semicircularis
- V
ventral telencephalic area
- Val
lateral division of the valvula cerebelli
- Valg
granular layer of Val
- Valm
molecular layer of Val
- Vam
medial division of the valvula cerebelli
- Vamg
granular layer of Vam
- Vamm
molecular layer of Vam
- VAO
ventral accessory optic nucleus
- Vc
central nucleus of V
- Vd
dorsal nucleus of V
- VL
ventrolateral thalamic nucleus
- VM
ventromedial thalamic nucleus
- VOT
ventrolateral optic tract
- Vv
ventral nucleus of V
- VII
facial nerve
- VIII
octaval nerve
- X
vagal nerve
- ZL
zona limitans
Footnotes
Role of authors
All authors had full access to all the data in the study and take responsibility for the integrity of the data and the accuracy of the data analysis.
Study concept and design: QL
Acquisition of data: QL, SB, NW and ABS
Analysis and interpretation of data: QL and SB
Drafting the manuscript: QL
Obtaining funding: QL
Associate Editor: Thomas E. Finger
Conflict of interest statement
There is no known conflict of interest to declare from all the authors.
Literature cited
- Acampora D, Gulisano M, Broccoli V, Simeone A. Otx genes in brain morphogenesis. Prog Neurobiol. 2001;64:69–95. doi: 10.1016/s0301-0082(00)00042-3. [DOI] [PubMed] [Google Scholar]
- Akins MR, Benson DL, Greer CA. Cadherin expression in the developing mouse olfactory system. J Comp Neurol. 2007;501:483–497. doi: 10.1002/cne.21270. [DOI] [PubMed] [Google Scholar]
- Barthel LK, Raymond PA. Subcellular localization of alpha tubulin an opsin mRNA in the goldfish retina using digoxigenin-labeled cRNA probes detected by alkaline phosphatase and HRP histochemistry. J Neurosci Methods. 1990;48:145–152. doi: 10.1016/0165-0270(93)90002-9. [DOI] [PubMed] [Google Scholar]
- Becker T, Redies C. Internal structure of the nucleus rotundus revealed by mapping cadherin expression in the embryonic chicken visual system. J Comp Neurol. 2003;467:536–548. doi: 10.1002/cne.10954. [DOI] [PubMed] [Google Scholar]
- Bishop KM, Goudreau G, O’Leary DD. Regulation of area identity in the mammalian neocortex by Emx2 and Pax6. Science. 2000;288:344–349. doi: 10.1126/science.288.5464.344. [DOI] [PubMed] [Google Scholar]
- Biswas S, Emond MR, Jontes D. Protocadherin-19 and N-cadherin control cell movements during anterior neurulation. J Cell Biol. 2010;191:1029–1041. doi: 10.1083/jcb.201007008. [DOI] [PMC free article] [PubMed] [Google Scholar]
- Bitzur S, Kam Z, Geiger B. Structure and distribution of N-cadherin in developing zebrafish embryos: morphogenetic effects of ectopic over expression. Dev Dyn. 1994;201:121–136. doi: 10.1002/aja.1002010204. [DOI] [PubMed] [Google Scholar]
- Braford MR, Northcutt RG. Organization of the diencephalon and pretectum of the ray finned fishes. In: Davis RE, Northcutt RG, editors. Fish Neurobiology. University of Michigan Press; 1983. pp. 117–163. [Google Scholar]
- Briscoe J, Ericson J. Specification of neural fates in the ventral neural tube. Curr Opin Neurobiol. 2001;11:43–49. doi: 10.1016/s0959-4388(00)00172-0. [DOI] [PubMed] [Google Scholar]
- Castro A, Becerra M, Manso MJ, Anadon R. Calretinin immunoreactivity in the brain of the zebrafish, Danio rerio: distribution and comparison with some neuropeptides and neurotransmitter-synthesizing enzymes. I. Olfactory organ and forebrain. J Comp Neurol. 2006a;494:435–459. doi: 10.1002/cne.20782. [DOI] [PubMed] [Google Scholar]
- Castro A, Becerra M, Manso MJ, Anadon R. Calretinin immunoreactivity in the brain of the zebrafish, Danio rerio: distribution and comparison with some neuropeptides and neurotransmitter-synthesizing enzymes. II. Midbrain, hindbrain, and rostral spinal cord. J Comp Neurol. 2006b;494:792–814. doi: 10.1002/cne.20843. [DOI] [PubMed] [Google Scholar]
- Emond MR, Biswas S, Jontes JD. Protocadherin-19 is essential for early steps in brain morphogenesis. Dev Biol. 2009;334:72–83. doi: 10.1016/j.ydbio.2009.07.008. [DOI] [PubMed] [Google Scholar]
- Dean B, Keriakous D, Scarr E, Thomas EA. Gene expression profiling in Brodmann’s area 46 from subjects with schizophrenia. Aust N Z J Psychiatry. 2007;41:308–320. doi: 10.1080/00048670701213245. [DOI] [PubMed] [Google Scholar]
- Finger TE. The gustatory system in teleost fish. In: Northcutt RG, Davis RE, editors. Fish Neurobiology. Vol. 1. University of Michigan Press; 1983. pp. 285–309. [Google Scholar]
- Folgueira M, Sueiro C, Rodriquez-Moldes I, Yañez J, Anadon R. Organization of the torus longitudinalis in the rainbow trout (Oncorhynchus mykiss): immunohistochemical study of the GABAergic system and a Dil tract-tracing study. J Comp Neurol. 2007;503:348–370. doi: 10.1002/cne.21363. [DOI] [PubMed] [Google Scholar]
- Gaitan Y, Bouchard M. Expression of the δ–protocadherin genePcdh19 in the developing mouse embryo. Gene Expr Patt. 2006;6:893–899. doi: 10.1016/j.modgep.2006.03.001. [DOI] [PubMed] [Google Scholar]
- Gumbiner BM. Regulation of cadherin-mediated adhesion in morphogenesis. Nat Rev Mol Cell Biol. 2005;6:622–634. doi: 10.1038/nrm1699. [DOI] [PubMed] [Google Scholar]
- Hatta K, Takagi S, Fujisawa H, Takeichi M. Spatial and temporal expression pattern of N cadherin cell adhesion molecules correlated with morphogenetic processes of chicken embryos. Dev Biol. 1987;120:215–227. doi: 10.1016/0012-1606(87)90119-9. [DOI] [PubMed] [Google Scholar]
- Hertel N, Krishna-K, Nuernberger M, Redies C. A cadherin-based code for the divisions of the mouse basal ganglia. J Comp Neurol. 2008;508:511–528. doi: 10.1002/cne.21696. [DOI] [PubMed] [Google Scholar]
- Hertel N, Redies C. Absence of layer-specific cadherin expression profiles in the neocortex of the reeler mutant mouse. Cereb Cortex. 2011;21:1105–1117. doi: 10.1093/cercor/bhq183. [DOI] [PubMed] [Google Scholar]
- Hertel N, Redies C, Medina L. Cadherin expression delineates the divisions of the postnatal and adult mouse amygdala. J Comp Neurol. 2012;520:3982–4012. doi: 10.1002/cne.23140. [DOI] [PubMed] [Google Scholar]
- Hirano S, Takeichi M. Cadherins in brain morphogenesis and wiring. Physiol Rev. 2012;92:597–634. doi: 10.1152/physrev.00014.2011. [DOI] [PubMed] [Google Scholar]
- Ikenaga T, Yoshida M, Uematsu K. Efferent connections of cerebellum of the goldfish, Carassius auratus. Brain Behav Evol. 2002;60:36–51. doi: 10.1159/000064120. [DOI] [PubMed] [Google Scholar]
- Inoue YU, Asami J, Inoue T. Genetic labeling of mouse rhombomeres by cadherin 6::EGFP-BAC transgenesis underscores the role of cadherins in hindbrain compartmentalization. Neurosci Res. 2009;63:2–9. doi: 10.1016/j.neures.2008.09.005. [DOI] [PubMed] [Google Scholar]
- Kanwal JS, Caprio J. Central projections of the glossopharyngeal and vagal nerves in the channel catfish, Ictalurus punctatus: clues to differential processing of visceral inputs. J Comp Neurol. 1987;264:216–230. doi: 10.1002/cne.902640207. [DOI] [PubMed] [Google Scholar]
- Kasai M, Jikoh T, Fukumitsu H, Furukawa S. FGF-2-responsive and spinal cord-resident cells improve locomotor function after spinal cord injury. J Neurotrauma. 2014;31:1584–1598. doi: 10.1089/neu.2009.1108. [DOI] [PMC free article] [PubMed] [Google Scholar]
- Kim SY, Sun Chung H, Sun W, Kim H. Spatiotemporal expression pattern of non clustered protocaderin family members in the developing rat brain. Neurosci. 2007;147:996–1021. doi: 10.1016/j.neuroscience.2007.03.052. [DOI] [PubMed] [Google Scholar]
- Kim SY, Yasuda S, Tanaka H, Yamagata K, Kim H. Non-clustered protocadherin. Cell Adh Migr. 2011;5:97–105. doi: 10.4161/cam.5.2.14374. [DOI] [PMC free article] [PubMed] [Google Scholar]
- Krishna-K K, Nuernberger M, Weth F, Redies C. Layer-specific expression of multiple cadherins in the developing visual cortex (V1) of the ferret. Cereb Cortex. 2009;19:388–401. doi: 10.1093/cercor/bhn090. [DOI] [PubMed] [Google Scholar]
- Krishna-K K, Hertel N, Redies C. Cadherin expression in the somatosensory cortex: evidence for a combinatorial molecular code at the single-cell level. Neurosci. 2011;175:37–48. doi: 10.1016/j.neuroscience.2010.11.056. [DOI] [PubMed] [Google Scholar]
- Lichtneckert R, Reichert H. Anteroposterior regionalization of the brain: genetic and comparative aspects. Adv Exp Med Biol. 2008;628:32–41. doi: 10.1007/978-0-387-78261-4_2. [DOI] [PubMed] [Google Scholar]
- Liu Q, Sanborn KL, Cobb N, Raymond PA, Marrs JA. R-cadherin expression in the developing and adult zebrafish visual system. J Comp Neurol. 1999;410:303–319. doi: 10.1002/(sici)1096-9861(19990726)410:2<303::aid-cne11>3.0.co;2-b. [DOI] [PubMed] [Google Scholar]
- Liu Q, Babb SG, Novince ZM, Marrs JA, Raymond PA. Differential expression of cadherin-2 and cadherin-4 in the developing and adult zebrafish visual system. Vis Neurosci. 2001;18:923–933. [PubMed] [Google Scholar]
- Liu Q, Londraville RL, Azodi E, Babb SG, Chiappini-Williamson C, Marrs JA, Raymond PA. Up-regulation of cadherin-2 and cadherin-4 in regenerating visual structures of adult zebrafish. Exp Neurol. 2002;177:396–406. doi: 10.1006/exnr.2002.8008. [DOI] [PubMed] [Google Scholar]
- Liu Q, Azodi E, Kerstetter AE, Wilson AL. Cadherin-2 and cadherin-4 in developing, adult and regenerating zebrafish cerebellum. Brain Res Dev Brain Res. 2004;150:63–71. doi: 10.1016/j.devbrainres.2004.03.002. [DOI] [PubMed] [Google Scholar]
- Liu Q, Liu B, Wilson AL, Rostedt J. cadherin-6 message expression in the nervous system of developing zebrafish. Dev Dyn. 2006;235:272–278. doi: 10.1002/dvdy.20607. [DOI] [PMC free article] [PubMed] [Google Scholar]
- Liu Q, Chen Y, Pan JJ, Murakami T. Expression of protocadherin-9 and protocadherin-17 in the nervous system of the embryonic zebrafish. Gene Expr Patterns. 2009;9:490–496. doi: 10.1016/j.gep.2009.07.006. [DOI] [PMC free article] [PubMed] [Google Scholar]
- Liu Q, Chen Y, Kubota F, Pan JJ, Murakami T. Expression of protocadherin-19 in the nervous system of the embryonic zebrafish. Int J Dev Biol. 2010;54:905–911. doi: 10.1387/ijdb.092882ql. [DOI] [PubMed] [Google Scholar]
- Liu Q, Dalman MR, Samah S, Chen S, Chen Y, Hurlbut AK, Spencer MA, Pancoe L, Marrs JA. Cell adhesion molecule cadherin-6 function in zebrafish cranial and lateral line ganglia development. Dev Dyn. 2012;40:1716–1726. doi: 10.1002/dvdy.22665. [DOI] [PMC free article] [PubMed] [Google Scholar]
- Lumsden A, Krumlauf R. Patterning the vertebrate neuraxis. Science. 1996;274:1109–1115. doi: 10.1126/science.274.5290.1109. [DOI] [PubMed] [Google Scholar]
- Luo J, Treubert-Zimmermann U, Redies C. Cadherins guide migrating Purkinje cells to specific parasagittal domains during cerebellar development. Mol Cell Neurosci. 2004;25:138–152. doi: 10.1016/j.mcn.2003.10.003. [DOI] [PubMed] [Google Scholar]
- Matsunaga E, Nambu S, Iriki A, Okanoya K. Expression pattern of cadherins in the naked mole rat (Heterocephalus glaber) suggests innate cortical diversification of the cerebellum. J Comp Neurol. 2011;519:1736–1747. doi: 10.1002/cne.22598. [DOI] [PubMed] [Google Scholar]
- McCormick CA, Hernandez DV. Connections of octaval and lateral line nuclei of the medulla in the goldfish, including cytoarchitecture of the secondary octaval population in goldfish and catfish. Brain Behav Evol. 1996;47:113–137. doi: 10.1159/000113232. [DOI] [PubMed] [Google Scholar]
- Mollinari C, Ricci-Citani L, Pieri M, Lucantoni C, Rinaldi AM, Racaniello M, De Maria R, Zona C, Pallini R, Merlo D, Garaci F. Downregulation of thymosin beta4 in neural progenitor grafts promotes spinal cord regeneration. J Cell Sci. 2009;122:4195–4207. doi: 10.1242/jcs.056895. [DOI] [PubMed] [Google Scholar]
- Morita Y, Ito H, Masai H. Central gustatory paths in the crucian carp, Carassius carassius. J Comp Neurol. 1980;191:119–132. doi: 10.1002/cne.901910107. [DOI] [PubMed] [Google Scholar]
- Mueller T, Vernier P, Wullimann MF. The adult central nervous cholinergic system of a neurogenetic model animal, the zebrafish Danio rerio. Brain Res. 2004;1011:156–169. doi: 10.1016/j.brainres.2004.02.073. [DOI] [PubMed] [Google Scholar]
- Mueller T, Guo S. The distribution of GAD67-mRNA in the adult zebrafish (teleost) forebrain reveals a prosomeric pattern and suggests previously unidentified homologies to tetrapods. J Comp Neurol. 2009;516:553–568. doi: 10.1002/cne.22122. [DOI] [PMC free article] [PubMed] [Google Scholar]
- Mueller T, Dong Z, Berberoglu MA, Guo S. The dorsal pallium in zebrafish, Danio rerio (Cyprinidae, Teleostei) Brain Res. 2011;1381:95–105. doi: 10.1016/j.brainres.2010.12.089. [DOI] [PMC free article] [PubMed] [Google Scholar]
- Nollet F, Kools P, van Roy F. Phylogenetic analysis of the cadherin superfamily allows identification of six major subfamilies besides several solitary members. J Mol Biol. 2000;299:551–572. doi: 10.1006/jmbi.2000.3777. [DOI] [PubMed] [Google Scholar]
- Puelles L, Rubenstein JLR. Expression patterns of homeobox and other putative regulatory genes in the embryonic mouse forebrain suggest a neuromeric organization. Trends neurosci. 1993;16:472–479. doi: 10.1016/0166-2236(93)90080-6. [DOI] [PubMed] [Google Scholar]
- Puzdrowski RL. The peripheral distribution and central projections of the sensory rami of the facial nerve in goldfish, Carassius auratus. J Comp Neurol. 1987;259:382–392. doi: 10.1002/cne.902590306. [DOI] [PubMed] [Google Scholar]
- Redies C. Cadherin expression in the developing vertebrate CNS: from neuromeres to brain nuclei and neural circuits. Exp Cell Res. 1995;220:243–256. doi: 10.1006/excr.1995.1313. [DOI] [PubMed] [Google Scholar]
- Redies C. Cadherins in the central nervous system. Prog Neurobiol. 2000;61:611–648. doi: 10.1016/s0301-0082(99)00070-2. [DOI] [PubMed] [Google Scholar]
- Redies C, Takeichi M. Expression of N-cadherin mRNA during development of the mouse brain. Dev Dyn. 1993;197:26–39. doi: 10.1002/aja.1001970104. [DOI] [PubMed] [Google Scholar]
- Redies C, Takeichi M. Cadherins in the developing central nervous system: an adhesive code for segmental and functional subdivisions. Dev Biol. 1996;180:413–423. doi: 10.1006/dbio.1996.0315. [DOI] [PubMed] [Google Scholar]
- Redies C, Medina L, Puelles L. Cadherin expression by embryonic divisions and derived gray matter structures in the telencephalon of the chicken. J Comp Neurol. 2001;438:253–285. [PubMed] [Google Scholar]
- Redies C, Treubert-Zimmermann U, Luo J. Cadherins as regulators for the emergence of neural nets from embryonic divisions. J Physiol Paris. 2003;97:5–15. doi: 10.1016/j.jphysparis.2003.10.002. [DOI] [PubMed] [Google Scholar]
- Redies C, Vanhalst K, Roy Fv. delta-Protocadherins: unique structures and functions. Cell Mol Life Sci. 2005;62:2840–2852. doi: 10.1007/s00018-005-5320-z. [DOI] [PMC free article] [PubMed] [Google Scholar]
- Rink E, Wullimann MF. The teleostean (zebrafish) dopaminergic system ascending to the subpallium (striatum) is located in the basal diencephalons (posterior tuberculum) Brain Res. 2001;889:316–330. doi: 10.1016/s0006-8993(00)03174-7. [DOI] [PubMed] [Google Scholar]
- Ruan G, Wedlich D, Koehler A. Xenopus cadherin-6 regulates growth and epithelial development of the retina. Mech Dev. 2006;123:881–892. doi: 10.1016/j.mod.2006.08.010. [DOI] [PubMed] [Google Scholar]
- Santana S, Rico EP, Burgos JS. Can zebrafish be used as animal model to study Alzheimer’s disease? Am J Neurodegener Dis. 2012;1:32–48. [PMC free article] [PubMed] [Google Scholar]
- Schmidt R, Strahle U, Scholpp S. Neurogenesis in zebrafish-from embryo to adult. Neural Dev. 2013;8:3. doi: 10.1186/1749-8104-8-3. [DOI] [PMC free article] [PubMed] [Google Scholar]
- Steward AM, Braubach O, Spitsbergen J, Gerlai R, Kalueff AV. Zebrafish models for translational neuroscience research: from tank to bedside. Trends Neurosci. 2014;37:264–278. doi: 10.1016/j.tins.2014.02.011. [DOI] [PMC free article] [PubMed] [Google Scholar]
- Stoya G, Redies C, Schmid-Hertel N. Inversion of layer-specific cadherin expression profiles and maintenance of cytoarchitechtonic areas in the allocortex of the reeler mutant mouse. J Comp Neurol. 2014 doi: 10.1002/cne.23572. Epub 2014 Apr 8. [DOI] [PubMed] [Google Scholar]
- Stoykova P, Gruss P. Roles of Pax-genes in developing and adult brain as suggested by expression patterns. J Neurosci. 1994;14:1395–1412. doi: 10.1523/JNEUROSCI.14-03-01395.1994. [DOI] [PMC free article] [PubMed] [Google Scholar]
- Suzuki SC, Takeichi M. Cadherins in neuronal morphogenesis and function. Dev Growth Differ Suppl. 2008;1:S119–130. doi: 10.1111/j.1440-169X.2008.01002.x. [DOI] [PubMed] [Google Scholar]
- Tai K, Kubota M, Shiono K, Tokutsu H, Suzuki ST. Adhesion properties and retinofugal expression of chicken protocadherin-19. Brain Res. 2010;1344:13–24. doi: 10.1016/j.brainres.2010.04.065. [DOI] [PubMed] [Google Scholar]
- Takeichi M. Self-organization of animal tissues: cadherin-mediated processes. Dev Cell. 2011;21:24–26. doi: 10.1016/j.devcel.2011.06.002. [DOI] [PubMed] [Google Scholar]
- Terakawa YW, Inoue YU, Asami J, Hoshino M, Inoue T. A sharp cadherin-6 gene expression boundary in the developing mouse cortical plate demarcates the future functional areal border. Cereb Cortex. 2013;23:2293–2308. doi: 10.1093/cercor/bhs221. [DOI] [PMC free article] [PubMed] [Google Scholar]
- Trümpel S, Wiedemann LM, Krimlauf R. Hox genes and segmentation of the vertebrate hindbrain. Curr Top Dev Biol. 2009;88:103–137. doi: 10.1016/S0070-2153(09)88004-6. [DOI] [PubMed] [Google Scholar]
- Vanegas H. Organization and physiology of the teleostean optic tectum. In: Davis RE, Northcutt RG, editors. Fish Neurobiology. Vol. 2. University of Michigan Press; 1983. pp. 43–90. [Google Scholar]
- Vanhalst K, Kools P, Staes K, van Roy F, Redies C. delta Protocadherins: a gene family expressed differentially in the mouse brain. Cell Mol Life Sci. 2005;62:1247–1259. doi: 10.1007/s00018-005-5021-7. [DOI] [PMC free article] [PubMed] [Google Scholar]
- Westerfield M. The Zebrafish Book. University of Oregon Press; 2007. [Google Scholar]
- Wöhrn JC, Puelles L, Nakagawa S, Takeichi M, Redies C. Cadherin expression in the retina and retinofugal pathways of the chicken embryo. J Comp Neurol. 1998;396:20–38. [PubMed] [Google Scholar]
- Wöhrn JC, Nakagawa S, Ast M, Takeichi M, Redies C. Combinatorial expression of cadherins in the tectum and the sorting of neuritis in the tectofugal pathways of the chicken embryo. Neurosci. 1999;90:985–1000. doi: 10.1016/s0306-4522(98)00526-0. [DOI] [PubMed] [Google Scholar]
- Wullinmann MF. The teleostean torus longitudinalis: a short review on its structure, histochemistry, connectivity, possible function and physiology. Eur J Morphol. 1994;32:235–242. [PubMed] [Google Scholar]
- Wullimann MF, Rupp B, Reichert H. Neuroanatomy of the Zebrafish Brain, a Topological Atlas. Birkhäuser Verlag; 1996. [Google Scholar]
- Wullimann MF, Puelles L. Postembryonic neural proliferation in the zebrafish forebrain and its relationship to prosomeric domains. Anat Embryol. 1999;199:329–348. doi: 10.1007/s004290050232. [DOI] [PubMed] [Google Scholar]
- Wullimann MF, Mueller T. Teleostean and mammalian forebrains contrasted: evidence from genes to behavior. J Comp Neurol. 2004;475:143–162. doi: 10.1002/cne.20183. [DOI] [PubMed] [Google Scholar]
- Yagi T. Diversity of the cadherin-related neuronal receptor/protocadherin family and possible DNA rearrangement in the brain. Genes Cells. 2003;8:1–8. doi: 10.1046/j.1365-2443.2003.00614.x. [DOI] [PubMed] [Google Scholar]
- Yagi T. Clustered protocadherin family. Dev Growth Differ. 2008;50(Suppl 1):S131–140. doi: 10.1111/j.1440-169X.2008.00991.x. [DOI] [PubMed] [Google Scholar]


