

Abstract
Objective
The objective of this article is to test the effects of angiotensin-converting enzyme (ACE)-inhibition on glomerular epithelial cell number in an inducible experimental model of focal segmental glomerulosclerosis (FSGS).
Background
Although ACE-inhibition has been shown to limit podocyte loss by enhancing survival, little is known about its effect on podocyte number following an abrupt decline in disease.
Methods
Experimental FSGS was induced with cytotoxic antipodocyte antibody. Following induction, groups were randomized to receive the ACE-inhibitor enalapril, the smooth muscle relaxant hydralazine (blood pressure control) or drinking water. Blood pressure, kidney function and histology were measured seven and 14 days following disease induction.
Results
Both glomerulosclerosis and urinary albumin-to-creatinine ratio were less in the ACE-inhibition arm at day 14. At day 7 of disease, mean podocyte numbers were 26% and 29% lower in the enalapril and hydralazine arms, respectively, compared to normal mice in which no antibody was injected. At day 14, the mean podocyte number was only 18% lower in the enalapril arm, but was 39% lower in the hydralazine arm compared to normal mice. Podocyte proliferation did not occur at any time in any group. Compared to water- or hydralazine-treated mice with FSGS, the enalapril arm had a higher mean number of glomerular parietal epithelial cells that co-expressed the podocyte proteins WT-1 and synaptopodin, as well as phospho-ERK.
Conclusion
The results show following an abrupt decline in podocyte number, the initiation of ACE-inhibition but not hydralazine, was accompanied by higher podocyte number in the absence of proliferation. This was accompanied by a higher number of parietal epithelial cells that co-express podocyte proteins. Increasing podocyte number appears to be accompanied by reduced glomerulosclerosis.
Keywords: Focal segmental glomerulosclerosis, glomerulosclerosis, enalapril, parietal epithelial cell, podocyte, regeneration, repair
Introduction
Proteinuric glomerular diseases are the leading cause of chronic and end-stage kidney diseases. Following injury to the terminally differentiated glomerular epithelial cells called podocytes, a decrease in podocyte number underlies and predicts the development of extracellular matrix protein accumulation, leading to progressive glomerular scarring. In contrast to other glomerular cells, podocytes are unable to proliferate adequately to replace those depleted in disease.
Inhibiting the renin-angiotensin-aldosterone system (RAAS) provides therapeutic benefits in experimental and clinical proteinuric glomerular diseases by reducing systemic and intra-glomerular pressures, and through direct pleiotropic effects at the cellular level.1–5 At the level of podocytes, RAAS inhibition affects nephrin levels,6,7 TRPC6 activity,8 calcium and other signaling, survival, proliferation, matrix production, reactive oxygen species formation, and others.9
Several studies have recently emerged showing that ACE-inhibitors affect glomerular epithelial cell number. ACE-inhibitors limit podocyte loss by having direct benefits such as reducing apoptosis and enhancing survival.10 Macconi and colleagues showed that ACE-inhibitors reduce glomerular epithelial cell proliferation in the genetic Munich Wistar Frömter (MWF) rat strain that develop “spontaneous” glomerular injury associated with increased glomerular cell number and crescent formation.11 In a follow-up study, Benigni and colleagues showed that in the crescents of aged MWF rats, ACE-inhibition reduced proliferation of all cell populations within the cellular crescent, including parietal epithelial cells and parietal epithelial cell progenitors.12 These effects correlated with improved glomerular architecture and renal function, and reduced glomerulosclerosis. Rizzo et al. recently showed that the angiotensin II/AT1 receptor pathway may play a critical role in limiting the dysregulation of renal progenitors along Bowman’s capsule, and in doing so, ACE-inhibitors limit crescents in a model of crescentic glomerulonephritis.13
Despite the perceived notion that RAAS inhibition can improve podocyte number following disease-induced depletion, there are surprisingly limited published studies showing that ACE-inhibitors clearly fulfill this role in glomerular diseases independent of proliferation. Although it is well recognized that podocyte depletion leads to glomerulosclerosis,14–17 little is known about the consequences of increasing podocyte number on this outcome. Accordingly, the purpose of these studies was to determine the acute effects of ACE-inhibition on glomerular epithelial cells following an abrupt depletion in podocyte number in an experimental model of focal segmental glomerulosclerosis (FSGS).
Materials and methods
Animal model
Experimental FSGS mouse model
We have previously reported that giving mice sheep antiglomerular antibody leads to features consistent with classic FSGS: reduced podocyte number, focal glomerulosclerosis and proteinuria.18 This model differs from an antibody-induced mouse model characterized by glomerular epithelial cell proliferation.19–21 In this study, baseline data were collected on B6129SV/j mice before experimental FSGS was induced by administration of sheep antiglomerular antibody (12.5 mg/20 g body weight (BW), for two consecutive days) as we have previously reported22–25 (Figure 1). Several pilot studies were performed to determine the optimal dosing of the antihypertensive medications (hydralazine, enalapril) to ensure equivalent declines in blood pressure (BP). On day 3 of disease, when podocyte number has typically decreased by a mean of 30% from baseline, 36 mice with FSGS were randomly assigned to one of three groups: (i) group 1 (n = 12) mice with FSGS were given drinking water (the vehicle for hydralazine and enalapril); (ii) group 2 (n = 12) mice with FSGS were started on hydralazine (300 ug/ml); (iii) group 3 (n = 12) mice with FSGS were started on the ACE-inhibitor enalapril (75 ug/ml). Approximately half of the mice from each group were randomly selected and sacrificed on day 7 (n = 6/group); the remaining mice were sacrificed on day 14 of disease. To account for age, a group of control mice (n = 5) without disease were given drinking water and sacrificed on day 14.
Figure 1.

Experimental design.
A schema of the experimental design is shown. Bp: blood pressure; BW: body weight.
BP and urine measurements
BP was measured using the CODA 6 noninvasive tail-cuff system (Kent Scientific, Torrington, CT) on conscious mice, as previously described.26,27 BP was measured prior to the start of disease induction (baseline reading) and during disease at day 3 (prior to randomization), day 4 (24 hours after treatment), day 6 and day 13 (one day before sacrifice). Mice were placed into individual metabolic cages overnight and spontaneously voided urine was collected for 12 hours prior to disease induction, and 12 hours prior to sacrifice. Urine albumin concentration was determined using the Albuwell M Elisa Kit (Exocell Inc, Philadelphia, PA). Urine creatinine was determined using a colorimetric microplate assay (Cayman Chemical Company, Ann Arbor, MI), as we have previously reported.25,28 Mice were housed in the animal care facility of the University of Washington under standardized pathogen-free conditions with food and water available ad libitum. These studies were reviewed and approved by the University of Washington Institutional Animal Care and Use Committee (2968-04).
Measuring podocytes
Podocyte number was measured by quantitating p57 staining. Indirect immunoperoxidase staining for p57 was performed on formalin-fixed biopsies as previously reported in detail24–26,29,30 with a rabbit anti-Kip2 p57 polyclonal antibody (Santa Cruz Biotechnology, Santa Cruz, CA). Diaminobenzidine (DAB) was detected as a brown color (Fisher). For podocyte number, the number of cells in the glomerular tuft staining for p57 was measured on 25–30 glomeruli per cross section. Because of potential differences in glomerular tuft area with treatment, the glomerular tuft area was measured on periodic acid-Schiff (PAS)-stained slides, and used as a denominator to assess podocyte number.
Identifying glomerular epithelial transition cells
To identify and quantitate the number of glomerular epithelial transition cells, defined as cells that co-express both a podocyte and glomerular parietal epithelial cell (PEC) protein, double immunostaining was performed as we have previously reported in detail.18,22,30 The following primary antibodies were used: rabbit anti-rat paired box gene 2 (PAX2, PEC nuclear protein, Zymed Laboratories, South San Francisco, CA), rabbit anti-Wilms’ Tumor-1 antibody (WT-1, podocytenuclearprotein, Santa Cruz Biotechnology, Santa Cruz, CA), and mouse antisynaptopodin antibody (SYNA, podocyte cytoplasm protein, Fitzgerald, Concord, MA). Quantification of positively stained cells was performed on individual animals at each time point using a combination of bright field and fluorescent microscopy as we have reported.18,22,30 Double-positive transition cells were identified as follows. The presences of blue/gray color in the nucleus by bright-field microscopy indicated positive staining for PAX2. If the same nucleus also showed the presence of red color by fluorescent microscopy, this indicated positive staining for WT-1. Likewise, when the presence of red color in the nucleus (PAX2) also showed the presence of green color in the cytoplasm by fluorescent microscopy (synaptopodin). This cell was then considered a double-positive cell, and the number of these cells within the entire glomerulus (defined as the total number of positive cells lining Bowman’s capsule and in the glomerular tuft) was quantitated.
Measuring proliferation and extracellular-signal-regulated kinases (ERK) signaling
To determine if any changes in podocyte number were due to glomerular cell proliferation, proliferating cells were measured by staining for ki-67 (a rabbit anti-Ki-67 antibody, proliferating cell nuclear protein, Thermo, Fremont, CA).31 In order to determine changes in phosphorylated extracellular signal-regulated kinase 1 and 2 (p-ERK1/2), double staining for p-ERK with PAX2 or WT-1 was performed using a rabbit antiphospho-p44/42 MAPK antibody (extracellular signal-regulated kinases 1 and 2 (ERK)) (Thr202/Tyr204, Cell Signaling Technology, Boston, MA). Staining was visualized with the Vector SG substrate kit, blue/gray color, the Warp Red Chromogen Kit, red color (Biocare Medical) and DAB, brown color. Double-positive cells were defined as the presences of blue/gray color in the nucleus (for PAX2 and WT-1), and brown color in the cytoplasm by bright-field microscopy (for p-ERK).
Sheep immunoglobulin (Ig)G immunofluorescence staining
Although enalapril and hydralazine were only first administered three days following the injection of the disease-inducing anti podocyte antibody and therefore administration follows acute podocyte depletion, we wanted to ensure that the effects of ACE-inhibition were not due to a decrease in the binding of the antiglomerular antibody. Accordingly, sheep IgG was stained at day 7 and 14 using a rabbit anti-sheep IgG heavy and light (H&L) (fluorescein isothiocyanate (FITC)) polyclonal antibody (Abcam, Cambridge, MA) as reported previously.29,32,33
Measuring glomerulosclerosis
To measure glomerular sclerosis, Sirius red staining was performed.34 Sections were treated with 0.2% phosphomolybdic acid (MP Biomedicals) for five minutes then exposed to Picro-Sirius red (Polysciences & Sigma) for 90 minutes at room temperature, rinsed briefly with acidified water (0.01% HCL) before dehydration and mounting. Glomerulosclerosis was determined using Sirius red staining, and graded quantitatively by the percentage of glomerular tuft area involvement as follows and as previously reported:18 score 0, no sclerosis; score 1, <25%; score 2, 25%–50%; score 3 50%–75%; score 4, 75%–100%. Global sclerosis means the glomeruli with more than 75% tuft area scleroses, which is score 4.
Statistical analysis
Characteristics measured on the mice in the study sample were summarized using means and standard errors (SE) for continuous characteristics and proportions for binary and categorical variables. We used generalized estimating equations (GEE) regression analysis to investigate the associations between treatment conditions and the outcomes: glomerulosclerosis, podocyte number and PEC. GEE is a correlated data regression model that accounts for repeated-measures correlations within mice and permits us to make valid comparisons of the treatments over time. There were 1140 measurements collected on 38 mice for the treatment conditions (30 repeated measurements per animal). We summarize associations for the different outcomes (e.g. glomerulosclerosis, podocyte number) by comparing the mean differences in the treatment groups. Test statistics are Wald statistics. All hypothesis tests and associated p values are two sided. Hypothesis tests investigating a treatment effect are not adjusted for multiple comparisons.
Results
Enalapril does not affect the binding of the antiglomerular antibody
FSGS was induced by an antiglomerular antibody as we have previously reported.22–25 Although enalapril and hydralazine both were administered for the first time on day 3 of disease, immunostaining for the disease-inducing sheep antiglomerular antibody was performed to ensure that any differences were not due to antibody binding (data not shown). Antibody binding was restricted to a podocyte distribution, similar to our previous reports.29,33 As expected, there was no difference in staining for sheep IgG within the glomerulus between untreated mice and mice receiving hydralazine or enalapril (data not shown). These data show that differences in outcomes for the mouse groups were not due to differences in antibody deposition and disease induction.
Enalapril and hydralazine lower BP in mice with experimental FSGS
BP was measured to ensure that any benefits from ACE-inhibition in experimental FSGS were independent of BP effects, and the results are shown in Table 1. The normal range for BP prior to disease induction was (122/89 mmHg, 95% confidence interval (CI): 116–128/82–92 mmHg). Systolic BP was higher at day 3 of disease compared to age-matched non-diseased controls (134/89 mmHg, 95% CI: 127–141/81–97 mmHg vs. 125/92 mmHg, 95% CI: 110–141/63–101 mmHg, normal control, p < 0.05). In FSGS animals given water, the mean systolic BP increased transiently with a peak at day 6, returning to normal by day 13. The decrease in systolic BP and diastolic BP was similar in FSGS mice treated with hydralazine and enalapril on day 4 (111/66 mmHg, enalapril; 118/75 mmHg, hydralazine, p > 0.05), day 6 (101/63 mmHg, enalapril; 114/77 mmHg, hydralazine, p > 0.05) and day 13 (90/58 mmHg, enalapril; 97/66 mmHg, hydralazine, p > 0.05). These data show a similar BP-lowering effect with hydralazine and enalapril in this FSGS model.
Table 1.
Systolic blood pressure (mmHg) in different groups and different time points.
| Animal group | Day 0 | Day 3 | Day 4 | Day 6 | Day 13 |
|---|---|---|---|---|---|
| Baseline (normal) | 122±2.8 | 125±8 | 129±9.1 | 127±6.7 | 119±8 |
| FSGS + water | 134±3.6a | 138±3.9a | 142±4.3a | 121±5.7 | |
| FSGS + hydralazine | 118±6.4b | 114±4.1b | 97±7.3b | ||
| FSGS + enalapril | 111±5.0b | 101±4.1b | 90±9.6b |
FSGS: focal segmental glomerulosclerosis.
p < 0.05 vs. baseline (normal).
p < 0.01 vs. FSGS + water.
Enalapril reduces glomerulosclerosis in experimental FSGS
The degree of glomerular scarring was quantitated by glomerulosclerosis index scoring, as we have previously reported.18,29,35 Although glomerular scarring was mild early in disease, the mean glomerulosclerosis score was significantly higher in all groups at day 7 compared to baseline (Tables 2 and 3, Figure 2), but was slightly lower in the enalapril group (1.1±0.12 untreated, 1.17±0.16 hydralazine, 0.85±0.12 enalapril, p > 0.05 compared with baseline for all groups). Glomerulosclerosis was slightly higher in the untreated and hydralazine groups by day 14 (1.19±0.23 untreated and 1.29±0.13 hydralazine), but remained unchanged in the enalapril-treated group (0.86±0.16 enalapril, p = 0.013 enalapril compared to hydralazine) (Tables 2 and 3, Figure 2). Hydralazine had no effect on sclerosis (p > 0.05 vs. untreated). The results show that although glomerulosclerosis was mild overall, the ACE-inhibition group had less glomerulosclerosis at day 14 for this model of FSGS. Moreover, at this time point, enalapril also lowered the urinary albumin-to-creatinine ratio (393.4 ug/mg vs. 770.3 ug/mg, p = 0.034).
Table 2.
Summary of endpoints measured.
| Endpoint | Treatment group | Day 0 Baseline | Day 7 FSGS | Day 14 FSGS |
|---|---|---|---|---|
| Glomerulosclerosis (glomerular scarring score) | Water | 0.00 (0.000) | 1.10 (0.117) | 1.19 (0.230) |
| Hydralazine | 1.17 (0.159) | 1.29 (0.129) | ||
| Enalapril | 0.85 (0.122) | 0.86 (0.160) | ||
| Podocyte number (#p57-positive cells/mm2 of glomerular tuft) | Water | 9.37 (0.089) | 6.85 (0.387) | 6.47 (0.839) |
| Hydralazine | 6.64 (0.204) | 5.76 (0.554) | ||
| Enalapril | 6.97 (0.476) | 7.71 (0.594) | ||
| PEC number (#PAX2-positive cells/mm Bowman’s capsule length) | Water | 3.19 (0.201) | 3.78 (0.170) | 3.81 (0.403) |
| Hydralazine | 3.29 (0.260) | 2.98 (0.174) | ||
| Enalapril | 3.39 (0.201) | 3.44 (0.149) | ||
| Transition epithelial cells (#PAX2+WT1+ cells/mm Bowman’s capsule length) | Water | 0.01 (0.009) | 0.167 (0.036) | 0.067 (0.032) |
| Hydralazine | 0.222 (0.048) | 0.061 (0.023) | ||
| Enalapril | 0.406 (0.075) | 0.111 (0.031) |
FSGS: focal segmental glomerulosclerosis; PEC: glomerular parietal epithelial cell; PAX2: paired box gene 2; WT: Wilm’s tumor suppressor protein-1.
Table 3.
Glomerulosclerosis by time and treatments.
| Outcome: glomerulosclerosis | Mean difference | Robust SE | p value | 95% Confidence interval | |
|---|---|---|---|---|---|
| Time | |||||
| Day 14–Day 7 | 0.071 | 0.128 | 0.582 | −0.189 | 0.331 |
| Treatments | |||||
| Hydralazine-enalapril | 0.381 | 0.144 | 0.013 | 0.087 | 0.674 |
| Water-enalapril | 0.290 | 0.160 | 0.079 | −0.035 | 0.615 |
| Water-hydralazine | −0.091 | 0.161 | 0.579 | −0.419 | 0.238 |
Figure 2.

Glomerulosclerosis is lower in focal segmental glomerulosclerosis (FSGS) mice given enalapril. Sirius red staining was used to detect glomerulosclerosis in (a) normal mice, (b) FSGS mice given water (untreated), (c) FSGS mice given hydralazine, (d) FSGS mice given enalapril. (e) shows the sclerosis index quantitating glomerulosclerosis. Compared to day 0 (baseline), glomerulosclerosis was higher in all three groups with FSGS at day 7 (*p < 0.05). At day 14, FSGS was higher in the untreated and hydralazine-treated mice (**P < 0.001 vs. day 7), but not in the enalapril-treated group.
Summaries are presented as arithmetic means (robust SE) by treatment group. The glomerulosclerosis SE estimate equal to zero at baseline time for the water treatment group resulted from all sclerosis measurements on all animals being zero.
Enalapril increases podocyte number in experimental FSGS
Podocyte number was quantitated by measuring the number of glomerular cells staining for p57 and was expressed per mm2 of glomerular tuft, and the results are shown in Table 2 and Figure 3. At baseline, the mean was 9.37±0.89 p57-positive cells/mm2 in normal mice. The mean podocyte number was lower in all three groups at day 7 as follows: untreated animals 6.85±0.39 (p < 0.01 vs. baseline), 6.64±0.2 hydralazine-treated (p < 0.01 vs. baseline, p > 0.05 vs. untreated), enalapril-treated 6.97±0.48 (p < 0.01 vs. baseline, p > 0.05 vs. hydralazine). By day 14 of FSGS, podocyte number remained low in untreated animals (6.47±0.84, p > 0.05 vs. day 7) and hydralazine-treated animals (5.76±0.56, p > 0.05 vs. day 7, and p > 0.05 vs. untreated). However, enalapril treatment had a higher mean podocyte number at day 14 (7.71±0.59 p57-positive cells per mm2 of glomerular tuft). The mean podocyte number was significantly higher than in both the hydralazine-treated mice at day 14 (95% CI 0.087 – 0.674) and the enalapril-treated mice at day 7 (p < 0.05). These data show that following an abrupt decline, podocyte number was 1.8% (day 7) and 19.2% (day 14) higher following enalapril treatment compared to untreated mice with FSGS. When compared to hydralazine-treated mice, podocytes were 5% (day 7) and 34% (day 14) higher following enalapril treatment.
Figure 3.
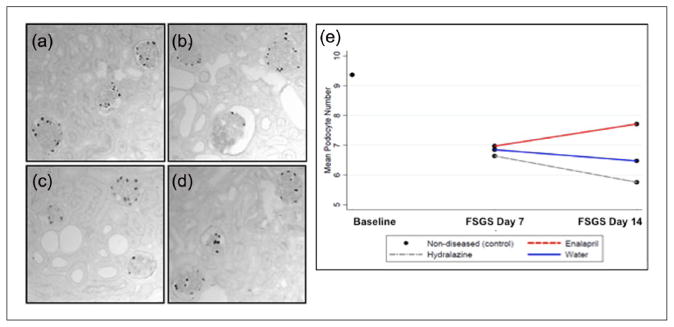
Podocyte number is higher in enalapril-treated mice. p57 staining was used to identify podocytes and quantitate their numbers in (a) normal mice, (b) focal segmental glomerulosclerosis (FSGS) mice given water (untreated), (c) FSGS mice given hydralazine and (d) FSGS mice given enalapril. Mean podocyte number shown in (e) was lowered abruptly at day 7 of FSGS compared to baseline. Podocyte number was progressively lower in water- and hydralazine-treated FSGS mice. In contrast, mean podocyte number was higher in FSGS mice given enalapril.
We also investigated the association between podocyte number and glomerulosclerosis, and the results are shown in Table 4 and Figure 4. The characteristics were inversely associated, with a larger number of podocytes corresponding to higher levels of glomerulosclerosis across all treatment groups (r = −0.22, 95% CI = −0.25, −0.18). The increase in podocyte number in the enalapril group was significantly associated with the improvement in glomerulosclerosis (95% CI 0.001 – 0.019) (Figure 4).
Table 4.
Association between glomerulosclerosis, podocyte number, and parietal epithelial cell (PEC) number. Characteristics (podocyte, PEC) were centered to reduce impact of collinearity.
| Outcome: glomerulosclerosis | Estimate | Robust SE | p value | 95% Confidence interval | |
|---|---|---|---|---|---|
| Predictors | |||||
| Podocyte | −0.227 | .0124 | < 0.001 | −0.252 | −0.202 |
| PEC | 0.007 | 0.0196 | 0.727 | −0.033 | 0.047 |
| Podocyte2 | 0.030 | 0.0020 | < 0.001 | 0.026 | 0.034 |
| PEC2 | 0.010 | 0.0046 | 0.034 | 0.001 | 0.019 |
| Podocyte × PEC | −0.0002 | 0.0001 | 0.058 | −0.0005 | 0.00001 |
| Intercept | 0.678 | 0.0569 | < 0.001 | 0.562 | 0.793 |
Figure 4.

Predicted glomerulosclerosis response as a function of podocyte number and glomerular parietal epithelial cell (PEC) number. Different scores of glomerulosclerosis are represented by four different colors, represented by the scale above the graph. The figure illustrates that a lower podocyte number (Y axis) is a strong predictor of higher mean glomerulosclerosis. The association is largely independent of PEC number (X axis). The levels of mean glomerulosclerosis (reflected in the color bands) vary little as the PEC number varies. We do observe, however, that glomerulosclerosis trends lower than higher PEC numbers, as seen through the trends of the color bands.
Podocyte proliferation was not detected
Double-staining was performed for the podocyte marker p57 and the proliferation marker Ki-67, to determine if the increase in podocyte number in the enalapril group was due to podocyte proliferation. No Ki-67+/p57+ cells were detected in glomeruli in any of the groups, at either of the disease time points. This was not a false negative because occasional Ki-67-positive cells were detected in tubular cells in the same tissue sections (not shown). These data suggest that the increase in podocyte number in the enalapril group was not due to proliferation.
PEC number increases in experimental FSGS
Quantitating the number of PAX2-stained cells was used to determine PEC number, using the length of Bowman’s capsule as the denominator (Table 2). Baseline (normal) animals had 3.19±0.2 PAX2+ cells/mm Bowman’s capsule length. Despite this being a model of abrupt podocyte depletion, PEC number was higher, albeit slightly, in disease in all groups at day 7: untreated animals (3.78±0.17, p < 0.05 vs. baseline), hydralazine treated (3.29±0.26, p > 0.05 vs. untreated) and enalapril treated (3.39±0.2, p > 0.05 vs. hydralazine). No further change in PEC number was observed at day 14 in any of the groups: untreated animals (3.81±0.4, P<0.05 vs. baseline) hydralazine treated (2.98±0.17, p > 0.05 vs. untreated) and enalapril treated (3.44±0.15, p > 0.05 vs. untreated, p < 0.05 vs. hydralazine). These data show a mild overall higher PEC number in this model in all groups.
Recent studies have shown that PECs might underlie segmental scarring in FSGS.36 A bivariate analysis was performed to better understand the relationship of the higher PEC number and glomerulosclerosis in this model (Table 4). The results showed that a higher PEC number predicted glomerulosclerosis in all groups (95% CI 0.001 – 0.019) (Table 4).
Glomerular transition cells increase in enalapril-treated mice with experimental FSGS
Because podocyte number increased in the absence of proliferation following enalapril treatment, we next sought to determine if enalapril increased the number of glomerular epithelial transition cells, defined as cells lining Bowman’s capsule co-expressing both a PEC- and a podocyte-“specific” protein (Table 2, Figures 5 and 6), using two combinations of double-staining.
Figure 5.

Double staining for paired box gene 2 (PAX2) and Wilm’s tumor suppressor protein-1 (WT-1) shows that the number of glomerular epithelial transition cells are higher in mice given enalapril. (a–h) Representative image of PAX2 and WT-1 double staining at ×630 original magnification. (a) Normal mouse: Solid arrow indicates WT-1 (pink) and dashed arrow indicates PAX2 (blue/gray) single positive cells in the tuft and along Bowman’s capsule. (b) Normal mouse: The same image shown in panel (a) is visualized by fluorescence, highlighting WT-1 staining (red). No WT-1 staining is seen in PAX2-positive cells along Bowman’s capsule (dashed arrows). (c) Focal segmental glomerulosclerosis (FSGS) + enalapril at day 7, arrowhead indicates a PAX2+/WT-1+ cell along Bowman’s capsule. (d) The same image show in panel C is visualized by fluorescence. WT-1 staining (red) is seen in the PAX2-positive cell along Bowman’s capsule. (e) Higher magnification image of the inset of shown in panel (c). (f) Higher magnification image of the inset of shown in panel (d). (g) FSGS + enalapril at day 14, arrowheads indicate PAX2+/WT-1+ cells in the glomerular tuft. (h) The same image show in panel (g) is visualized by fluorescence. WT-1 staining (red) is seen in the PAX2-positive cells in the tuft. (i) Higher magnification image of the inset of shown in panel (g). (j) Higher magnification image of the inset of shown in panel (h). (k) The numbers of cells staining positive for PAX2 and WT-1 cells/mm of Bowman’s capsule length per glomerular cross section were significantly higher at day 7 in untreated (white column) and hydralazine-treated (gray slash column) mice with FSGS compared to normal mice. Enalapril treatment (black column) increases this number at day 7. (l) The numbers of cells staining positive for PAX2 and WT-1 cells/mm2 of tuft area per glomerular cross section were significantly higher at day 14 in untreated (white column) and hydralazine-treated (gray slash column) mice with FSGS compared to normal mice. Enalapril treatment (black column) increases this number at day 14.
Figure 6.
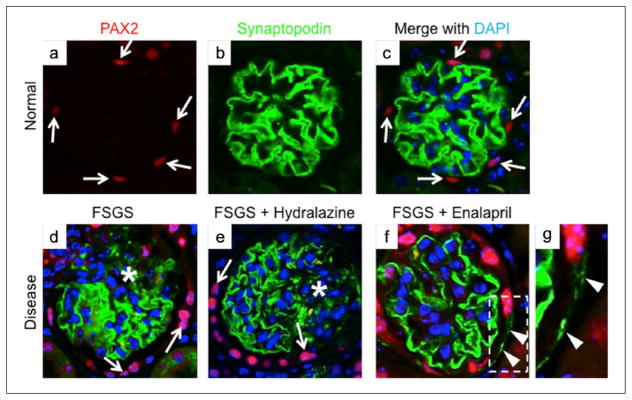
Glomerular epithelial transition cells identified as co-staining for paired box gene 2 (PAX2) and synaptopodin are higher in focal segmental glomerulosclerosis (FSGS) mice given enalapril (a–c). Representative images from normal mice for PAX2 (red color), synaptopodin (green color) and with DAPI staining nuclei (blue color) (×630 original magnification). (d) Mice with FSGS: Areas of reduced synaptopodin staining are noted (asterisk); synaptopodin positive cells were barely detected along Bowman’s capsule. Arrows indicate PAX2 (red color)-positive cells. (e) Mice with FSGS + hydralazine: Areas of reduced synaptopodin staining are noted (asterisk); synaptopodin-positive cells were barely detected along Bowman’s capsule. Arrows indicate PAX2-positive cells. (f) Mice with FSGS + enalapril: Arrowheads show synaptopodin-positive staining along Bowman’s capsule. (g) View of the inset of that shown in (f).
First, double staining for the nuclear proteins PAX2 (PEC) and WT-1 (podocyte) was performed (Figure 5). At baseline, double-positive PAX2+/WT-1+ cells were barely detected along Bowman’s capsule (0.01±0.009/mm) (Table 2). However, the number of PAX2+/WT-1+ cells increased along Bowman’s capsule at day 7 in untreated (0.167±0.036/mm, p < 0.05 vs. baseline) and hydralazine-treated (0.222±0.048/mm, p > 0.05 vs. untreated) animals. This increased two-fold further in enalapril treated-mice at day 7 (0.406±0.075/mm, p < 0.001 vs. hydralazine) (Figure 5, Table 2). There was no significant difference in the number of PAX2+/WT-1+ cells along Bowman’s capsule between the treated and untreated groups at day 14.
The number of PAX2+/WT-1+ cells in the glomerular tuft at baseline was 0.01±0.005/mm2. There was no increase at day 7 in any group. The number of PAX2+/WT-1+ transition cells increased in the tuft at day 14 of disease in untreated (31.0±10.9mm2, p < 0.05 vs. baseline) and hydralazine-treated animals (28.16±11.9mm2, p > 0.05 vs. untreated). This number increased two-fold in enalapril-treated mice (59.6±12.5mm2, p < 0.001 vs. hydralazine) (Figure 5). Similar data were observed using double staining for PAX2+/synaptopodin+ to detect transition cells (Figure 6). Taken together, the increase in the number of transition cells along both Bowman’s capsule and in the glomerular tuft was augmented by enalapril in a model of FSGS.
We next used a bivariate analysis to investigate the association between the number of transition cells, and podocyte number, using the resulting 38 pairwise measurements. The fitted model showed that the mean number of podocytes seemed to follow a linear association with the mean number of transition cells. The equation was:
The p value for the association was 0.007. The range of values for the mean transition number was 0 to 0.47. The fitted values for the mean podocytes therefore ranged between 6.64 and 8.96 (Figure 7).
Figure 7.

Scatterplot. Higher mean transition cells (X axis) was associated with a higher mean podocyte number (Y axis).
Enalapril augments p-ERK1/2 in experimental FSGS
Given its role in cell differentiation,37,38 we next sought to determine if the enalapril-induced changes were associated with changes in the ERK pathway in cells lining Bowman’s capsule. Figure 8 shows examples of the double staining for the PEC marker PAX2, and for phospho-ERK (p-ERK), the active form of ERK. The number of double-positive PAX2+/p-ERK+ cells per Bowman’s capsule cross section increased along Bowman’s capsule in untreated (0.86±0.13 vs. 0, p < 0.001, normal) and in hydralazine-treated mice with FSGS (0.75±0.13, p < 0.001 vs. normal) at day 7. Enalapril further increased the number of PAX2+/p-ERK+-positive cells approximately two-fold at day 7 (1.40±0.16, p < 0.01 vs. hydralazine-treated FSGS mice) (Figure 8(f)).
Figure 8.

Enalapril treatment was accompanied by a higher number of parietal epithelial cells staining for phospho-p44/42 MAPK (Erk1/2) (Thr202/Tyr204) (p-ERK) in experimental focal segmental glomerulosclerosis (FSGS). (a–e) Representative images of paired box gene 2 (PAX2)/p-ERK double staining at ×630 original magnification. (a) Normal mice: Arrows show PAX2+ cells along Bowman’s capsule. p-ERK 1/2 staining was not detected. (b) Mice with FSGS: Few PAX2+/p-ERK+ cells along Bowman’s capsule were detected (arrowhead). (c) Mice with FSGS + hydralazine: Few PAX2+/p-ERK+ cells along Bowman’s capsule were detected (arrowhead). (d) Mice with FSGS + enalapril: Arrowheads show PAX2+/p-ERK+ cells along Bowman’s capsule, arrow show PAX2+ cells along Bowman’s capsule. (e) View of the inset of that shown in (d). (f) The numbers of PECs with phosphorylated ERK, measured as the number of PAX2/p-ERK double positive cells/mm of Bowman’s capsule length per glomerular cross section increased at day 7 and day 14 in mice with FSGS (white column) and mice with FSGS given hydralazine (gray slash column). Enalapril treatment (black column) was associated with a further increase in this number both at day 7 and day 14. (f) The ratio of glomerular parietal epithelial cells (PECs) with phosphorylated ERK in total PECs per glomerulus along Bowman’s capsule increased at day 7 and day 14 in mice with FSGS (white column) and mice with FSGS given hydralazine (gray slash column). Enalapril treatment (black column) was associated with an increase in this ratio at day 7.
At day 14 of FSGS, the number of PAX2+/p-ERK+ cells increased along Bowman’s capsule in untreated mice (1.04±0.16 per Bowman’s capsule cross section, p < 0.001 vs. normal) and hydralazine treated mice with FSGS (1.03±0.13, p < 0.001 vs. normal) (Figure 8(f)). This was further increased by enalapril (1.46±0.19, p < 0.05, vs. hydralazine).
Next, in order to determine the relationship between p-ERK and transition cell proliferation, serial sections were consecutively double stained with PAX2/p-ERK and PAX2/Ki-67. As stated earlier, PEC number increased in experimental FSGS, but enalapril treatment did not further increase PEC number. There was no overlap between PAX2+/p-ERK+ staining and PAX2+/Ki-67+ staining in any group. Figure 9 shows examples from the enalapril-treated mice with FSGS.
Figure 9.

Parietal epithelial cells with phosphorylated extracellular-signal-regulated kinases (ERK), absence with Ki-67. (a–d): Representative images of paired box gene 2 (PAX2)/phospho-p44/42 MAPK (Erk1/2) (Thr202/Tyr204) (p-ERK) double staining (a, c) and PAX2/Ki-67 double staining (b, d) on serial sections from mice with focal segmental glomerulosclerosis (FSGS) given enalapril (×630 magnification). (a, c) Arrows show PAX2+/p-ERK+/Ki-67− cells along Bowman’s capsule, arrowheads show PAX2+/p-ERK−/Ki-67+ cells along Bowman’s capsule at day 7. (b, d) Arrows show PAX2+/p-ERK+/Ki-67− cells. Dashed black arrows show PAX2−/Ki-67+ cells outside glomerulus, indicating positive control at day 14.
These data suggest that enalapril increased the activation of the ERK pathway (measured by phospho-ERK staining) but not PEC proliferation.
Discussion
Inhibition of the individual components of the RAAS have been used successfully to lower proteinuria in diabetic and nondiabetic glomerular diseases4,5,39 as well as to limit, and even reverse, glomerular scarring.40 In the current study we show that the ACE-inhibitor enalapril augments the number of glomerular epithelial transition cells in experimental FSGS, which was accompanied by an increase in the number of podocytes and a decrease in glomerulosclerosis.
A large literature supports a direct effect of angiotensin II blockage by ACE-inhibitors on podocytes (and other kidney cells) (reviewed in Wennmann et al.9). These are typically protective and reparative in nature, including a decrease in apoptosis by enhancing survival pathways. Thus, at first blush one might assume that it has been well established that ACE-inhibition increases podocyte number following an overall depletion in their complement. However, a thorough review of the published English literature indicates that the effect of ACE-inhibition on reversing, or increasing, podocyte number is limited to one seminal publication, by Macconi and colleagues.11 In this well-performed study, they elegantly showed that although the MWF genetic rat strain studied was characterized by chronic podocyte depletion, rats also had a paradoxical increase in glomerular epithelial cells giving rise to crescents. In a follow-up manuscript, the percentage of glomeruli with crescents in this model was 76±4% at 60 weeks of age.12 Giving ACE-inhibitors to MWF rats aged 40 weeks restored podocyte number over the subsequent 20 weeks of treatment.12 Using WT-1 as a podocyte marker, the authors showed that WT-1 staining cells underwent significant proliferation (measured by ki-67 and bromodeoxyuridine (BrdU)) in rats given enalapril.12 Taken together, this informative study showed that administering ACE-inhibitors to MWF rats augmented podocyte proliferation and decreased crescent formation, which were associated with improved outcomes.
The administration of a cytotoxic antipodocyte antibody in the current study, which abruptly depletes podocyte number, is followed by the development of proteinuria, hypertension, focal glomerulosclerosis, synechial attachments between Bowman’s capsule and the glomerular tuft, and later tubular dilation and fibrosis. Thus, one might argue that the model used in the current study perhaps better represents classic FSGS, and is thus feasible to address the questions posed. This FSGS model differs significantly from other antibody-induced mouse models characterized by glomerular cell hyperplasia and pseudo-crescent formation, including a model we have used induced by a different antipodocyte antibody.19,41
The first major finding in the current study was that although podocyte number was abruptly depleted on average by 34% from normal at the time hydralazine and enalapril were first administered to FSGS mice, only diseased mice given enalapril had significant recovery in their podocyte number and density. The increase in podocyte number in enalapril-treated mice was not accompanied by an increase in DNA synthesis (measured by Ki-67+/p57+ double staining), suggesting another source for their replenishment. Noteworthy was that podocyte restoration correlated statistically with a significant reduction in the degree of glomerular scarring and urinary albumin-to-creatinine ratio, which did not occur in hydralazine- and water-treated animals.
In addition to the Macconi studies described above,11 there is only indirect evidence that RAAS inhibition might have an impact on podocyte number in states of depletion. Ihara et al. showed evidence of improved podocyte injury in Otsuka Long-Evans Tokushima Fatty (OLETF) rats given the angiotensin receptor blocker (ARB) olmesartan, but podocyte number was not quantitated.42 When Kavvadas et al. treated renin transgenic mice with a renin inhibitor, nephrin expression increased by 20%.43 The authors concluded that RAAS inhibition improved slit diaphragm integrity. Pichaiwong et al. showed that in the BtBr type 2 diabetic nephropathy model, ACE-inhibitors did not increase podocyte number, whereas replacing leptin did have a beneficial effect.26 Taken together, the current study is the first to show, at least in mice, that ACE-inhibitors increases podocyte number following abrupt depletion, and that this occurs in the absence of proliferation. Finally, Gagliardini and colleagues44 induced hyperglycemia in uninephrectomized rats, and showed that giving lisinopril alone limited podocyte depletion, but did not increase podocyte number. However, when given together with the endothelinA receptor antagonist avosentan, podocyte density increased.44
Benigni and colleagues were also the first to show the biological effects of ACE-inhibition on different PEC subpopulations.12 They showed in the MWF rat model that the characteristic crescents comprised three different PEC subpopulations, and that ACE-inhibitors reduced proliferation both of “parietal podocytes,” defined as cells along Bowman’s capsule co-expressing both PGP9.5 and WT-1, as well as “PEC progenitors,” defined as cells expressing neural cell adhesion molecule (NCAM) and claudin-1.12 However, these results seem to conflict with their earlier study in 2009 using the same rat strain, although different markers were used. In the earlier study, using the same markers to define “parietal podocytes,” the authors showed that enalapril increased the number of this PEC subpopulation. In an important recent follow-up study,13 Rizzo et al. showed that the “PEC progenitors” in this model express the AT1 receptor, which can be modulated by ACE-inhibition. They also showed that the SDF-1/CXCR4 pathway might underlie proliferation of this subpopulation, which participate in crescent formation.13
We have previously reported that the number of “glomerular epithelial transition cells,” defined as PAX2-stained cells along Bowman’s capsule co-expressing either the podocyte proteins WT-1 or synaptopodin, increases in this FSGS model.18,25 The second finding in the current study was that in mice given enalapril, the number of glomerular epithelial transition cells increased significantly. Although “transition cells” are detected in low numbers in normal glomeruli,13,45,46 and we and others have shown they increase in experimental and human glomerular diseases not characterized by crescents,13,18,25 their precise function remains unclear. In addition, using these definitions, we have previously reported that “transition cells” are also detected on the glomerular tuft in states of podocyte depletion, and that their number increases in the tuft coincident with an improvement in podocyte number in response to corticosteroid18 or retinoid25 therapy. Furthermore, the data in the current study show a statistically significant correlation between an increase in podocyte number and the number of glomerular epithelial transition cells. However, although it is tempting to speculate that these cells are indeed podocyte progenitors, there are no published data, to our knowledge, that robustly prove this notion. The differences in outcomes from the current studies and that of Benigni and colleagues might be explained by differences in species, animal models studied, and the duration of disease (acute versus chronic).
Recent data support a contrary view for the origin of transition cells along Bowman’s capsule co-expressing both PEC and podocyte proteins. Employing podocyte reporter mice in which collapsing FSGS was induced, Sakamoto and Nagata showed that labeled podocytes migrated to Bowman’s capsule, and that it was these cells that co-expressed PEC proteins.47 Moreover, using a PEC reporter mouse, Schulte et al. recently showed that PECs do not serve as podocyte progenitors in the models used.48 Finally, Wanner et al. was not able to demonstrate PEC progenitors in aging.49 Although the Romagnani group,50–52 as well as the Benigni12 and Rizzo13 groups have reported that a subpopulation of cells lining Bowman’s capsule in humans and rats co-express proteins that have been used in non-renal cells as markers of stemness, including CD24 and CD133, these are not expressed in mice, thus limiting the use of these markers in this species50. NCAM has been used as a marker for stemness for PECs in human and rat,12,13 but data using NCAM in mice are limited. In the current study, NCAM stained at low intensity in the majority of PECs in normal mice. Although the staining intensity increased in the FSGS model, the increase did not reach statistical significance in cells along Bowman’s capsule in the treatment groups. This does not detract from the results in any way.
The mechanisms underlying the higher number of “glomerular transition cells” in disease and the augmentation by enalapril are poorly understood. We considered proliferation, but there were no differences between untreated, hydralazine- and enalapril-treated mice with FSGS. We have considered enhanced survival, but apoptosis is not increased in PECs in this model, and thus is not a plausible explanation. Given that one of the biological effects of phospho-ERK is on differentiation,37,38 we examined ERK expression by immunostaining. Our results showed that phospho-ERK staining was barely detected in normal mouse glomeruli. However, following the onset of experimental FSGS, phospho-ERK staining increased in untreated and treated mice at days 7 and 14. Compared to hydralazine-treated mice, enalapril-treated mice had significantly more PECs expressing phospho-ERK. Noteworthy was that cells lining Bowman’s capsule that stained for phospho-ERK did not co-stain for the proliferation marker Ki-67. These results are consistent with the notion that enalapril increased phospho-ERK expression in the sub-population PECs that also de novo express WT-1, traditionally considered a marker for podocytes. This might be similar to the role of ERK in osteoblast differentiation.53 Phospho-ERK has numerous biological functions, which are likely context and cell dependent, which are beyond their traditional role in proliferation. For example, although ERK promotes proliferation,54 it can also be a tumor suppressor.55 Several studies have also shown a cell survival role for phospho-ERK, including serving this role in PECs.56 Taken further, the results of the current study lead one to speculate that the increase in phospho-ERK underlies the increase in glomerular epithelial transition cells in the enalapril-treated animals with disease.
A recent series of impressive studies by Peired and colleagues showed that proteinuria directly reduces the ability of PEC stem/progenitors to regenerate.57 These studies lead one to consider that the reduction in proteinuria by ACE-inhibition improves overall PEC function. Rizzo showed that PEC progenitors in humans and rats express the angiotensin type I receptor, and that reducing levels with an ACE-inhibitor leads to more favorable outcomes.13
Finally, we are left asking what is the biological significance of the current results, and how does this impact our thoughts clinically? First, this study clearly demonstrates that the clinical and pathophysiological benefits of ACE-inhibition are to increase podocyte number following an abrupt decline in podocyte number. This is independent of cell proliferation. Second, improving podocyte number reduces glomerulosclerosis, thus providing additional mechanisms whereby ACE-inhibition augments glomerular repair. This might seem intuitive, but the published data connecting these have derived almost exclusively from studies in which podocyte depletion occurs as the primary event, rather than improving podocyte number. Thus, the mechanism whereby increasing podocyte number, limits glomerulosclerosis is not well delineated. It likely is a function that the higher the podocyte number the lower the degree of glomerulosclerosis. Third, ACE-inhibition has effects on the expression of several proteins in subpopulations of cells lining Bowman’s capsule, including podocyte markers. The precise biological significance was not tested. Fourth, the increase in cells along Bowman’s capsule co-expressing WT-1 and phospho-ERK suggests that ERK might be a common pathway required for PEC differentiation, as we have recently reported that phospho-ERK is also increased in PECs exposed to steroids.18 Although there was no statistical difference in systolic BP between the treatment groups, systolic BP tended to be lower in enalapril-treated mice with FSGS. The clinical significance of this, in the current context, is unknown.
In summary, following an abrupt decline in podocyte number, ACE-inhibition enhances podocyte regeneration, which is accompanied by a lack of proliferation but an increase in the number of PECs expressing podocyte proteins, and active ERK. A higher podocyte number in enalapril-treated mice is accompanied by a lower magnitude of glomerular scarring.
Acknowledgments
Funding
JZ was funded by an International Society of Nephrology fellowship. SJS was supported by grants from the National Institutes of Health R01DK056799, R21DK081835. ZHL was supported by grants from the National Basic Research Program of China 973 Program 2012CB517600, and the National Science Foundation of China 81320108007.
Glossary
- PEC
glomerular parietal epithelial cell
- FSGS
focal segmental glomerulosclerosis
- ERK
extracellular-signal-regulated kinases
- p-ERK
phospho-p44/42 MAPK (Erk1/2) (Thr202/Tyr204)
- PAX2
paired box gene 2
- WT-1
Wilm’s tumor suppressor protein-1
Footnotes
Conflict of interest
None declared.
References
- 1.Loriga G, Vidili G, Ruggenenti P, et al. Renal hemodynamics and renoprotection. Nephron Clin Pract. 2008;110:c213–c219. doi: 10.1159/000167868. [DOI] [PubMed] [Google Scholar]
- 2.Nishiyama A, Tamaki T, Masumura H, et al. Effects of semotiadil fumarate (SD-3211) on renal hemodynamics and function in dogs. Eur J Pharmacol. 1992;218:311–317. doi: 10.1016/0014-2999(92)90184-6. [DOI] [PubMed] [Google Scholar]
- 3.Ito S. Cardiorenal connection in chronic kidney disease. Clin Exp Nephrol. 2012;16:8–16. doi: 10.1007/s10157-011-0493-2. [DOI] [PubMed] [Google Scholar]
- 4.Brenner BM, Cooper ME, de Zeeuw D, et al. Effects of losartan on renal and cardiovascular outcomes in patients with type 2 diabetes and nephropathy. N Engl J Med. 2001;345:861–869. doi: 10.1056/NEJMoa011161. [DOI] [PubMed] [Google Scholar]
- 5.Lewis EJ, Hunsicker LG, Clarke WR, et al. Renoprotective effect of the angiotensin-receptor antagonist irbesartan in patients with nephropathy due to type 2 diabetes. N Engl J Med. 2001;345:851–860. doi: 10.1056/NEJMoa011303. [DOI] [PubMed] [Google Scholar]
- 6.Langham RG, Kelly DJ, Cox AJ, et al. Proteinuria and the expression of the podocyte slit diaphragm protein, nephrin, in diabetic nephropathy: Effects of angiotensin converting enzyme inhibition. Diabetologia. 2002;45:1572–1576. doi: 10.1007/s00125-002-0946-y. [DOI] [PubMed] [Google Scholar]
- 7.Kelly DJ, Aaltonen P, Cox AJ, et al. Expression of the slit-diaphragm protein, nephrin, in experimental diabetic nephropathy: Differing effects of anti-proteinuric therapies. Nephrol Dial Transplant. 2002;17:1327–1332. doi: 10.1093/ndt/17.7.1327. [DOI] [PubMed] [Google Scholar]
- 8.Nijenhuis T, Sloan AJ, Hoenderop JG, et al. Angiotensin II contributes to podocyte injury by increasing TRPC6 expression via an NFAT-mediated positive feedback signaling pathway. Am J Pathol. 2011;179:1719–1732. doi: 10.1016/j.ajpath.2011.06.033. [DOI] [PMC free article] [PubMed] [Google Scholar]
- 9.Wennmann DO, Hsu HH, Pavenstadt H. The renin-angiotensin-aldosterone system in podocytes. Semin Nephrol. 2012;32:377–384. doi: 10.1016/j.semnephrol.2012.06.009. [DOI] [PubMed] [Google Scholar]
- 10.Camici M, Carpi A, Cini G, et al. Podocyte dysfunction in aging-related glomerulosclerosis. Front Biosci (Schol Ed) 2011;3:995–1006. doi: 10.2741/204. [DOI] [PMC free article] [PubMed] [Google Scholar]
- 11.Macconi D, Sangalli F, Bonomelli M, et al. Podocyte repopulation contributes to regression of glomerular injury induced by ACE inhibition. Am J Pathol. 2009;174:797–807. doi: 10.2353/ajpath.2009.080227. [DOI] [PMC free article] [PubMed] [Google Scholar]
- 12.Benigni A, Morigi M, Rizzo P, et al. Inhibiting angiotensin-converting enzyme promotes renal repair by limiting progenitor cell proliferation and restoring the glomerular architecture. Am J Pathol. 2011;179:628–638. doi: 10.1016/j.ajpath.2011.04.003. [DOI] [PMC free article] [PubMed] [Google Scholar]
- 13.Rizzo P, Perico N, Gagliardini E, et al. Nature and mediators of parietal epithelial cell activation in glomerulonephritides of human and rat. Am J Pathol. 2013;183:1769–1778. doi: 10.1016/j.ajpath.2013.08.008. [DOI] [PubMed] [Google Scholar]
- 14.Wiggins RC. The spectrum of podocytopathies: A unifying view of glomerular diseases. Kidney Int. 2007;71:1205–1214. doi: 10.1038/sj.ki.5002222. [DOI] [PubMed] [Google Scholar]
- 15.Wharram BL, Goyal M, Wiggins JE, et al. Podocyte depletion causes glomerulosclerosis: Diphtheria toxin-induced podocyte depletion in rats expressing human diphtheria toxin receptor transgene. J Am Soc Nephrol. 2005;16:2941–2952. doi: 10.1681/ASN.2005010055. [DOI] [PubMed] [Google Scholar]
- 16.Matsusaka T, Xin J, Niwa S, et al. Genetic engineering of glomerular sclerosis in the mouse via control of onset and severity of podocyte-specific injury. J Am Soc Nephrol. 2005;16:1013–1023. doi: 10.1681/ASN.2004080720. [DOI] [PubMed] [Google Scholar]
- 17.Kriz W. Podocyte is the major culprit accounting for the progression of chronic renal disease. Microsc Res Tech. 2002;57:189–195. doi: 10.1002/jemt.10072. [DOI] [PubMed] [Google Scholar]
- 18.Zhang J, Pippin JW, Krofft RD, et al. Podocyte repopulation by renal progenitor cells following glucocorticoids treatment in experimental FSGS. Am J Physiol Renal Physiol. 2013;304:F1375–F1389. doi: 10.1152/ajprenal.00020.2013. [DOI] [PMC free article] [PubMed] [Google Scholar]
- 19.Griffin SV, Krofft RD, Pippin JW, et al. Limitation of podocyte proliferation improves renal function in experimental crescentic glomerulonephritis. Kidney Int. 2005;67:977–986. doi: 10.1111/j.1523-1755.2005.00161.x. [DOI] [PubMed] [Google Scholar]
- 20.Logar CM, Brinkkoetter PT, Krofft RD, et al. Darbepoetin alfa protects podocytes from apoptosis in vitro and in vivo. Kidney Int. 2007;72:489–498. doi: 10.1038/sj.ki.5002362. [DOI] [PubMed] [Google Scholar]
- 21.Vaughan MR, Pippin JW, Griffin SV, et al. ATRA induces podocyte differentiation and alters nephrin and podocin expression in vitro and in vivo. Kidney Int. 2005;68:133–144. doi: 10.1111/j.1523-1755.2005.00387.x. [DOI] [PubMed] [Google Scholar]
- 22.Ohse T, Vaughan MR, Kopp JB, et al. De novo expression of podocyte proteins in parietal epithelial cells during experimental glomerular disease. Am J Physiol Renal Physiol. 2010;298:F702–F711. doi: 10.1152/ajprenal.00428.2009. [DOI] [PMC free article] [PubMed] [Google Scholar]
- 23.Pippin JW, Brinkkoetter PT, Cormack-Aboud FC, et al. Inducible rodent models of acquired podocyte diseases. Am J Physiol Renal Physiol. 2009;296:F213–F229. doi: 10.1152/ajprenal.90421.2008. [DOI] [PubMed] [Google Scholar]
- 24.Taniguchi Y, Pippin JW, Hagmann H, et al. Both cyclin I and p35 are required for maximal survival benefit of cyclin-dependent kinase 5 in kidney podocytes. Am J Physiol Renal Physiol. 2012;302:F1161–F1171. doi: 10.1152/ajprenal.00614.2011. [DOI] [PMC free article] [PubMed] [Google Scholar]
- 25.Zhang J, Pippin JW, Vaughan MR, et al. Retinoids augment the expression of podocyte proteins by glomerular parietal epithelial cells in experimental glomerular disease. Nephron Exp Nephrol. 2012;121:e23–e37. doi: 10.1159/000342808. [DOI] [PMC free article] [PubMed] [Google Scholar]
- 26.Pichaiwong W, Hudkins KL, Wietecha T, et al. Reversibility of structural and functional damage in a model of advanced diabetic nephropathy. J Am Soc Nephrol. 2013;24:1088–1102. doi: 10.1681/ASN.2012050445. [DOI] [PMC free article] [PubMed] [Google Scholar]
- 27.Guo S, Kowalewska J, Wietecha TA, et al. Reninangiotensin system blockade is renoprotective in immune complex-mediated glomerulonephritis. J Am Soc Nephrol. 2008;19:1168–1176. doi: 10.1681/ASN.2007050607. [DOI] [PMC free article] [PubMed] [Google Scholar]
- 28.Marshall CB, Krofft RD, Blonski MJ, et al. Role of smooth muscle protein SM22alpha in glomerular epithelial cell injury. Am J Physiol Renal Physiol. 2011;300:F1026–F1042. doi: 10.1152/ajprenal.00187.2010. [DOI] [PMC free article] [PubMed] [Google Scholar]
- 29.Pippin JW, Sparks MA, Glenn ST, et al. Cells of renin lineage are progenitors of podocytes and parietal epithelial cells in experimental glomerular disease. Am J Pathol. 2013;183:542–557. doi: 10.1016/j.ajpath.2013.04.024. [DOI] [PMC free article] [PubMed] [Google Scholar]
- 30.Zhang J, Hansen KM, Pippin JW, et al. De novo expression of podocyte proteins in parietal epithelial cells in experimental aging nephropathy. Am J Physiol Renal Physiol. 2012;302:F571–F580. doi: 10.1152/ajprenal.00516.2011. [DOI] [PMC free article] [PubMed] [Google Scholar]
- 31.Urruticoechea A, Smith IE, Dowsett M. Proliferation marker Ki-67 in early breast cancer. J Clin Oncol. 2005;23:7212–7220. doi: 10.1200/JCO.2005.07.501. [DOI] [PubMed] [Google Scholar]
- 32.Ophascharoensuk V, Pippin JW, Gordon KL, et al. Role of intrinsic renal cells versus infiltrating cells in glomerular crescent formation. Kidney Int. 1998;54:416–425. doi: 10.1046/j.1523-1755.1998.00003.x. [DOI] [PubMed] [Google Scholar]
- 33.Brinkkoetter PT, Wu JS, Ohse T, et al. p35, the non-cyclin activator of Cdk5, protects podocytes against apoptosis in vitro and in vivo. Kidney Int. 2010;77:690–699. doi: 10.1038/ki.2009.548. [DOI] [PubMed] [Google Scholar]
- 34.Hunter MG, Hurwitz S, Bellamy CO, et al. Quantitative morphometry of lupus nephritis: The significance of collagen, tubular space, and inflammatory infiltrate. Kidney Int. 2005;67:94–102. doi: 10.1111/j.1523-1755.2005.00059.x. [DOI] [PubMed] [Google Scholar]
- 35.Jarad G, Pippin JW, Shankland SJ, et al. Dystroglycan does not contribute significantly to kidney development or function, in health or after injury. Am J Physiol Renal Physiol. 2011;300:F811–F820. doi: 10.1152/ajprenal.00725.2010. [DOI] [PMC free article] [PubMed] [Google Scholar]
- 36.Smeets B, Kuppe C, Sicking EM, et al. Parietal epithelial cells participate in the formation of sclerotic lesions in focal segmental glomerulosclerosis. J Am Soc Nephrol. 2011;22:1262–1274. doi: 10.1681/ASN.2010090970. [DOI] [PMC free article] [PubMed] [Google Scholar]
- 37.Roskoski R., Jr ERK1/2 MAP kinases: Structure, function, and regulation. Pharmacol Res. 2012;66:105–143. doi: 10.1016/j.phrs.2012.04.005. [DOI] [PubMed] [Google Scholar]
- 38.Cheng P, Alberts I, Li X. The role of ERK1/2 in the regulation of proliferation and differentiation of astrocytes in developing brain. Int J Dev Neurosci. 2013;31:783–789. doi: 10.1016/j.ijdevneu.2013.09.008. [DOI] [PubMed] [Google Scholar]
- 39.Cheng J, Zhang W, Zhang XH, et al. ACEI/ARB therapy for IgA nephropathy: A meta analysis of randomised controlled trials. Int J Clin Pract. 2009;63:880–888. doi: 10.1111/j.1742-1241.2009.02038.x. [DOI] [PubMed] [Google Scholar]
- 40.Tanaka R, Kon V, Yoshioka T, et al. Angiotensin converting enzyme inhibitor modulates glomerular function and structure by distinct mechanisms. Kidney Int. 1994;45:537–543. doi: 10.1038/ki.1994.69. [DOI] [PubMed] [Google Scholar]
- 41.Griffin SV, Hiromura K, Pippin J, et al. Cyclin-dependent kinase 5 is a regulator of podocyte differentiation, proliferation, and morphology. Am J Pathol. 2004;165:1175–1185. doi: 10.1016/S0002-9440(10)63378-0. [DOI] [PMC free article] [PubMed] [Google Scholar]
- 42.Ihara G, Kiyomoto H, Kobori H, et al. Regression of superficial glomerular podocyte injury in type 2 diabetic rats with overt albuminuria: Effect of angiotensin II blockade. J Hypertens. 2010;28:2289–2298. doi: 10.1097/HJH.0b013e32833dfcda. [DOI] [PMC free article] [PubMed] [Google Scholar]
- 43.Kavvadas P, Weis L, Abed AB, et al. Renin inhibition reverses renal disease in transgenic mice by shifting the balance between profibrotic and antifibrotic agents. Hypertension. 2013;61:901–907. doi: 10.1161/HYPERTENSIONAHA.111.00639. [DOI] [PubMed] [Google Scholar]
- 44.Gagliardini E, Corna D, Zoja C, et al. Unlike each drug alone, lisinopril if combined with avosentan promotes regression of renal lesions in experimental diabetes. Am J Physiol Renal Physiol. 2009;297:F1448–F1456. doi: 10.1152/ajprenal.00340.2009. [DOI] [PubMed] [Google Scholar]
- 45.Bariety J, Mandet C, Hill GS, et al. Parietal podocytes in normal human glomeruli. J Am Soc Nephrol. 2006;17:2770–2780. doi: 10.1681/ASN.2006040325. [DOI] [PubMed] [Google Scholar]
- 46.Romagnani P. Family portrait: Renal progenitor of Bowman’s capsule and its tubular brothers. Am J Pathol. 2011;178:490–493. doi: 10.1016/j.ajpath.2010.11.044. [DOI] [PMC free article] [PubMed] [Google Scholar]
- 47.Sakamoto K, Ueno T, Kobayashi N, et al. The direction and role of phenotypic transition between podocytes and parietal epithelial cells in focal segmental glomerulosclerosis. Am J Physiol Renal Physiol. 2014;306:F98–F104. doi: 10.1152/ajprenal.00228.2013. [DOI] [PMC free article] [PubMed] [Google Scholar]
- 48.Schulte K, Berger K, Boor P, et al. Origin of parietal podocytes in atubular glomeruli mapped by lineage tracing. J Am Soc Nephrol. 2014;25:129–141. doi: 10.1681/ASN.2013040376. [DOI] [PMC free article] [PubMed] [Google Scholar]
- 49.Wanner N, Hartleben B, Herbach N, et al. Unraveling the role of podocyte turnover in glomerular aging and injury. J Am Soc Nephrol. 2014;25:707–716. doi: 10.1681/ASN.2013050452. [DOI] [PMC free article] [PubMed] [Google Scholar]
- 50.Angelotti ML, Lazzeri E, Lasagni L, et al. Only anti-CD133 antibodies recognizing the CD133/1 or the CD133/2 epitopes can identify human renal progenitors. Kidney Int. 2010;78:620–621. doi: 10.1038/ki.2010.243. author reply 621. [DOI] [PubMed] [Google Scholar]
- 51.Lasagni L, Ballerini L, Angelotti ML, et al. Notch activation differentially regulates renal progenitors proliferation and differentiation toward the podocyte lineage in glomerular disorders. Stem Cells. 2010;28:1674–1685. doi: 10.1002/stem.492. [DOI] [PMC free article] [PubMed] [Google Scholar]
- 52.Smeets B, Angelotti ML, Rizzo P, et al. Renal progenitor cells contribute to hyperplastic lesions of podocytopathies and crescentic glomerulonephritis. J Am Soc Nephrol. 2009;20:2593–2603. doi: 10.1681/ASN.2009020132. [DOI] [PMC free article] [PubMed] [Google Scholar]
- 53.Greenblatt MB, Shim JH, Glimcher LH. Mitogen-activated protein kinase pathways in osteoblasts. Annu Rev Cell Dev Biol. 2013;29:63–79. doi: 10.1146/annurev-cellbio-101512-122347. [DOI] [PubMed] [Google Scholar]
- 54.Chambard JC, Lefloch R, Pouyssegur J, et al. ERK implication in cell cycle regulation. Biochim Biophys Acta. 2007;1773:1299–1310. doi: 10.1016/j.bbamcr.2006.11.010. [DOI] [PubMed] [Google Scholar]
- 55.Deschenes-Simard X, Gaumont-Leclerc MF, Bourdeau V, et al. Tumor suppressor activity of the ERK/MAPK pathway by promoting selective protein degradation. Genes Dev. 2013;27:900–915. doi: 10.1101/gad.203984.112. [DOI] [PMC free article] [PubMed] [Google Scholar]
- 56.Chang AM, Ohse T, Krofft RD, et al. Albumin-induced apoptosis of glomerular parietal epithelial cells is modulated by extracellular signal-regulated kinase 1/2. Nephrol Dial Transplant. 2012;27:1330–1343. doi: 10.1093/ndt/gfr483. [DOI] [PMC free article] [PubMed] [Google Scholar]
- 57.Peired A, Angelotti ML, Ronconi E, et al. Proteinuria impairs podocyte regeneration by sequestering retinoic acid. J Am Soc Nephrol. 2013;24:1756–1768. doi: 10.1681/ASN.2012090950. [DOI] [PMC free article] [PubMed] [Google Scholar]