Abstract
Objectives
The purpose of this study was to determine the demographic and pharmacogenetic covariates that influence the disposition of efavirenz (EFV) and its major metabolites. Methods: A population pharmacokinetic (PK) model was developed from a randomized, cross-over, drug-interaction study in healthy male Korean subjects (n=17). Plasma concentrations of EFV and its hydroxy-metabolites (0–120 hrs) were measured by LC/MS/MS. Genomic DNA was genotyped for variants in the cytochrome P450 (CYP) 2A6, 2B6, 3A5 and MDR1 genes. A PK model was built in a stepwise procedure using nonlinear mixed effect modeling in NONMEM 7. The covariate model was built using the generalized additive modeling and forward selection-backward elimination. Model-based simulations were performed to predict EFV steady-state concentrations following 200, 400, and 600 mg daily oral dose among different CYP2B6 genotypes
Results
The final model included only CYP2B6 genotype as covariate that predicts EFV clearance through the formation of 8-OH EFV that represented 65% to 80% of EFV clearance. The total clearance of EFV in CYP2B6*6/*6 genotype was ~ 30% lower than CYP2B6*1/*1 or CYP2B6*1/*6 alleles (P<0.001). Clopidogrel reduced both formation and elimination clearances of 8-OH EFV by 22% and 19% respectively (P= 0.033 and 0.041). Other demographics and genotype of accessory CYP pathways did not predict EFV or metabolites PK.
Conclusion
CYP2B6 genotype was the only significant predictor of EFV disposition. The developed model may serve as the foundation for further exploration of pharmacogenetic-based dosing of EFV.
Keywords: Efavirenz, pharmacogenomics, CYP2B6, metabolites, pharmacokinetics
INTRODUCTION
Efavirenz (EFV) is a non-nucleoside reverse transcriptase inhibitor (NNRTI) used in combination with 2 NRTs as a first line treatment of human immunodeficiency virus (HIV) type 1 infection in treatment naïve patients. Despite favorable antiviral efficacy, clinical response and adverse effects of EFV varies widely among individuals. Efavirenz has a narrow therapeutic range at steady-state, with some investigators recommending between 1 to 4 mg/L.1 This along with the considerable between subject variability (BSV) in its pharmacokinetics compromises prediction of EFV associated adverse effects and clinical outcomes.1–4 Indeed concentrations below 1 mg/L have been associated with an increased risk for viral resistance and therapeutic failure, while concentrations above 4 mg/L have been associated with an increased risk for the development of central nervous system (CNS) toxicity, hepatic toxicity and treatment discontinuation.1 Thus identifying sources of EFV pharmacokinetic variability is important to improve therapeutic efficacy while decreasing EFV-mediated adverse effects.
Efavirenz is predominantly cleared by hepatic metabolism to pharmacologically inactive metabolites, predominantly through cytochrome P450 (CYP) 2B6-mediated 8-hydroxylation to 8-hydroxyefavirenz (8-OH EFV).5 Additional enzymes including CYP1A2, CYP2A6, and CYP3A4/5 show activity in vitro towards EFV 8-hydroxylation.5,6 Additional minor metabolic pathways include EFV hydroxylation to the 7-OH EFV metabolite, mediated by CYP2A6,6 and N-glucuronidation mediated by UGT2B7 to EFV N-glucuronide.7 The hydroxyl metabolites undergo further metabolism to di-hydroxyl EFV which is also catalyzed by CYP2B6 or excreted after conjugation (sulfation and glucuronidation).6,8
The CYP2B6 gene is highly polymorphic, with 38 alleles and multiple sub-alleles and single nucleotide polymorphisms identified (http://www.cypalleles.ki.se/cyp2b6.htm; accessed October 2013). Among these variants, the CYP2B6*6 allele is the most frequent across different populations and is functionally relevant.9,10 Several studies in healthy volunteers and HIV patients have demonstrated that this variant is associated with increased EFV exposure, higher incidence of CNS and hepatic toxicity as well as treatment discontinuation.2,11–15 The contribution of CYP2A6, CYP3A and UGT2B7 and their potential impact on the overall pharmacokinetic variability in EFV in vivo seems relatively small, with some studies demonstrating an effect while others do not. 6,7,16–20 The inter-individual variability in EFV pharmacokinetics may also be attributed to differences in the ability of EFV to induce its own metabolism, via induction of CYP2B6 and possibly other enzymes involved in its metabolism.21–24
The effects of genetics and covariates on the variability of EFV pharmacokinetics and exposure have been explored previously.18,25–29 However, there are no reports that incorporate the hydroxyl metabolites of EFV into a pharmacogenetic-based covariate analysis. Incorporation of the hydroxyl EFV metabolites into a covariate model may increase the sensitivity to identify relevant CYP enzymes that contribute to the inter-individual variability in the pharmacokinetics of EFV and provide mechanistic information regarding the in vivo contributions of the enzymes catalyzing efavirenz metabolism. Therefore, the objectives of this study were to develop a pharmacogenetic-based pharmacokinetic model that simultaneously describes disposition of EFV and its major metabolites as well as characterize the contribution of demographic and pharmacogenomic covariates to inter-patient variability in EFV pharmacokinetics.
Consequently, the model based prediction of EFV steady state concentrations were generated using this final covariate model among different CYP genotype groups following the conventional (600mg) and reduced (200 and 400 mg) EFV dosage regimens. Ultimately, adequate prediction of EFV steady-state concentrations from pharmacogenetic information may aid in optimizing EFV therapeutic outcomes through managing inter-patient variability in its exposure.
METHODS
Study Design
This population pharmacokinetic analysis was performed using data from a randomized cross-over drug interaction study of EFV with clopidogrel, and itraconazole in healthy, Korean volunteers.30 The study was approved by the Institutional Review Board of Inje University Busan Paik Hospital, Korea, and each subject signed a written informed consent. Subjects were excluded from the study for any of the following reasons: allergy to EFV, intake of prescription or non-prescription medications or herbal supplements for the duration of the study, hemoglobin concentration less than 12.5 mg/dl, history of bleeding, hematological disorders, in addition to any clinically significant abnormality in the initial screening evaluation. Initial screening evaluation included medical history, physical examination, routine serum chemistry, and urinalysis test results.
Subjects were administered 75 mg of clopidogrel per day for four days, itraconazole 200 mg/day for six days, or placebo prior to EFV. A single 200 mg dose of EFV was administered orally one hour following the last dose of clopidogel, itraconazole, or placebo. Study phases were separated by an 8-week wash out period. A total of 663 venous blood samples were obtained from 17 subjects (13 samples per subject per phase) immediately before and 1, 2, 3, 4, 5, 6, 8, 10, 12, and 24, 48, 72, and 120 hours after EFV administration. , Data obtained from the itraconazole phase were not used in this study since no interaction was found, as previously reported.30
DNA was extracted from whole blood and genotyping was performed by pyrosequencing for functionally important single nucleotide polymorphisms (SNPs) that define CYP2A6 (*4, *7, *9 and *15), CYP2B6 (*4, *6 and *9), CYP3A5 (*1 and *3) alleles, and SNPs 2677G/A/T and 3435C/T in MDR1, as previously reported.30
Drug Assays
Efavirenz and its hydroxyl metabolites (7-OH EFV; 8-OH EFV; and 8,14-OH EFV) were extracted after incubation with β-glucuronidase and analyzed by liquid chromatography-tandem mass spectrometry (LC/MS/MS), as previously reported.30 Samples were analyzed in triplicate using an API 3000 LC/MS/MS system (Applied Biosystems, Foster City, USA) equipped with an Agilent 1100 series HPLC system (Agilent, Wilmington, DE). Chromatographic separation of the compounds was accomplished by use of a Luna C18 column (2.0 × 100 mm, 3 μm; Phenomenex, Torrance, CA), with a 20 mM ammonium acetate buffer (pH 3.8) and acetonitrile (1:9 [vol]/[vol]) at a flow rate of 0.2 mL/min. EFV and metabolite concentrations were obtained. The lower limits of quantification for EFV and its metabolites was 3 ng/mL. The inter-assay precision values for all of the samples were less than 25%.
Model Development
Population pharmacokinetic analysis was performed using nonlinear mixed-effects modeling in NONMEM version 7 (ICON Development Solutions, Ellicott City, MD, USA). The ADVAN6 subroutine (general subroutine allows coding of the model differential equations) was selected to code for the tested models. First-order conditional estimation (FOCE) with interaction was used to estimate the model parameters, within- and between subject variability. Evaluated models were discriminated based on the change in the objective function value (OFV) and goodness of fit diagnostic plots (individual plots, residual plots, and observed versus predicted plasma concentration). Development of the final pharmacokinetic model was done in two steps: building the basic structural pharmacokinetic model that describes the disposition of EFV and the hydroxyl metabolites; and then selection of the significant covariates to be included in the final model.
The structural pharmacokinetic model was built sequentially starting with the EFV and followed by the metabolites. One- and two-compartment models with first order elimination were compared with several types of absorption profiles for EFV, including direct and sequential absorption with and without a lag time. Once the optimal model was selected for EFV, the model was expanded to allow for simultaneous modeling of the formed metabolites. One- and two-compartment models were evaluated to best describe metabolites disposition following first order metabolic transformation based on the proposed metabolic pathways. The final structural base model included the parent EFV with the 7-OH and 8-OH EFV metabolites. The model would not converge in the presence of the 8,14-OH metabolite when all parameters were estimated. A separate model was developed that included the 8-OH and 8,14-OH EFV metabolites (data not presented).
The effect of clopidogrel on all the described clearances was assessed by including an inhibition parameter (INH) as shown in the following equation:
Where θ is the population estimate, CLO represents the study phase with values of 0 in control phase or 1 in clopidogrel phase, and η is the between subject variability.
Covariate Model
The structural base model was used to evaluate the potential contribution of individual-specific covariates to describe the observed variability in the pharmacokinetics of EFV and its metabolites. The covariates tested included subject height, weight, and genotypes of CYP2A6, CYP2B6, CYP3A5, and MDR1variants. The final covariate model was built in two steps. Potential covariates were identified using a generalized additive model (GAM) building approach and followed by stepwise forward selection and backward elimination of the covariates using NONMEM. The GAM was performed using XPOSE (ver. 4.3.2) in R (ver. 2.11.1). Univariate linear regression was performed on the estimated pharmacokinetic parameter estimates with covariates in a stepwise fashion. In each step the covariate that resulted in the largest decrease in the Akaike Information Criterion (AIC) was retained in the model. The potential covariates that were determined by GAM were then tested in NONMEM using the stepwise forward selection and backward elimination approach. In this method covariate-parameter relationships were evaluated stepwise (i.e. single covariate and single parameter in each step). The covariate that resulted in the greatest statistically significant decrease in the OFV was kept in the model and remaining significant covariates were added in the same fashion. The ΔOFV follows a chi-square distribution where a change of 3.84 (df=1) or 5.99 (df=2) is statistically significant at α = 0.05. A p-value of 0.20 was used for the backward elimination procedure. Only one statistically significant covariate (CYP2B6) was included in the model.
Model Evaluation
The adequacy of the model fitting was evaluated by individual concentration-time profiles, predicted versus observed concentrations and weighted residuals versus predicted concentrations. The predictive accuracy of the final model for the observed data was evaluated by constructing visual predictive checks (VPC) using R (ver. 2.11.1). The final model was used to simulate 1000 hypothetical subjects using the same study design. Plasma concentrations of EFV and its 2 metabolites were simulated for 120 hours after oral administration of 200mg EFV dose in the absence and the presence of clopidogrel. The 90% prediction interval was constructed by plotting the 5th and 95th percentiles of the simulated concentration-time profiles.
Pharmacokinetic Simulations
The final covariate pharmacokinetic model was used to perform population simulations in NONMEM to predict steady state EFV plasma concentrations under various conditions. Efavirenz 600 mg daily is the recommended starting dose, however reduced doses of 200 and 400 mg daily has demonstrated success in patients that present with high EFV serum concentrations.31–33 Steady state EFV plasma concentrations following 200, 400, and 600 mg daily EFV doses were simulated up to a 8 weeks in each CYP2B6 genotype.
Steady administration of EFV may induce CYP2B6 activity and thereby increase its own metabolism and clearance with multiple doses.21,22,34 Therefore, an auto-induction component was added to the final model based on the model by Zhu et al.22 The model was modified according to the following equation:
Where (CL/FEFV)1 and (CL/F)EFV,SS are EFV clearances at day 1 and steady state respectively. AImax is the maximal change of clearance from baseline and T50 is the time to reach 50% of the AImax. AImax is represented as (A) ×(CL/FEFV)1, where (A) was the proportionality constant that represents fold change in clearance and it has values of 0, 1.9 or 2.7 based on the reported change in EFV clearance among different CYP2B6 genotypes; CYP2B6*6/*6, CYP2B6*1/*6 and CYP2B6*1/*1 respectively.35
Statistics
Estimated pharmacokinetic parameters were compared between three subgroups categorized by CYP2B6 genotype. Normality of the parameters was investigated using the Shapiro-Wilk W-test. Normally distributed parameters were compared using a one-way ANOVA test and the Kruskal-Wallis test was used for non-normally distributed parameters. When statistically significant differences were observed between the subgroups, a post-hoc analysis was performed using Bonferroni correction or the nonparametric Mann-Whitney U test. All statistical analyses were performed at level of significance of 5%. Statistical analyses were performed using PASW statistics 18, release Version 18.0.0 (Ó SPSS, Inc., 2009, Chicago, IL).
RESULTS
Seventeen healthy, Korean male subjects completed both study phases and were included in the final analysis. Table 1 summarizes the characteristics of study subjects and CYP genotype frequencies. CYP2A6 genotypes were categorized into normal, intermediate and slow metabolizers according to the reported genotype-predicted functional change.16 The same categorization was made for CYP2B6 genotypes, while CYP3A5 were categorized as expressers and nonexpressers. The frequency of CYP2A6, CYP2B6, CYP3A5, and ABCB1 are listed in Table 1. The allelic frequencies were in Hardy-Weinberg equilibrium.
Table 1.
Study population demographics
| Characteristics | Mean (SD) | ||
|---|---|---|---|
| Height (m) | 1.73 (0.04) | ||
| Body Weight (Kg) | 70.9 (7.7) | ||
| Body Mass Index (Kg/m2) | 23.5 (2.4) | ||
| CYP2A6 | n (%) | ||
| *1/*1 | 5 | Normal | 5 (29.4%) |
| *1/*7 | 1 | Intermediate | 6 (35.3%) |
| *1/*9 | 5 | ||
| *1/*4 | 3 | Slow | 6 (35.3%) |
| *1/*15 | 1 | ||
| *9/*9 | 1 | ||
| *9/*15 | 1 | ||
| CYP2B6 | |||
| *1/*1 | 6 (35.3%) | ||
| *1/*6 | 6 (35.3%) | ||
| *6/*6 | 5 (29.4%) | ||
| CYP3A5 | |||
| *1/*1 | 2 (11.8%) | ||
| *1/*3 | 4 (23.5%) | ||
| *3/*3 | 11 (64.7%) | ||
| MDR1 2577G/A/T | |||
| GG | 5 (29.4%) | ||
| GA | 3 (17.6%) | ||
| GT | 3 (17.6%) | ||
| AA | 1 (5.8%) | ||
| TT | 3 (17.6%) | ||
| TA | 2 (11.8%) | ||
| MDR1 3435C/T | |||
| CC | 12 (70.6) | ||
| CT | 3 (17.6%) | ||
| TT | 2 (11.8%) | ||
Structural Pharmacokinetic Model Development
A structural pharmacokinetic model was developed that describes the disposition of EFV and its major metabolites (7-OH EFV and 8-OH EFV) following oral administration of a single 200 mg EFV dose. Efavirenz disposition was characterized by a two compartment model following first order absorption incorporating a lag time as illustrated in Figure 1. Elimination of EFV from the central compartment was characterized by the first order formation of both hydroxyl-metabolites (CLf1/F, CLf2/F) and a first order non-metabolic clearance (CLother/F). A one compartment model was sufficient to describe each of the hydroxyl-metabolites. The volumes of distribution for the formed metabolites (Vm1 and Vm2) were fixed to 10 L. Clearance of both formed metabolites was described by first order elimination (CLm1, CLm2). In the presence of clopidogrel, the inhibition parameter was estimated in the final model to be 0.78 and 0.81 for both formation and elimination clearances of 8-OH EFV respectively (P= 0.033 and 0.041), where it was not statistically significantly different from 1 for other clearances.
Figure 1.
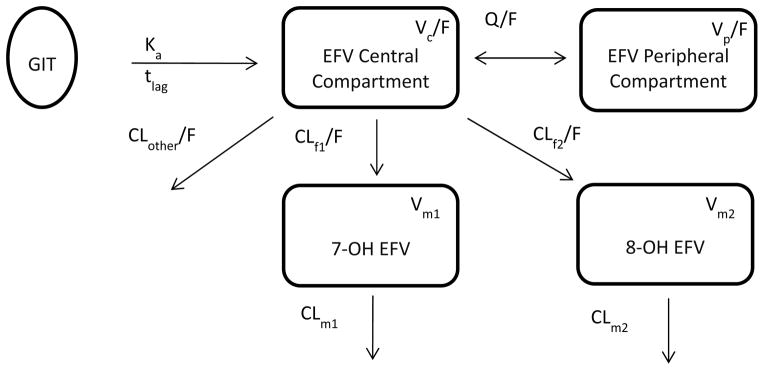
Structural model describing disposition of EFV and its major metabolites, following first order oral absorption from the GIT with delay represented by Ka , the first order absorption rate constant, tlag is the absorption lag time. EFV is characterized by two-compartment model; central and peripheral and it is eliminated from central compartment by non-metabolic clearance (CLother/F) and the metabolic transformation into 7-OH EFV (CLf1/F) and 8-OH EFV (CLf2/F). Both metabolites are characterized by one-compartment each with linear clearance (CLm1, CLm2). Q/F is EFV distribution clearance, and V is the volume of distribution of the annotated compartments.
Covariate Model Development
The covariates that significantly decreased the AIC in the GAM analysis and were introduced to the pharmacokinetic model were CYP2A6, CYP2B6 and CYP3A5 genotypes as discrete covariates and subject body weight as a continuous covariate. The stepwise changes in OFV by the inclusion of the covariates in the structural base model are presented in Supplemental Table 1. The covariates that resulted in statistically significant decreases in OFV were: (1) CYP2B6 on CLf2/F; (2) CYP2B6 on INH1; (3) CYP3A5 on CLf2/F; and (4) CYP2A6 on CLother/F. The largest decrease in the OFV was observed with CYP2B6 genotype on CLf2/F and hence this was used as the base model for step 2. None of the other covariates had a statistically significant effect in step 2 when CYP2B6 genotype on CLf2/F was considered in the model. Therefore, the final model only included CYP2B6 genotype as a covariate on CLf2/F.
Table 2 displays the estimated model parameters for the base structural model and the final covariate model. Inclusion of CYP2B6 genotype in the covariate model predicted approximately 22% of the between subject variability in CLf2/F.
Table 2.
Summary of the estimated population pharmacokinetic parameters from both base and covariate models
| Base Model | Covariate Model | ||||
|---|---|---|---|---|---|
|
| |||||
| Parameter (Unit) | Population mean | BSV% | Population mean | BSV% | |
| Efavirenz | |||||
| Ka (h−1) | 2.21 | 88 | 2.25 | 90 | |
| tlag (h) | 0.893 | 61 | 0.902 | 58 | |
| Vc (L) | 107 | 31 | 106 | 31 | |
| VP (L) | 304 | 21 | 299 | 26 | |
| Q (L/h) | 17.1 | 36 | 17.1 | 38 | |
| CLother/F (L/h) | 0.11 | 8.1 | 0.12 | 7.6 | |
| (CLf1/F)M1 (L/h) | 0.99 | 11 | 0.89 | 5.7 | |
| (CLf2/F) (L/h) | 2.4 | 42 | CYP2B6 *1*1 | 3.04 | 20 |
| CYP2B6 *1*6 | 2.91 | ||||
| CYP2B6 *1*1 | 1.63 | ||||
| 7-hydroxyefavirenz | |||||
| Vm1 (L) | 10* | --- | 10* | --- | |
| CLm1 (L/h) | 11.9 | 6.5 | 12.1 | 8.1 | |
| 8-hydroxyefavirenz | |||||
| Vm2 (L) | 10* | --- | 10* | --- | |
| CLm2 (L/h) | 6.24 | 12 | 6.12 | 12 | |
| Clopidogrel Effect | |||||
| INH1 | 0.778 | 0.780 | --- | ||
| INH2 | 0.812 | 0.812 | --- | ||
Vm1 and Vm2 were fixed to 10 L
Model Evaluation
The goodness of fit plots showed adequate model prediction of the observed plasma concentrations of EFV and its hydroxyl metabolites. Figure 2(a-c) displays a sample individual concentration-time profile among each CYP2B6 genotype, showing adequate model-prediction of the 3 compounds. The predicted versus observed concentrations of EFV and its major metabolites (Supplemental Figure 1) displays an even distribution of the observations around the linearity line indicating adequate model predictions.
Figure 2.

Representative individual observed concentration-time profiles in individuals representing CYP2B6 genotypes, (a) *1/*1, (b) *1/*6, (c) *6/*6 of EFV (●), 7-OH EFV (△), and 8-OH EFV (□). Solid lines represent the final model-predicted concentrations of each compound.
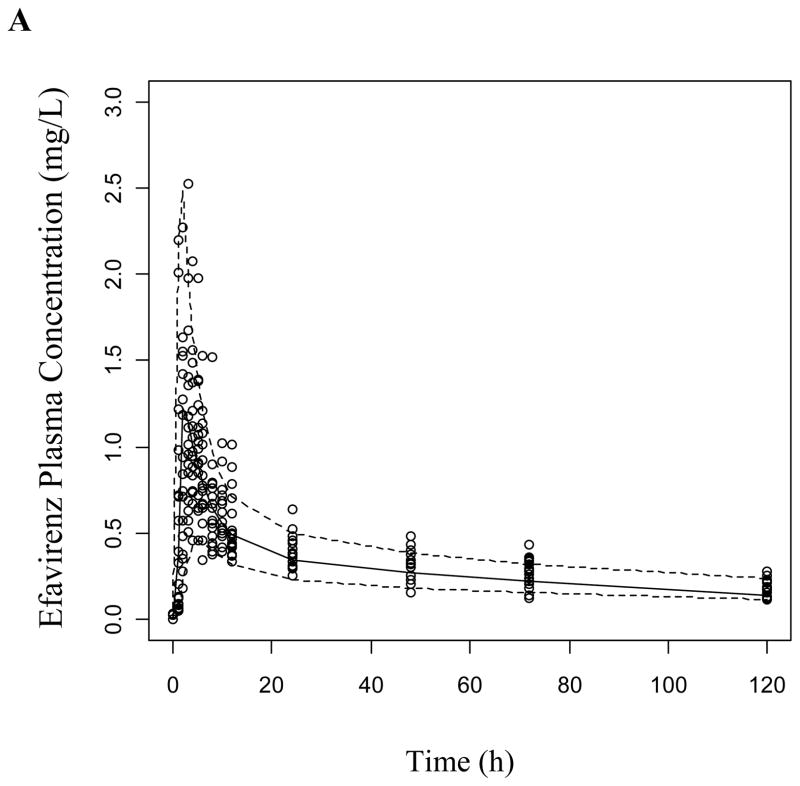
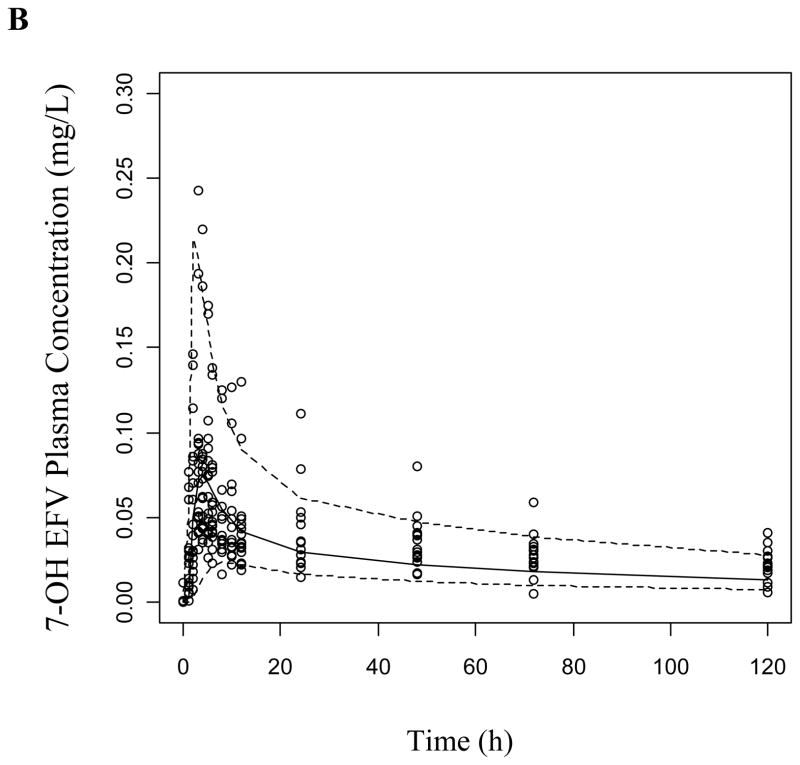
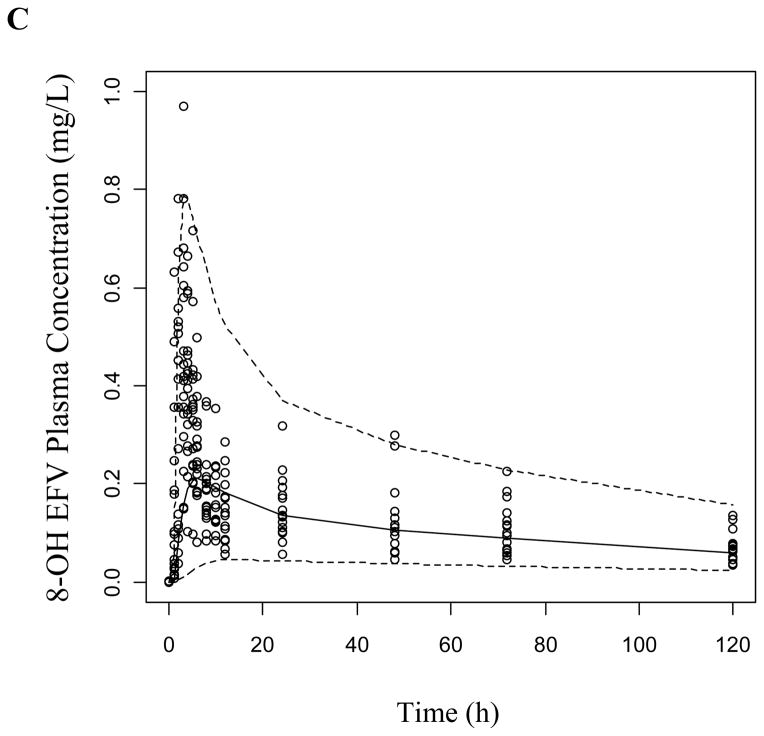
The VPCs were generated as described using both the base structural model (data not presented) and the final covariate model for both study phases. The covariate model improved the prediction of EFV and 8-OH EFV, while 7-OH EFV was adequately predicted in both models in the absence (Figure 3) and presence of clopidogrel (Supplemental Figure 2). Most of the observed concentrations are within the displayed 90% prediction interval (5th-95th percentiles) and symmetrically distributed around the median indicating good model predictive performance.
Figure 3.
Visual predictive checks of (a) EFV, (b) 7-OH EFV, and (c) 8-OH EFV based on 1000 simulations per each CYP2B6 genotype group following a 200 mg dose of EFV. Dashed lines represent the 5th and 95th percentiles while the solid line is the median of simulated plasma concentrations.
Population Simulations
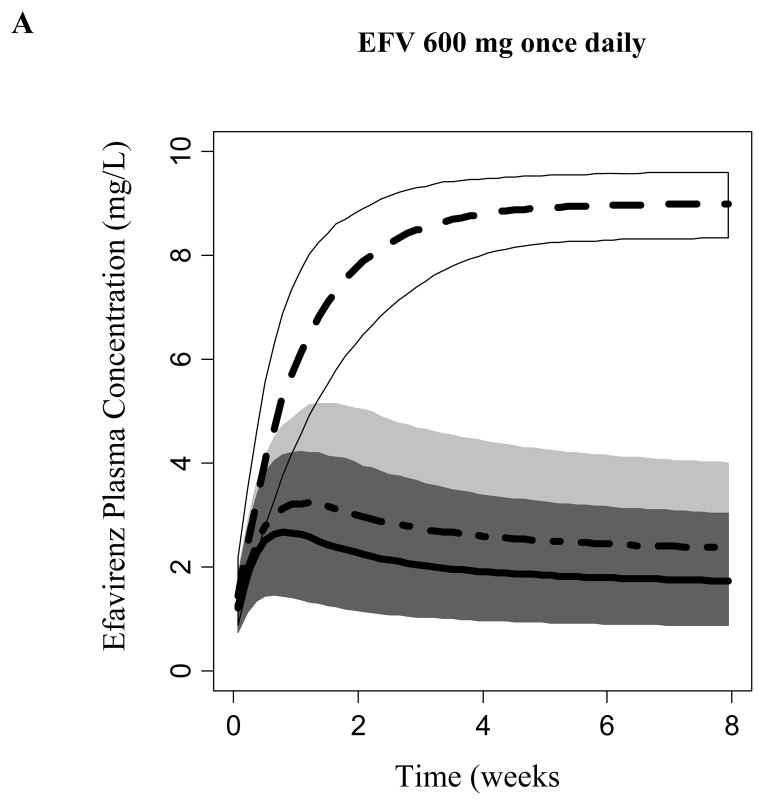
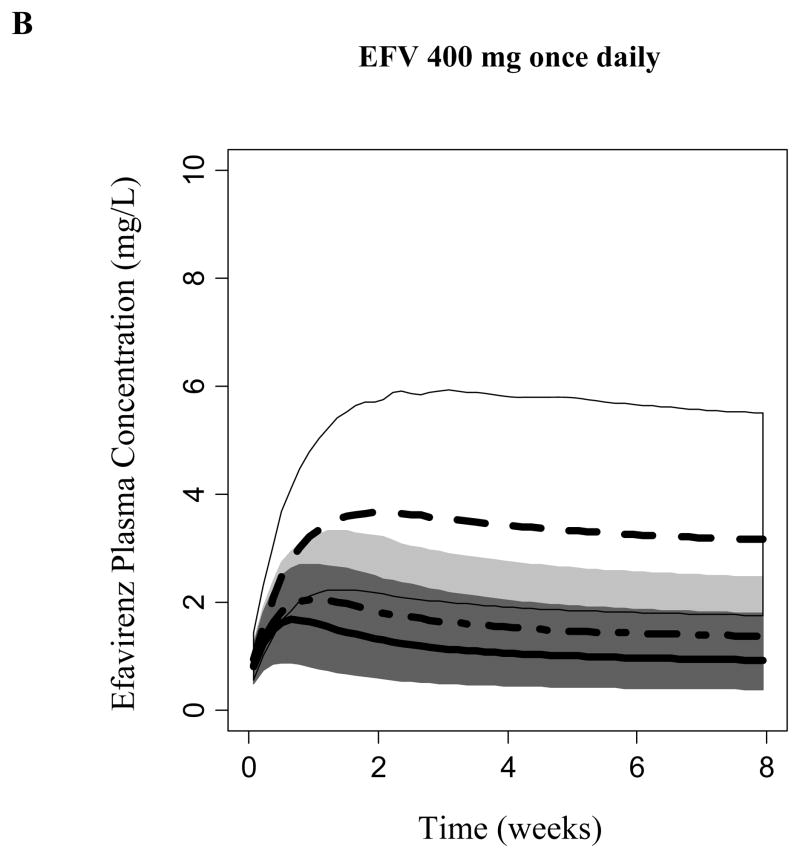
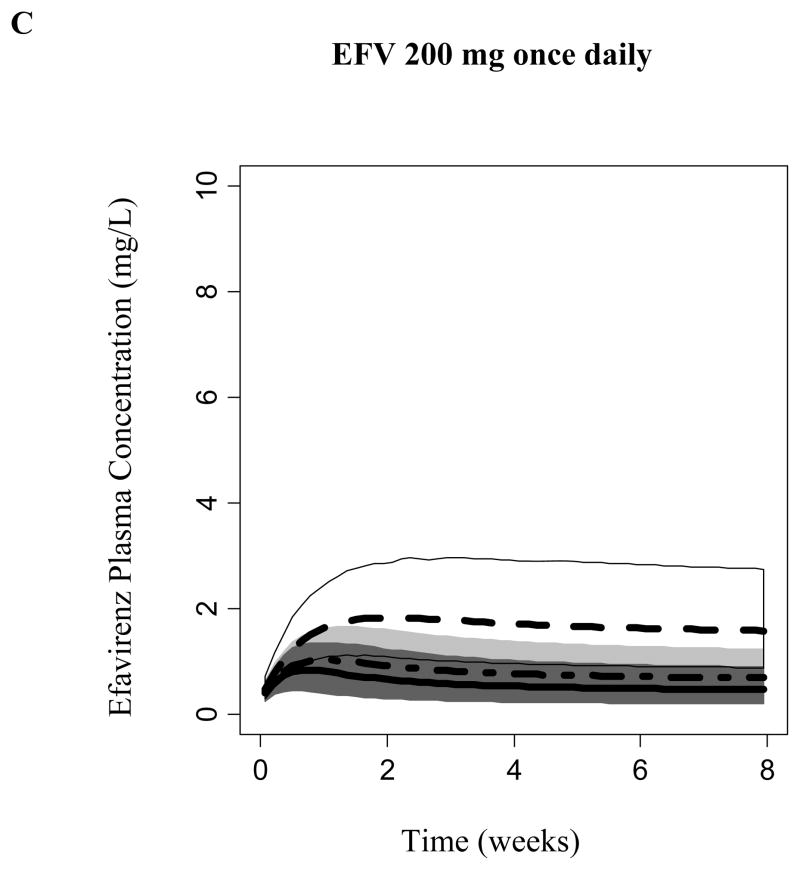
Covariate model-based simulations (n= 1000 per CYP2B6 genotype group) was performed considering EFV autoinduction. Model-predicted EFV steady-state was CYP2B6-dependent. Figure 4 displays the predicted EFV concentration 14 hours following the daily dosing of 600, 400, or 200 mg to steady-state (median, 95% prediction intervals). A daily dose of 600 mg achieved median steady-state concentrations at 14 hours following EFV administration that exceeded 4 mg/L among subjects homozygous for the CYP2B6*6 allele. Carriers of the CYP6*1/*1 and CYP2B6*1/*6 alleles achieved concentrations where the upper bounds of the 95% prediction interval exceed 4 mg/L during the first 2 weeks. However, due to the expected autoinduction, the upper boundaries of the 95% prediction interval did not exceed concentrations of 4 mg/L following 2 weeks of dosing. Daily dosing of 200 and 400 mg of EFV did not achieve median steady-state concentrations that exceeded 4 mg/L among all CYP2B6 genotypes. However, CYP6*1/*1 and CYP2B6*1/*6 genotyped subjects may be at a risk of viral resistance and virological failure due to the predicted low exposure.
Figure 4.
Efavirenz simulated plasma concentration at 14 hours following administration of a) 600, b) 400, and c) 200 mg daily. Median and 95% prediction interval of simulated concentrations are displayed for each CYP2B6 genotype; Dark Gray (*1/*1), Light Gray (*1/*6) and Whtie (*6/*6).
DISCUSSION
In the present study, a pharmacogenetic-based pharmacokinetic model that describes EFV metabolism and disposition was developed. This is the first comprehensive model to include EFV and the hydroxyl metabolites in a population pharmacokinetic analysis using pharmacogenetic information from major elimination and disposition pathways. The development of this model enabled the characterization of EFV metabolic clearances and the assessment of potential patient and pharmacogenetic covariates on individual clearance pathways and other pharmacokinetic parameters. Model-based population simulations suggest that steady-state concentrations are dependent on CYP2B6 function and a dose reduction may be appropriate to avoid toxicity among patients with the CYP2B6 *6*6 genotype.
The role that the CYP2B6*6 allele or the SNP tagging this allele (CYP2B6 516 G>T) plays in EFV clearance and response has been repeatedly demonstrated in vitro and in vivo in healthy volunteers and HIV patients. However, data on the impact of this variant on specific metabolic pathways of EFV are generally limited to in vitro9,10 or to single time point sampling.17,36 Metabolite information was incorporated into the modeling procedure in this study to increase the sensitivity to identifying predictors of the minor elimination pathways in humans. The present findings which incorporated full pharmacokinetics of EFV and metabolites for the first time support that: the model-estimated formation of 8-OH EFV represented 60 to 80% of EFV total clearance in slow (*6*6) and normal (*1*1) metabolizers, respectively; and the covariate analysis in the current study concurred with previous studies that CYP2B6 genotype is an independent predictor of EFV clearance. These findings confirm that EFV 8-hydroxylation represents its main clearance pathway8 and that this pathway is mainly catalyzed by CYP2B6 in vivo and in vitro.5,6 Previous in vitro studies have suggested that other CYPs such as CYP2A6, CYP3A and CYP1A2 catalyze EFV 8-hydroxylation.5,6,10 The present study which identify no effect of variants in these genes on EFV 8-hydroxylation indicate limited roles of CYP3A5 and CYP2A6 on this pathway.
In vitro microsomal studies have shown that the formation of 7-OH EFV is exclusively mediated by CYP2A6,6,10 representing 22.5% of EFV total metabolism.6 These findings are consistent with the current study where the formation of 7-OH EFV represented approximately 20% of total elimination. The additional pathway, which is estimated to be less than 5% of the total elimination in this study, may represent EFV N-glucuronidation by UGT2B7.7,17 The current analysis did not identify CYP2A6 genetic variations as significant covariates in the final model for EFV 7-hydroxylation. Formation of 7-hydroxylation was confirmed in vivo17 and genetic variants in the CYP2A6 have been associated with 7-OH EFV formation,17 or EFV exposure by some investigators,17–20 while other authors did not find any statistically significant association.37,38 Taken together with the current results, the contribution of CYP2A6-mediated 7-hydroxylation to the overall elimination of EFV is likely to be small.
Eleven of the subjects in this study were classified as CYP3A5 non-expressers (Table 1). Stepwise development of the covariate model showed potential influence of CYP3A5 on the formation of 8-OH EFV (Supplemental Table 1). However, this influence lost statistical significance when CYP2B6 was incorporated as a variable and thus, did not add further contribution into the variability beyond CYP2B6. However, this analysis may be confounded as five out of the six CYP2B6 slow metabolizers had the CYP3A5 non-expressers status. This overlap may explain the lack of an additive contribution of CYP3A5 in EFV since all of the CYP2B6 slow metabolizer also possessed decreased CYP3A5 function.
In one study, CYP2A6 and CYP3A4 have been reported to influence on EFV total clearance when CYP2B6 is impaired.18 In that study, a pharmacogenetic model was developed, where a joint effect of CYP2B6 together with either CYP2A6 or 3A4 was significant in some individuals with genetically reduced CYP2B6 function. Consequently, modeling was performed in the presence and absence of CYP2B6 inhibition with clopidogrel to enhance the potential minor metabolic pathways (i.e. CYP2A6 and CYP3A5). The goal was to reduce the influence of CYP2B6 function on 8-OH formation. However, neither CYP2A6 nor CYP3A5 were independent predictors of EFV metabolite formation. This may be in part attributed to the properties of clopidogrel where only a 22% and 19% reduction in the formation and elimination of 8-OH EFV was observed. Overall, it is possible that CYP2A6 and CYP3A5 have a minor contribution to EFV elimination in humans. This suggestion is supported by a recent genome-wide association study (GWAS) demonstrating that only CYP2B6 variants reached a genome wide significance level.37
The influence of MDR1 genotype on EFV pharmacokinetics has been controversial. A retrospective analysis on 43 EFV-treated patients displayed no effect of MDR1 C3435T on EFV plasma concentrations.26 Additionally, no association was reported between MDR1 polymorphisms at positions 2677 or 3435 and EFV pharmacokinetics.25 However, a recent study showed a 26% increase in EFV bioavailability in Ugandans individuals homozygous for ABCB1 A4036G polymorphism.28 In the present study, subjects were genotyped for MDR1 polymorphisms at position 2677 and 3435. Neither of the polymorphisms were significant predictors of EFV pharmacokinetics in our study. The reason for the discrepancy remains unclear, but the possibility that ethnic and racial differences in study population contribute to this cannot be excluded.
The final model was utilized to predict the influence of CYP2B6 on EFV exposure. It has been reported that the clearance of EFV may be decreased with prolonged exposure due to an induction of its own metabolism.21–24 Consequently, our model-based simulations were performed in the presence of EFV inducing its own metabolism (i.e. auto-induction). Homozygous subjects of CYP2B6*6 allele displayed approximately a 30% reduction in the total EFV clearance which was evident in the simulated steady-concentrations. Following a 600 mg daily dose, both normal and intermediate metabolizers achieved similar simulated steady state EFV concentrations, while slow metabolizers (CYP2B6*6 homozygous) achieved higher simulated steady state at median of 8 mg/L. These simulated concentrations suggest differential auto-induction in the different genotypes and that there may be a higher incidence of adverse effects (e.g., CNS and hepatotoxicity) in slow metabolizers.
It has been reported that the incidence of adverse events is higher in patients with EFV steady state concentrations exceeding 4mg/L, while therapeutic failure may occur at steady state concentrations below 1mg/L.3 Consequently, simulations were performed using reduced doses of 200 mg and 400 mg daily. The model-based simulations showed that 200-–00mg daily doses maintained the steady state concentration of EFV between 1 and 4 mg/L in subjects with the CYP2B6*6/*6 genotype (i.e. slow metabolizer). These simulations require further validation using multiple dosing study design that enables genotype-based modeling of EFV steady-state.
In summary, a pharmacogenetic-based covariate model has been developed to characterize and quantify EFV elimination pathways. CYP3A5 and CYP2B6 explained the variability in EFV concentrations and predicted the 8-OH formation in the univariate analysis. However, only CYP2B6 genotype predicted EFV pharmacokinetics and exposure in the multivariate analysis. One limitation of our study is the small sample size that might have precluded firm conclusions on the subtle contribution of accessory pathways on EFV disposition. Model based simulations warrant the prospective validation that daily doses of EFV 200 mg and 400 mg among CYP2B6 slow metabolizers will maintain antiviral efficacy while decreasing adverse events. Additionally, the developed pharmacogenetic model will allow further evaluation of dose-reduction recommendations in CYP2B6 slow metabolizers, as has been suggested.31,33,39,40
Supplementary Material
Acknowledgments
FUNDING
This work was supported by: the National Institute of General Medical Sciences grant (R01GM078501) and the Heart, Lung, and Blood Institute grant (K08HL095655) of the National Institutes of Health (Bethesda, MD, USA), and the Korea Health 21 R&D project of the Ministry of Health & Welfare (02-PJ2-PG6-DC04-0001) of the Republic of Korea. Additional support was provided from the Computing Resources of the Disease and Therapeutic Response Modeling Program of the Indiana CTSI (#TR000006).
Footnotes
TRANSPARENCY DECLARATIONS
None to declare
Literature Cited
- 1.Marzolini C, Telenti A, Decosterd LA, Greub G, Biollaz J, Buclin T. Efavirenz plasma levels can predict treatment failure and central nervous system side effects in HIV-1-infected patients. AIDS. 2001 Jan 5;15(1):71–75. doi: 10.1097/00002030-200101050-00011. [DOI] [PubMed] [Google Scholar]
- 2.Rotger M, Tegude H, Colombo S, et al. Predictive value of known and novel alleles of CYP2B6 for efavirenz plasma concentrations in HIV-infected individuals. Clin Pharmacol Ther. 2007 Apr;81(4):557–566. doi: 10.1038/sj.clpt.6100072. [DOI] [PubMed] [Google Scholar]
- 3.Csajka C, Marzolini C, Fattinger K, et al. Population pharmacokinetics and effects of efavirenz in patients with human immunodeficiency virus infection. Clin Pharmacol Ther. 2003 Jan;73(1):20–30. doi: 10.1067/mcp.2003.22. [DOI] [PubMed] [Google Scholar]
- 4.Stahle L, Moberg L, Svensson JO, Sonnerborg A. Efavirenz plasma concentrations in HIV-infected patients: inter- and intraindividual variability and clinical effects. Ther Drug Monit. 2004 Jun;26(3):267–270. doi: 10.1097/00007691-200406000-00008. [DOI] [PubMed] [Google Scholar]
- 5.Ward BA, Gorski JC, Jones DR, Hall SD, Flockhart DA, Desta Z. The cytochrome P450 2B6 (CYP2B6) is the main catalyst of efavirenz primary and secondary metabolism: implication for HIV/AIDS therapy and utility of efavirenz as a substrate marker of CYP2B6 catalytic activity. J Pharmacol Exp Ther. 2003 Jul;306(1):287–300. doi: 10.1124/jpet.103.049601. [DOI] [PubMed] [Google Scholar]
- 6.Ogburn ET, Jones DR, Masters AR, Xu C, Guo Y, Desta Z. Efavirenz primary and secondary metabolism in vitro and in vivo: identification of novel metabolic pathways and cytochrome P450 2A6 as the principal catalyst of efavirenz 7-hydroxylation. Drug Metab Dispos. 2010 Jul;38(7):1218–1229. doi: 10.1124/dmd.109.031393. [DOI] [PMC free article] [PubMed] [Google Scholar]
- 7.Belanger AS, Caron P, Harvey M, Zimmerman PA, Mehlotra RK, Guillemette C. Glucuronidation of the antiretroviral drug efavirenz by UGT2B7 and an in vitro investigation of drug-drug interaction with zidovudine. Drug Metab Dispos. 2009 Sep;37(9):1793–1796. doi: 10.1124/dmd.109.027706. [DOI] [PMC free article] [PubMed] [Google Scholar]
- 8.Mutlib AE, Chen H, Nemeth G, Gan LS, Christ DD. Liquid chromatography/mass spectrometry and high-field nuclear magnetic resonance characterization of novel mixed diconjugates of the non-nucleoside human immunodeficiency virus-1 reverse transcriptase inhibitor, efavirenz. Drug Metab Dispos. 1999 Sep;27(9):1045–1056. [PubMed] [Google Scholar]
- 9.Xu C, Ogburn ET, Guo Y, Desta Z. Effects of the CYP2B6*6 allele on catalytic properties and inhibition of CYP2B6 in vitro: implication for the mechanism of reduced efavirenz metabolism and other CYP2B6 substrates in vivo. Drug Metab Dispos. 2012 Apr;40(4):717–725. doi: 10.1124/dmd.111.042416. [DOI] [PMC free article] [PubMed] [Google Scholar]
- 10.Desta Z, Saussele T, Ward B, et al. Impact of CYP2B6 polymorphism on hepatic efavirenz metabolism in vitro. Pharmacogenomics. 2007 Jun;8(6):547–558. doi: 10.2217/14622416.8.6.547. [DOI] [PubMed] [Google Scholar]
- 11.Haas DW, Ribaudo HJ, Kim RB, et al. Pharmacogenetics of efavirenz and central nervous system side effects: an Adult AIDS Clinical Trials Group study. AIDS. 2004 Dec 3;18(18):2391–2400. [PubMed] [Google Scholar]
- 12.Tsuchiya K, Gatanaga H, Tachikawa N, et al. Homozygous CYP2B6 *6 (Q172H and K262R) correlates with high plasma efavirenz concentrations in HIV-1 patients treated with standard efavirenz-containing regimens. Biochem Biophys Res Commun. 2004 Jul 9;319(4):1322–1326. doi: 10.1016/j.bbrc.2004.05.116. [DOI] [PubMed] [Google Scholar]
- 13.Zanger UM, Klein K, Saussele T, Blievernicht J, Hofmann MH, Schwab M. Polymorphic CYP2B6: molecular mechanisms and emerging clinical significance. Pharmacogenomics. 2007 Jul;8(7):743–759. doi: 10.2217/14622416.8.7.743. [DOI] [PubMed] [Google Scholar]
- 14.Wyen C, Hendra H, Siccardi M, et al. Cytochrome P450 2B6 (CYP2B6) and constitutive androstane receptor (CAR) polymorphisms are associated with early discontinuation of efavirenz-containing regimens. J Antimicrob Chemother. 2011 Sep;66(9):2092–2098. doi: 10.1093/jac/dkr272. [DOI] [PubMed] [Google Scholar]
- 15.Yimer G, Amogne W, Habtewold A, et al. High plasma efavirenz level and CYP2B6*6 are associated with efavirenz-based HAART-induced liver injury in the treatment of naive HIV patients from Ethiopia: a prospective cohort study. Pharmacogenomics J. 2012 Dec;12(6):499–506. doi: 10.1038/tpj.2011.34. [DOI] [PubMed] [Google Scholar]
- 16.Desta Z, Kreutz Y, Nguyen AT, et al. Plasma letrozole concentrations in postmenopausal women with breast cancer are associated with CYP2A6 genetic variants, body mass index, and age. Clin Pharmacol Ther. 2011 Nov;90(5):693–700. doi: 10.1038/clpt.2011.174. [DOI] [PMC free article] [PubMed] [Google Scholar]
- 17.di Iulio J, Fayet A, Arab-Alameddine M, et al. In vivo analysis of efavirenz metabolism in individuals with impaired CYP2A6 function. Pharmacogenet Genomics. 2009 Apr;19(4):300–309. doi: 10.1097/FPC.0b013e328328d577. [DOI] [PubMed] [Google Scholar]
- 18.Arab-Alameddine M, Di Iulio J, Buclin T, et al. Pharmacogenetics-based population pharmacokinetic analysis of efavirenz in HIV-1-infected individuals. Clin Pharmacol Ther. 2009 May;85(5):485–494. doi: 10.1038/clpt.2008.271. [DOI] [PubMed] [Google Scholar]
- 19.Kwara A, Lartey M, Sagoe KW, Kenu E, Court MH. CYP2B6, CYP2A6 and UGT2B7 genetic polymorphisms are predictors of efavirenz mid-dose concentration in HIV-infected patients. AIDS. 2009 Oct 23;23(16):2101–2106. doi: 10.1097/QAD.0b013e3283319908. [DOI] [PMC free article] [PubMed] [Google Scholar]
- 20.Kwara A, Lartey M, Sagoe KW, Rzek NL, Court MH. CYP2B6 (c.516G-->T) and CYP2A6 (*9B and/or *17) polymorphisms are independent predictors of efavirenz plasma concentrations in HIV-infected patients. Br J Clin Pharmacol. 2009 Apr;67(4):427–436. doi: 10.1111/j.1365-2125.2009.03368.x. [DOI] [PMC free article] [PubMed] [Google Scholar]
- 21.Ngaimisi E, Mugusi S, Minzi OM, et al. Long-term efavirenz autoinduction and its effect on plasma exposure in HIV patients. Clin Pharmacol Ther. 2010 Nov;88(5):676–684. doi: 10.1038/clpt.2010.172. [DOI] [PubMed] [Google Scholar]
- 22.Zhu M, Kaul S, Nandy P, Grasela DM, Pfister M. Model-based approach to characterize efavirenz autoinduction and concurrent enzyme induction with carbamazepine. Antimicrob Agents Chemother. 2009 Jun;53(6):2346–2353. doi: 10.1128/AAC.01120-08. [DOI] [PMC free article] [PubMed] [Google Scholar]
- 23.Nanzigu S, Eriksen J, Makumbi F, et al. Pharmacokinetics of the nonnucleoside reverse transcriptase inhibitor efavirenz among HIV-infected Ugandans. HIV Med. 2012 Apr;13(4):193–201. doi: 10.1111/j.1468-1293.2011.00952.x. [DOI] [PubMed] [Google Scholar]
- 24.Viljoen M, Karlsson MO, Meyers TM, Gous H, Dandara C, Rheeders M. Influence of CYP2B6 516G>T polymorphism and interoccasion variability (IOV) on the population pharmacokinetics of efavirenz in HIV-infected South African children. Eur J Clin Pharmacol. 2012 Apr;68(4):339–347. doi: 10.1007/s00228-011-1148-7. [DOI] [PubMed] [Google Scholar]
- 25.Ribaudo HJ, Liu H, Schwab M, et al. Effect of CYP2B6, ABCB1, and CYP3A5 polymorphisms on efavirenz pharmacokinetics and treatment response: an AIDS Clinical Trials Group study. J Infect Dis. 2010 Sep 1;202(5):717–722. doi: 10.1086/655470. [DOI] [PMC free article] [PubMed] [Google Scholar]
- 26.Winzer R, Langmann P, Zilly M, et al. No influence of the P-glycoprotein genotype (MDR1 C3435T) on plasma levels of lopinavir and efavirenz during antiretroviral treatment. Eur J Med Res. 2003 Dec 9;8(12):531–534. [PubMed] [Google Scholar]
- 27.Sanchez A, Cabrera S, Santos D, et al. Population pharmacokinetic/pharmacogenetic model for optimization of efavirenz therapy in Caucasian HIV-infected patients. Antimicrob Agents Chemother. 2011 Nov;55(11):5314–5324. doi: 10.1128/AAC.00194-11. [DOI] [PMC free article] [PubMed] [Google Scholar]
- 28.Mukonzo JK, Roshammar D, Waako P, et al. A novel polymorphism in ABCB1 gene, CYP2B6*6 and sex predict single-dose efavirenz population pharmacokinetics in Ugandans. Br J Clin Pharmacol. 2009 Nov;68(5):690–699. doi: 10.1111/j.1365-2125.2009.03516.x. [DOI] [PMC free article] [PubMed] [Google Scholar]
- 29.Cabrera SE, Santos D, Valverde MP, et al. Influence of the cytochrome P450 2B6 genotype on population pharmacokinetics of efavirenz in human immunodeficiency virus patients. Antimicrob Agents Chemother. 2009 Jul;53(7):2791–2798. doi: 10.1128/AAC.01537-08. [DOI] [PMC free article] [PubMed] [Google Scholar]
- 30.Jiang F, Desta Z, Shon JH, et al. Effects of clopidogrel and itraconazole on the disposition of efavirenz and its hydroxyl-metabolites: exploration of a novel CYP2B6 phenotyping index. Br J Clin Pharmacol. 2012 May 3; doi: 10.1111/j.1365-2125.2012.04314.x. [DOI] [PMC free article] [PubMed] [Google Scholar]
- 31.Gatanaga H, Hayashida T, Tsuchiya K, et al. Successful efavirenz dose reduction in HIV type 1-infected individuals with cytochrome P450 2B6 *6 and *26. Clin Infect Dis. 2007 Nov 1;45(9):1230–1237. doi: 10.1086/522175. [DOI] [PubMed] [Google Scholar]
- 32.Cabrera Figueroa S, Iglesias Gomez A, Sanchez Martin A, de la Paz Valverde Merino M, Dominguez-Gil Hurle A, Cordero Sanchez M. Long-term efficacy and safety of efavirenz dose reduction to 200 mg once daily in a Caucasian patient with HIV. Clin Drug Investig. 2010;30(6):405–411. doi: 10.1007/BF03256910. [DOI] [PubMed] [Google Scholar]
- 33.van Luin M, Gras L, Richter C, et al. Efavirenz dose reduction is safe in patients with high plasma concentrations and may prevent efavirenz discontinuations. J Acquir Immune Defic Syndr. 2009 Oct 1;52(2):240–245. doi: 10.1097/QAI.0b013e3181b061e6. [DOI] [PubMed] [Google Scholar]
- 34.Robertson SM, Maldarelli F, Natarajan V, Formentini E, Alfaro RM, Penzak SR. Efavirenz induces CYP2B6-mediated hydroxylation of bupropion in healthy subjects. J Acquir Immune Defic Syndr. 2008 Dec 15;49(5):513–519. doi: 10.1097/QAI.0b013e318183a425. [DOI] [PMC free article] [PubMed] [Google Scholar]
- 35.Mukonzo JK, Owen JS, Nanzigu S, et al. Population Pharmacokinetic-Pharmacogenetic Efavirenz Model among Ugandans. American Association of Pharmaceutical Sciences (annual meeting); 2012. [Google Scholar]
- 36.Yimer G, Ueda N, Habtewold A, et al. Pharmacogenetic & pharmacokinetic biomarker for efavirenz based ARV and rifampicin based anti-TB drug induced liver injury in TB-HIV infected patients. PLoS One. 2011;6(12):e27810. doi: 10.1371/journal.pone.0027810. [DOI] [PMC free article] [PubMed] [Google Scholar]
- 37.Holzinger ER, Grady B, Ritchie MD, et al. Genome-wide association study of plasma efavirenz pharmacokinetics in AIDS Clinical Trials Group protocols implicates several CYP2B6 variants. Pharmacogenet Genomics. 2012 Dec;22(12):858–867. doi: 10.1097/FPC.0b013e32835a450b. [DOI] [PMC free article] [PubMed] [Google Scholar]
- 38.Maimbo M, Kiyotani K, Mushiroda T, Masimirembwa C, Nakamura Y. CYP2B6 genotype is a strong predictor of systemic exposure to efavirenz in HIV-infected Zimbabweans. Eur J Clin Pharmacol. 2012 Mar;68(3):267–271. doi: 10.1007/s00228-011-1118-0. [DOI] [PubMed] [Google Scholar]
- 39.Siccardi M, Almond L, Schipani A, et al. Pharmacokinetic and pharmacodynamic analysis of efavirenz dose reduction using an in vitro-in vivo extrapolation model. Clin Pharmacol Ther. 2012 Oct;92(4):494–502. doi: 10.1038/clpt.2012.61. [DOI] [PubMed] [Google Scholar]
- 40.Torno MS, Witt MD, Saitoh A, Fletcher CV. Successful use of reduced-dose efavirenz in a patient with human immunodeficiency virus infection: case report and review of the literature. Pharmacotherapy. 2008 Jun;28(6):782–787. doi: 10.1592/phco.28.6.782. [DOI] [PubMed] [Google Scholar]
Associated Data
This section collects any data citations, data availability statements, or supplementary materials included in this article.


