

Abstract
The accumulation of non-heme iron in the brain has been proposed as a harbinger of neural and cognitive decline in aging and neurodegenerative disease, but support for this proposal has been drawn from cross-sectional studies, which do not provide valid estimates of change. Here, we present longitudinal evidence of subcortical iron accumulation in healthy human adults (age 19–77 at baseline). We used R2* relaxometry to estimate regional iron content twice within a 2 year period, measured volumes of the striatum and the hippocampus by manual segmentation, and assessed cognitive performance by working memory tasks. Two-year change and individual differences in the change of regional volumes, regional iron content, and working memory were examined by latent change score models while taking into account the age at baseline and metabolic risk indicators. Over the examined period, volume reduction occurred in the caudate nucleus and hippocampus, but iron content increased only in the striatum, where it explained shrinkage. Higher iron content in the caudate nucleus at baseline predicted lesser improvement in working memory after repeat testing. Although advanced age and elevated metabolic syndrome risk were associated with greater iron content in the putamen at baseline, neither age nor metabolic risk influenced change in any variable. Thus, longitudinal evidence supports the notion that accumulation of subcortical iron is a risk factor for neural and cognitive decline in normal aging.
Keywords: aging, brain, longitudinal, metabolic syndrome, MRI, R2*
Introduction
The magnitude of age-related changes in the brain and cognition varies across brain regions and cognitive domains (Raz and Kennedy, 2009). However, for the lack of in vivo assessment of cellular processes, the mechanisms of differential age-related changes are poorly understood. This limitation may be mitigated by interrogating relevant proxy markers, such as the amount of free non-heme iron. Although non-heme iron is necessary for synthesis of adenosine triphosphate (ATP) in mitochondria (Mills et al., 2010) and myelination (Todorich et al., 2009), its excessive accumulation promotes neurodegeneration via inflammation (Haider et al., 2014) and oxidative stress (Zecca et al., 2004; Mills et al., 2010). Surplus non-heme iron was hypothesized as a harbinger of brain shrinkage and cognitive declines (Harman, 1956), and older brains revealed greater iron content, especially in the basal ganglia (Hallgren and Sourander, 1958). The proposition by Harman (1956) became testable in vivo as magnetic resonance imaging (MRI) studies revealed regional age-related differences in brain iron (Daugherty and Raz, 2013). In contrast to established age differences in brain iron, little is known about its accumulation over time. Two-year increases in estimated iron content of the putamen and globus pallidus, but not of the other basal ganglia, were observed in a small sample of younger and middle-aged adults (Walsh et al., 2014), and in another small-scale study, middle-aged and older adults evidenced no change in striatal iron content (Ulla et al., 2013).
Cross-sectional investigations linked increased subcortical iron content with poor memory (Bartzokis et al., 2011), low general cognitive aptitude (Penke et al., 2012) and mental slowing (Pujol et al., 1992; Sullivan et al., 2009). Increased iron content and small hippocampal volume conjointly contribute to age differences in memory (Rodrigue et al., 2013). However, for the lack of longitudinal investigations of brain iron, brain volume, and cognition, it is unclear whether these findings reflect age-related changes.
The associations between age, brain, and cognition are complicated by mutually dependent age-related modifiers, including vascular risk, metabolic deficits, and inflammation (Franklin et al., 1997; Grundy et al., 2005; Finch and Morgan, 2007). Vascular and metabolic risk factors are linked to increased iron content (Raz et al., 2007; Rodrigue et al., 2011), smaller regional volumes (Salerno et al., 1992; Raz et al., 2003; Shing et al., 2011; Cherbuin et al., 2012), accelerated hippocampal shrinkage (Korf et al., 2004; Raz et al., 2005), and executive function deficits (Apter et al., 1951; Waldstein et al., 1991; Dahle et al., 2009). These factors should be considered in investigating the role of iron in the brain and in cognitive aging.
The main goal of this longitudinal study was to address the limitations of the cross-sectional studies and to estimate changes in regional iron content, as well as their relationship with regional shrinkage and cognitive performance, while accounting for metabolic and vascular risk. We hypothesized that changes in regional iron content and regional shrinkage would be linked to changes in age-sensitive abilities, working memory and episodic memory (Salthouse, 1996; Braver and Barch, 2002), with their effects on cognitive performance modified by metabolic risk.
Materials and Methods
Participants
The participants were recruited from the Metro Detroit area for an ongoing longitudinal study of cognitive and neural correlates of aging. The study was approved by the Institutional Review Board, and all participants provided informed consent. Participants were healthy adults [n = 125 at baseline (88 female), n = 78 at 2 year follow-up (54 female); age, 19–77 years at baseline] who were assessed twice within 2 years (average delay between assessments, 25.07 months; SD = 2.11). See Figure 1 for the details of selection and attrition.
Figure 1.

A flow chart depicting recruitment, sample selection, and attrition. A, Recruitment. Persons who answered the ads were contacted by telephone, interviewed, and selected and received detailed health questionnaires. B, Selection. The number of participants who passed the initial health screening and subsequent screening for MRI eligibility were scanned on the 4T scanner, did not have incidental findings, and did not develop exclusionary conditions or acquire MRI contraindications in the course of the longitudinal study. C, Attrition. The numbers of participants who were unable to start baseline measurements despite full eligibility and those who had baseline measurements but did not return at the 2 year follow-up are shown. For details of exclusionary criteria and screening instruments, see Materials and Methods.
Participants were interviewed and screened for history of neurological and cardiovascular disease, thyroid disorders, psychiatric disease, drug and alcohol abuse, and head injury with loss of consciousness. Participants reported right-hand dominance (Edinburgh Handedness Questionnaire; Oldfield, 1971) and were screened for vision and hearing problems at each assessment. For inclusion at baseline, participants had to score at least 26 on the Mini-Mental State Examination (MMSE; Folstein et al., 1975) and <16 on the Center for Epidemiological Studies Depression Scale-Revised (CES-D; Radloff, 1977). These screening measures were repeated at each assessment. Inclusion criteria allowed for current prescriptions of antihypertensive and cholesterol-reducing medications: by the 2 year follow-up, 8 participants were on β-blockers, 6 on other antihypertensive medications, and another 11 on statins.
The longitudinal data were acquired on a 4T scanner (see below for details). An additional 30 cases scanned on a 3T scanner at baseline were not included in the analyses because of the dependence of T2* on magnetic field strength. Of the participants scanned on the 4T scanner, 17 were removed from the sample for the development of exclusionary health conditions in the course of study, and 9 were removed as multivariate outliers. This resulted in a baseline sample of n = 125. The 26 cases that were removed did not differ from the retained baseline sample in age (t(149) = −0.59, p = 0.56), MMSE (t(149) = 0.67, p = 0.50), CES-D (t(149) = −0.04, p = 0.97), or years of education (t(149) = 0.05, p = 0.96). After 2 years, 78 participants of the original baseline sample returned for repeat testing. The returning participants were older at baseline than those who had left the study (t(125) = −2.23, p = 0.03) but did not differ in baseline MMSE (t(125) = −1.41, p = 0.16), CES-D (t(125) = −0.04, p = 0.97), or years of education (t(125) = −0.18, p = 0.86). For details on attrition, see Figure 1. To maintain statistical power and reduce bias in estimating change, cases with data missing at follow-up were retained, and missing data were accounted for in the estimation via full information maximum likelihood (FIML; Muthén et al., 1987). The FIML method does not impute missing data but instead harnesses all available information in estimating latent effects and manifest measurement error and addresses missing data in the context of the tested hypotheses. This approach preserves the original sample size and is a robust way of handling missing data in multilevel models (Larsen, 2011), as presented here. Because attrition of participants between the occasions correlated with baseline age, inclusion of this variable in the models partly mitigated the problem of data that is missing not completely at random.
Regional T2* relaxometry
Iron content was estimated in vivo with T2* relaxometry. The method is based on iron's strong paramagnetic properties that create local susceptibility effects proportional to the amount of iron-containing particles (Wood et al., 2004; Ghugre et al., 2005; Haacke et al., 2010). The addition of the susceptibility component (R2′) to the transverse relaxation rate (R2) produces a general relaxation rate index, R2* = R2 + R2′. The inverse index, T2* = 1/R2*, is frequently used to describe the total transverse relaxation process, and T2* relaxation times are negatively correlated with iron concentrations (Gomori and Grossman, 1993; Thomas et al., 1993). On T2*-weighted images, iron-rich regions appear dark, and differences in iron content can be measured by relative differences in image intensity values. T2* is a popular research tool that has been used in multiple studies of healthy aging and has been found equivalent to more direct methods of estimating local iron content (for review, see Daugherty and Raz, 2013).
Imaging parameters.
The multiecho susceptibility weighted image (SWI) sequence was acquired on a 4T Varian scanner (Bruker Biospin) equipped with a Siemens interface. The multiecho SWI gradient-echo images were acquired in the axial plane with the following parameters: 1 mm3 isotropic voxel; four echo times (TE) of 7.53–30 ms with an inter-echo interval of 7.5 ms; repetition time (TR), 35 ms; flip angle (FA), 25°; bandwidth, 200 Hz; field of view (FOV), 256 × 208 mm2.
Postacquisition processing and demarcation of regions.
After acquisition, all images were processed in SPIN (Signal Processing in NMR), an in-house written software freely available at http://www.mrc.wayne.edu/download.htm. During postacquisition processing, all images were interpolated to 1 × 1 × 1.5 mm, which improved the signal-to-noise ratio. Noise was further filtered from measurements by applying a threshold that selectively isolated intensity values corresponding to image inhomogeneity. T2* maps were interpolated to common space and estimated by a maximum-likelihood fit function for exponential decay dependent on TE. All boundaries were manually traced by a single rater (A.M.D.) for each selected region of interest (ROI): hippocampus (Hc), caudate (Cd), and putamen (Pt). The regions were selected based on the extant literature that reports moderate to large age differences in the basal ganglia T2* (Daugherty and Raz, 2013) and implicates Hc iron in age-related memory differences (Rodrigue et al., 2013).
Hippocampus.
The Hc iron content was estimated from five to seven contiguous slices, beginning with the slice on which the Hc was clearly visualized apart from the temporal cortex and dorsal with respect to the brain stem nuclei and ending at the slice on which the splenium of the corpus callosum was clearly visualized. The measurement range primarily represented the body and posterior tail portions of the formation, whereas the anterior portion of the Hc formation was excluded because of poor visualization in the axial plane.
Caudate nucleus and putamen.
The Cd was demarcated, and its iron content was estimated from six to eight contiguous slices, beginning with the first slice on which the Cd was clearly visualized adjacent to the ventricle and terminating on the last slice on which the thalamic nucleus was still identifiable. The measurements excluded the tail of the caudate. The Pt was measured on five to seven contiguous slices, beginning with the first slice on which the Cd was visualized and terminating when the Pt was no longer clearly identifiable.
Boundaries were marked with a pen stylus on a 21 inch digitizing tablet (Cintiq; Wacom) on the first echo image used as an anatomical reference and copied onto the T2* map, thus avoiding any potential coregistration errors and distortions (see Fig. 2 for examples of manual tracings). For each ROI, T2* was estimated as the mean across all slices on which a given ROI was traced. Rater reliability was established in a random subsample of 10 cases traced twice with a delay of 2 weeks. For all selected ROIs, the intraclass correlation coefficient [ICC(3); Shrout and Fleiss, 1979] exceeded 0.90 for average T2* measures.
Figure 2.

Examples of manual tracings for R2* relaxometry and volumetry. For R2*, each ROI was manually traced on an anatomical reference image (first echo) and copied to T2* maps. On the T2*-weighted images, voxels representing high magnetic susceptibility (i.e., iron) are visualized with dark intensity. R2* measures were calculated as the reciprocal of T2* as measured from the image intensity. Noise was removed from measurements by applying a threshold. For volumetry, each ROI was manually traced on T1-weighted MPRAGE images aligned to optimize visualization of each structure in the coronal plane. See Materials and Methods for details. Blue, Caudate nucleus; green, putamen; red, hippocampus.
To avoid possible bias in the segmentation of regional volumes from differences in image contrast (Lorio et al., 2014), we performed a partial correlation analysis between T2* and area measures. Average T2* did not correlate with the ROI area when the mutual correlation with age was accounted for (all r values of −0.03 to 0.08; all p values ≥0.10), except for right Pt at follow-up, which was not significant after correcting for multiple comparisons (r = −0.27; p = 0.01; Bonferroni α′ = 0.004). T2* estimates of iron content were further validated by high agreement of the baseline regional values with postmortem measures of iron concentration reported across several reviewed studies [R2 = 0.86; median values from Haacke et al. (2005)] and with age-based estimates after the lifespan postmortem study (R2 = 0.99) performed by Hallgren and Sourander (1958). To aid interpretation, average T2* measures were converted to R2* (s−1) = (1/T2*) × 1000, for which larger R2* values were interpreted as greater iron content.
Regional volumetry
Imaging parameters.
For volume measurements, we acquired MPRAGE (magnetization-prepared rapid gradient echo) T1-weighted images in the coronal plane. Acquisition parameters were as follows: 0.67 × .67 × 1.34 mm3 voxel; TE, 4.38 ms; TR, 1600 ms; inversion time, 800 ms; FOV, 256 × 256 mm2; matrix size, 384 × 384; FA, 8°.
Postacquisition processing and demarcation of regions.
In postacquisition processing, we followed procedures described in our previous studies (Raz et al., 2004). All image manipulations and measurements were made with Analyze software (version 10; Biomedical Imaging Resource, Mayo Clinic College of Medicine). Expert operators manually corrected differences in head tilt, pitch, and yaw of the head positioning.
The selected ROIs were manually traced on images aligned to optimize visualization of each region in the coronal plane. The Cd and Pt were measured from images that were resliced to be aligned perpendicular to the anteroposterior commissure line, whereas the Hc was measured from images that were resliced to be perpendicular to the long axis of the Hc. To correct the regional volumes for individual differences in body size, intracranial volume was measured on the axial images aligned by the anteroposterior commissure line. All volume measures were made by five expert raters who attained inter-rater agreement of at least 0.90 [ICC(2) formula that assumes random raters; Shrout and Fleiss, 1979]. Volumes were calculated as the sum area of the traced region multiplied by the slice thickness and adjusted for cranial size using the analysis of covariance approach (Jack et al., 1989). For a detailed description of all ROI volumetry procedures, see our previous publications (Raz et al., 2004; Persson et al., 2014).
Blood biomarkers of cardiovascular and metabolic risk
Blood samples (20 cc) were collected by venipuncture from the participants after a 12 h overnight fast before MRI acquisition. The following circulating biomarkers were assayed in the collected samples: high- and low-density lipoprotein, total cholesterol, triglycerides, and fasting blood glucose. Samples were collected in serum separator tubes, centrifuged to separate plasma, and placed on ice. Blood glucose and the lipid panel were determined enzymatically. All analyses were performed at Detroit Medical Center laboratories.
A metabolic syndrome risk factor score (MetS) was computed from biomarker indices deemed relevant to metabolic syndrome (Grundy et al., 2005): high-density lipoprotein cholesterol, total triglycerides, and glucose, as well as diagnosed or observed hypertension. All the measurements were treated as continuous variables, except for observed hypertension that was categorical (see Table 1 for descriptive statistics of the circulating biomarkers). The four indicators were used to identify a latent MetS risk factor construct, in which higher scores corresponded to increased risk.
Table 1.
Demographic profile of the sample
| Baseline | 2 Year follow-up | |
|---|---|---|
| n | 125 | 78 |
| Age (years) | 52.53 ± 14.91 | 56.87 ± 12.82 |
| Number of hypertensive | 23 | 17 |
| Education (years) | 15.72 ± 2.37 | 15.89 ± 2.93 |
| MMSE | 28.92 ± 1.05 | 28.99 ± 0.96 |
| CES-D | 4.24 ± 3.87 | 4.38 ± 4.26 |
| Average systolic pressure (mmHg) | 120.76 ± 12.78 | 122.62 ± 14.54 |
| Average diastolic pressure (mmHg) | 75.41 ± 7.29 | 75.51 ± 6.59 |
| Glucose (mg/dl) | 84.46 ± 10.68 | 87.75 ± 10.11 |
| HDL (mg/dl) | 55.04 ± 12.48 | 55.77 ± 13.38 |
| Total triglycerides (mg/dl) | 112.46 ± 56.10 | 120.47 ± 51.02 |
Means ± SDs are provided. HDL, High-density lipoprotein cholesterol.
Working memory assessment
At baseline and follow-up, participants completed four working memory measures (two verbal and two nonverbal tasks) as part of a larger battery administered in the study. The four indices of working memory were used to form a latent construct for verbal and nonverbal working memory, allowing analyses on the level of a broad ability rather than individual tests.
Verbal working memory.
The two verbal working memory measures were listening span (LSPAN; Salthouse and Babcock, 1991) and a verbal N-back task (Dobbs and Rule, 1989; Hultsch et al., 1990). During the LSPAN task, participants were required to answer simple questions about a sentence while simultaneously remembering the last word of the sentence. Sentences were presented in blocks of three trials, beginning with one test item per trial up to seven items per trial. An item was correct when the participant correctly answered the item question and recalled the word in the correct order as presented. Performance was scored as the sum total number correct across all trials (absolute span). This index was chosen because it presents more individual variability than simple span but reduces chance error that is included in total span (Engle et al., 1992). The estimated reliability of this measure is 0.90 (Salthouse and Babcock, 1991).
In the verbal N-back task, a randomly ordered string of digits was presented to the participant, who was required to report the digit in the nth position pressing a relevant key on the keyboard number pad. String lengths varied from five to nine digits, and each digit was presented for 1500 ms. A screen prompting the participant's response immediately followed the last digit presented in the string. The stimuli were grouped in three blocks of 20 trials each. In one block, the participant reported the last digit seen (n position); in the next block, the digit before the last (n-1); and in the third block, the n-2 position. The order of block presentation was counterbalanced between individuals and across follow-up assessments. Performance was modeled as the number of errors in the n-2 condition, as the other conditions are vulnerable to ceiling effects. The estimated reliability for this task is 0.91 (Salthouse et al., 1996).
Nonverbal working memory.
Nonverbal working memory was measured with spatial recall and N-back tasks. The spatial recall measure was a computerized task modified from a task described by Salthouse (1994). Task stimuli were seven target squares within a 5 × 5 matrix that were marked with solid orange coloring. The configurations of target squares were randomly chosen, without repetition across trials. Each matrix was presented in the center of the screen for 3000 ms. Participants were instructed to memorize the locations of the target squares and, after the presentation, to mark the seven target squares each with an “X” in a 5 × 5 matrix provided as a printed test sheet. Performance was measured as the average number of correct recalled items across 25 trials. The estimated reliability of this task is 0.67 (Salthouse, 1994).
The second nonverbal working memory measure was an N-back task (Dobbs and Rule, 1989; Hultsch et al., 1990) with stimuli selected from Kroll and Potter (1984) norms. Items were selected to minimally resemble real objects (mean rating, 5.89; 1, very much like a real object; 7, nothing like a real object). As in the verbal N-back task, there were three blocks of trials with 20 trials each. Items were presented for 2000 ms in strings varying in length from five to nine items. Participants were asked to report the items in the nth, n-1, and n-2 positions. Participants reported items using a keypad to indicate the item as shown on a prompt screen immediately after the last item of each string. The performance index was the number of errors in the n-2 position. The estimated reliability for this task is 0.88 (Salthouse et al., 1996).
Episodic memory assessment
Episodic memory (EM) was assessed by the logical memory subtest of the Wechsler Memory Scale-Revised (Wechsler, 1987). The stimuli were two short stories presented orally. Immediately after each story, participants were asked to recall the story in as much detail as possible. After a 20 min delay, participants were asked to recall each story in detail again, without cues. Both immediate and delayed free recall was scored by the standardized protocol for total number of correct details (maximum, 50). The same stories were repeated at the 2 year follow-up. In the longitudinal latent modeling, the immediate and delayed free recall scores at baseline and at the 2 year follow-up were used to identify a general EM latent construct for each time point (similar to Rodrigue et al., 2013).
Statistical analyses
Longitudinal structural equation modeling.
To meet the assumption of normality, before latent model construction, univariate outliers in memory, blood markers, and anatomical measures were identified by examining univariate distributions, Tukey's boxplots, and z-scores. Outlier screening procedures were repeated sequentially to limit the bias of an outlier case in the assessment of the whole sample and were conducted at each occasion separately and with consideration of autocorrelations across time. A datum that was identified as a univariate outlier was winsorized with respect to the 95% confidence intervals (CIs) of that data distribution. After this procedure, all data were normed to baseline measures for the purpose of the analyses. Hypotheses were tested in a series of latent change score models (LCSMs; McArdle and Hamagami, 2001) that were fitted to the longitudinal data. The LCSM simultaneously estimates individual differences in cross-sectional measures and in longitudinal change, as well as multivariate interactions to potentially explain the individual differences. The LCSM is conceptually like a traditional change score that is calculated as the difference between follow-up and baseline. However, unlike average raw scores, LCSM explicitly estimates measurement and latent factor error, and thus individual differences are not conflated with measure unreliability (McArdle, 2001). See Figure 3 for an example of LCSM construction.
Figure 3.

Example of a latent change score model for change in regional volume (Vol). An identical model was used for regional R2* measures, and the same modeling approach was applied to working memory and metabolic syndrome risk constructs. The asterisk indicates a cross-time constraint, and coefficients set to 1 were used to identify the latent factors and to compute latent change. β, Mean effect at baseline; α, variance at baseline; δ, mean change; γ, variance in change; ε, covariance of baseline effect with change after 2 years.
LCSMs were estimated in Mplus software (version 5.1) with a full-information maximum likelihood (FIML) method previously used in multiple longitudinal investigations (Raz et al., 2005). Latent change was a second-order latent variable formed from baseline and follow-up latent variables. For regional brain measures, each baseline and follow-up latent variable was created from two manifest indicators, one for each hemisphere. For R2* and volume in all regions, equal variance was specified across the two hemispheres and across time, which accounted for differential stability of regional measures between measurement occasions. Furthermore, right-hemisphere factor loading was constrained to be equal across time, as were the within-hemisphere correlations. A similar modeling approach was taken with the latent factors of metabolic syndrome, episodic memory, and working memory, using the respective measures at baseline and follow-up. There were a few exceptions: verbal and nonverbal working memory measure correlations across time were not constrained to be equal across tasks, and hypertension status as part of the latent MetS factor was not correlated across time. All residuals were set to be time invariant. Thus, simple effects models that estimated longitudinal change in a single factor were created.
For those effects that demonstrated significant longitudinal mean change and variance in change, additional parallel process models were estimated to evaluate whether change in one factor predicted change in another factor, including time-invariant covariates (i.e., baseline age, sex). Within parallel process models, the indirect effect of baseline iron content on regional shrinkage through change in iron was tested according to the James and Brett (1984) method, in which a significant effect is sufficient to support an indirect relationship via the specified intermediate variable(s). In this way, we tested whether baseline iron content predicted shrinkage after 2 years, while accounting for the commonality between contemporaneous change in R2* and volume of the same region.
While constructing the parallel process model, we tested alternate regression and correlation paths between regional measures of iron and volume for significance and model fit, and if no iteration was significant, then the respective pathway was removed from the model (i.e., constrained). The nominal significance level was set at p = 0.05, and Bonferroni correction was used to adjust for multiple comparisons (Bonferroni α′). To avoid spurious results in a relatively small sample, simple effects models and indirect effects were bootstrapped with bias correction (5000 iterations of the whole sample; Hayes and Scharkow, 2013) to estimate 95% CIs. Model fit was determined by an assortment of recommended indices (Raykov and Marcoulides, 2006): normal theory weighted χ2 statistic (a nonsignificant value indicates good fit); root mean square error of approximation (RMSEA; a value ≤0.05 indicates excellent fit); comparative fit index (CFI; values exceeding 0.90 indicate excellent fit); standardized root mean residual (SRMR; <0.05 supports good fit) or, for models with categorical variables, weighted root mean square residual (WRMR; <1.0 supports good fit).
Reverse-effects models.
To examine the directionality of effects, i.e., the precedence of iron accumulation before shrinkage and subsequent cognitive decline, the structural regression pathways were reversed. If the reverse-effects models fit worse than the models with hypothesized direction of the paths and the reverse effects are not significant, then the directionality of the hypothesized effects can be interpreted with greater confidence. Otherwise, if the models with opposite path directions fit equally well, only a more limited statement of association without implication of directionality can be made.
Results
Two-year shrinkage and accumulation of iron
The stability of R2* measurements within the striatum was moderate in Cd (for each hemisphere, r ≥ 0.58, p < 0.001) and Pt (each, r ≥ 0.65, p < 0.001) and significant, but limited, in Hc (each, r ≥ 0.31, p < 0.01). Regional volumes evidenced excellent stability of measurements between two measurement occasions in Cd (each, r ≥ 0.96, p < 0.001), Pt (each, r = 0.90, p < 0.001), and Hc (each, r ≥ 0.87, p < 0.001). The differential stability of R2* and volumetry in each region was accounted for in the models that estimated change in each measure.
Changes in regional iron and volume were estimated in simple effects latent change score models, without covariates. All simple effects models had excellent fit: χ2 ≤ 10.08, p ≥ 0.18; RMSEA ≤0.06; CFI ≥ 0.99; SRMR < 0.03. Iron content significantly increased in the striatum (Table 2), but not in the Hc (mean change, −0.14; p = 0.25). The increase in iron in the Pt was equal to that in the Cd (Steiger Z* = −0.33; p = 0.75). Despite the observed mean change, the rank order of regions by their average iron content remained the same: the Pt and Cd had greater iron content than the Hc (all p values <0.001; Fig. 4).
Table 2.
Regional iron content and volume: 2 year mean change and variance in change
| ROI | Measure | Mean change | 95% CI mean change | d | Variance in change | Variance at baseline |
|---|---|---|---|---|---|---|
| Caudate | R2* | 0.27* | 0.13/0.43 | 0.30 | 0.42* | 0.82* |
| Volume | −0.10* | −0.14/−0.06 | −0.10 | 0.02* | 0.95* | |
| Putamen | R2* | 0.31* | 0.15/0.47 | 0.33 | 0.40* | 0.86* |
| Volume | −0.06 | −0.12/−0.01 | −0.06 | 0.05* | 0.88* | |
| Hippocampus | R2* | −0.14 | −0.35/0.06 | −0.20 | 0.80* | 0.48* |
| Volume | −0.08** | −0.13/−0.01 | −0.09 | 0.06* | 0.82* |
Unstandardized coefficients are reported for data normed to baseline. R2* (s−1) was calculated as the inverse of T2* measures, and larger values are interpreted as greater iron content. 95% CIs are bootstrapped with bias correction. d is an effect size estimation of mean change calculated as d = mean change /√variance at baseline.
*p < 0.02, Bonferroni's α′ = 0.02;
**An effect with nominal significance p < 0.05 that did not survive correction for multiple comparisons.
Figure 4.

Average regional R2* at baseline and at follow-up after a 2 year delay. Error bars represent SEM. The asterisk indicates significant within-region change, p < 0.02. At baseline and follow-up, all between-region comparisons were significant (p < 0.001).
Whereas Pt volume did not change, the Cd shrunk significantly (Table 2). The shrinkage of the Hc was nominally significant (mean change, −0.08; p = 0.03; α′ = 0.02), but the effect did not survive correction for multiple comparisons (Table 2). Nonetheless, the magnitude of shrinkage did not differ across the regions (all Steiger Z* ≤ −0.59; p = 0.55). Individual trajectories of change in striatal and hippocampal volumes and R2* are depicted in Figure 5. Significant individual differences in regional iron content and volume of the striatum and Hc (variance in change, ≥0.02; all p values <0.01) justified further analyses seeking factors that account for the observed variability. Therefore, additional latent change score models were estimated to test whether the increases in iron content preceded decline in regional volumes. The models included baseline age, the MetS risk factor, and the length of delay between baseline and follow-up as covariates. Sex was tested as an additional covariate but did not account for individual differences in striatal or Hc regional measures (all p values ≥0.05; α′ = 0.02) and reduced model fit. Therefore, sex was removed from the final models.
Figure 5.

Individual change trajectories in volume (adjusted for intracranial volume and summed across the hemispheres) and iron content (R2* averaged across the hemispheres) in the caudate, putamen, and hippocampus as a function of baseline age. Longer R2* is interpreted as greater iron content. Gray circles represent winsorized data points. A1, A2, In the caudate, regional mean change and individual differences in change in iron and volume were significant (p ≤ 0.02; α′ = 0.02). B1, B2, In the putamen, change in iron content was significant (p ≤ 0.02; α′ = 0.02), but not change in volume; however, there were significant individual differences in both measures (p ≤ 0.02; α′ = 0.02). C1, C2, In the hippocampus, iron content did not change, and the change in volume was nominally significant (p = 0.03; α′ = 0.02), but individual differences in longitudinal stability of both measures were significant (p ≤ 0.02; α′ = 0.02).
Accumulation of iron is associated with regional shrinkage
Models including change in striatal and Hc iron content and volume, as well as the covariates, fit well: all χ2 values ≤87.78, p ≥ 0.07; RMSEA ≤0.06; CFI ≥0.92; WRMR ≤0.75. Longitudinal increase in estimated iron content was associated with shrinkage only in the striatum: Cd: β = −0.11, p = 0.007, α′ = 0.03; Pt: β = −0.42, p = 0.027, α′ = 0.03; Fig. 6A. Greater iron content at baseline was associated with slower iron accumulation in the Cd (β = −0.29, p = 0.001; α′ = 0.03), and the same effect in the Pt was a nonsignificant trend (β = −0.24, p = 0.05; α′ = 0.03). Individual differences in baseline volumes were unrelated to the rate of shrinkage in either the Cd (r = 0.02, p = 0.29) or Pt (r = −0.09, p = 0.12).
Figure 6.
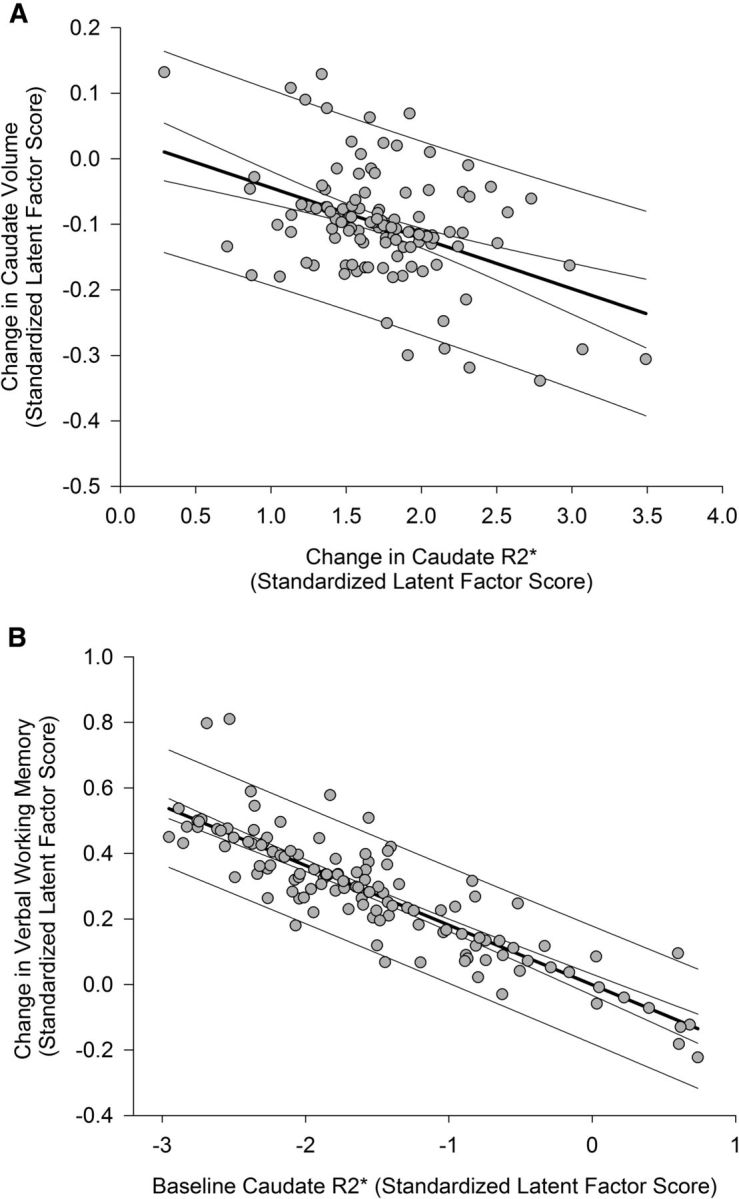
The associations between iron content and volume change in the caudate nucleus and changes in verbal working memory. Standardized latent factor scores for each latent variable were extracted from the final model and, therefore, reflect measures that are free of error and residualized on covariates (baseline age, interval between measurement occasions, and control between baseline measures and longitudinal change). Prediction limits and 95% confidence limits are shown for the regression lines. A, Longitudinal increase in iron content is associated with decrease in volume after 2 years. Positive values of change in iron content correspond to an increase over time, and negative values of change in volume indicate shrinkage. B, Greater iron content in the caudate nucleus at baseline predicted lesser repeated-testing gains in verbal working memory after 2 years. Baseline measurements were normed before model estimation, and increasing values of latent baseline iron correspond to greater iron content; positive values of latent change in verbal working memory indicate improvement in performance after 2 years.
Advanced age was associated with more iron in the Pt (r = 0.31, p = 0.002; α′ = 0.02) and smaller Pt volumes (β = −0.58, p < 0.001; α′ = 0.02) at baseline. The association between age and Pt baseline volume was larger than that of age and Pt baseline iron content (Steiger Z* = −2.90, p = 0.004). In the Cd, older adults had more baseline iron (r = 0.52, p < 0.001; α′ = 0.02) and smaller baseline volumes (r = −0.53, p < 0.001; α′ = 0.02). Furthermore, there was an indirect association between baseline iron content and shrinkage of the Cd (indirect effect, 0.03, p = 0.018; α′ = 0.03; bias-corrected bootstrapped 95% CI, 0.01/0.06): greater iron content at baseline predicted greater shrinkage after 2 years. A similar effect in the Pt was nominally significant but did not survive correction for multiple comparisons (indirect effect, 0.10, p = 0.04; α′ = 0.03; bias-corrected bootstrapped 95% CI, −0.005/0.28).
In contrast to the striatum, baseline iron content in the Hc was unrelated to shrinkage. Hc iron content was not associated with volume at baseline (r = 0.002, p = 0.98), nor were individual differences in stability of Hc iron content linked to Hc shrinkage over time (β = −0.07, p = 0.28). Advanced age was associated with greater iron content in the Hc at baseline (r = 0.25, p = 0.017; α′ = 0.02) and with smaller baseline volume (r = −0.35, p < 0.001; α′ = 0.02). However, unlike the striatum, baseline hippocampal measures were unrelated to subsequent change in iron content (r = −0.17, p = 0.11) or volume (r = −0.01, p = 0.81). Therefore, age was associated with differences at baseline, but this did not account for variability in change over time.
Association of cardiovascular and metabolic risk with iron content at baseline
The impact of health risk on change in the brain indices was modeled as MetS, a latent factor constructed of metabolic syndrome risk indicators. The MetS factor score was stable across time (mean change, 0.12, p = 0.18; bias-corrected bootstrapped 95% CI, 0.03/0.33), and in the interest of parsimony, only the baseline factor was included and treated as a time-invariant covariate.
Advanced age was associated with a higher MetS factor score (r = 0.51, p < 0.001), and men had a higher score than women did (−0.48, p < 0.001). A higher MetS factor score was associated with greater baseline iron content in the Pt (β = 0.72, p = 0.01; α′ = 0.03) but not with differences in baseline volume (r = 0.005, p = 0.91; α′ = 0.03). The MetS factor score partially accounted for differences at baseline but did not explain variability in change in iron (indirect effect, −0.18, p = 0.12). When the effect of MetS on Pt iron was not accounted for in the model, the association between longitudinal iron accumulation and shrinkage was reduced (β = −0.02, p = 0.78). The MetS factor score was unrelated to measures of the Cd (all p values ≥0.07; α′ = 0.03) or Hc (all p values ≥0.35; α′ = 0.03); therefore the MetS factor was removed from the final models testing effects in these regions.
Repeated-testing gains in working memory and regional iron and volume
Working memory was assessed in verbal and nonverbal domains. Simple effects models for change in working memory fit well: all χ2 values ≤9.02, p ≥ 0.17; RMSEA ≤0.06; CFI ≥0.98; SRMR ≤0.06. Nonverbal working memory did not change (mean change, 0.06, p = 0.30; bias-corrected bootstrapped 95% CI, −0.04/0.16), nor was there significant variability in change (σ = 0.01, p = 0.93). Therefore, this construct was not considered in the remainder of the analyses.
Verbal working memory significantly improved within 2 years (mean change, 0.28, p < 0.001; bias-corrected bootstrapped 95% CI, 0.17/0.38), and individuals varied in verbal working memory at baseline (σ = 0.55, p < 0.001) but not in the magnitude of change (σ = 0.04, p = 0.60). Advanced age was associated with poorer verbal working memory at baseline (r = −0.40, p < 0.001), although baseline differences in verbal working memory were unrelated to subsequent change (r = 0.12, p = 0.10). As a unique effect, greater baseline iron content in the Cd was associated with lesser improvement in working memory after 2 years (β = −0.18, p = 0.01; Fig. 6B). Differences in working memory gains were unrelated to baseline Cd volume (β = −0.02, p = 0.83), change in volume (r = −0.02, p = 0.16), or change in iron (r = −0.04, p = 0.46). The final model excluded nonsignificant pathways, and this model of baseline Cd iron predicting 2 year change in verbal working memory had excellent fit: χ2 = 90.44, p = 0.16; RMSEA = 0.04; CFI = 0.99; SRMR = 0.07. Additional models of Pt and Hc measures predicting change in verbal working memory were also assessed. Change in verbal working memory was unrelated to iron or volume measures in the Pt (all p values ≥0.52) or Hc (all p values ≥0.17); therefore, verbal working memory was removed from the final models estimating effects in these regions. See Figure 7 for final models of each region.
Figure 7.
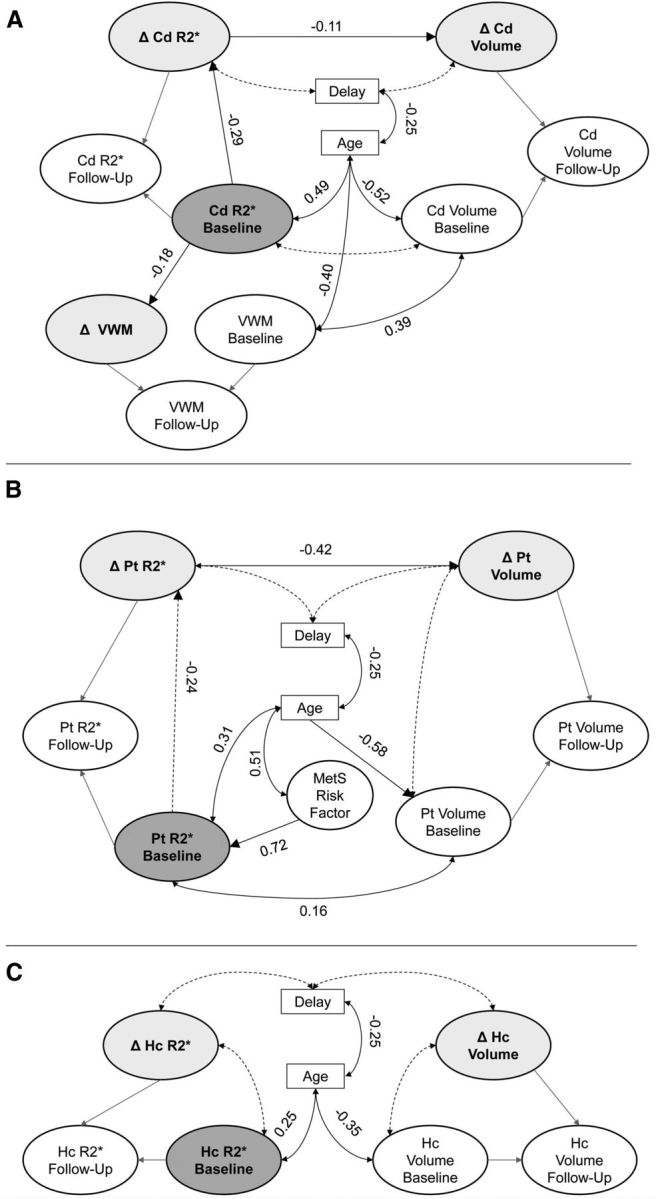
Final parallel process latent change score models of the effects in each region: A, caudate nucleus; B, putamen; C, hippocampus. Only the latent models are shown, and all specified effects are significant; the measurement models are not shown, and cross-time correlations between measurements were estimated as covariates that are not shown here. Latent change scores are shaded light gray, and the baseline iron factor is dark gray. Dashed lines indicate nonsignificant pathways that were maintained for covariate control. A, Greater baseline iron content in the caudate is indirectly associated with shrinkage (indirect effect, 0.03; p = 0.02) and predicts lesser repeated-testing gains in verbal working memory after 2 years. B, Greater baseline iron in the putamen was indirectly associated with shrinkage after 2 years (indirect effect, 0.10; p = 0.04), and greater baseline iron content is associated with increased MetS risk. C, Iron is not related to volume measures in the hippocampus. Δ, latent change; VWM, verbal working memory.
Individual differences in the stability of episodic memory were unrelated to iron and volume
The EM latent factor was constructed from two indicators of free recall, measured immediately after the story and after a 20 min delay. The simple effects model of latent change in EM had excellent fit: χ2 = 1.04, p = 0.90; RMSEA = 0.00; CFI = 1.00; SRMR = 0.01. EM did not change after 2 years (mean change, −0.02, p = 0.82; bias-corrected bootstrapped 95% CI, −0.14/0.10), but participants varied in the degree of longitudinal stability (σ = 0.52, p < 0.001) and showed individual differences at baseline (σ = 0.93, p < 0.001). Therefore, additional parallel process models were estimated to test for longitudinal change in regional iron and volume to account for individual differences in the longitudinal stability of EM.
All parallel process models that included regional brain measures and EM fit well: χ2 ≤ 145.60, p > 0.20; RMSEA ≤0.03; CFI ≥0.96; SRMR = 0.10; WRMR = 0.74. Change in iron content or volume in any region did not account for individual differences in the longitudinal stability of EM. Individual differences in the change in EM were not associated with baseline iron content (all r values −0.06 to 0.01, all p values ≥0.31) or a change therein (all r values −0.05 to 0.11, all p values ≥0.20), baseline volume (all r values −0.03 to 0.01, all p values ≥0.71), or change in volume (all r values −0.03 to 0.03, all p values ≥0.16) in any region. The nonsignificant correlations between brain measures and EM were constrained in the final models. Individual differences in EM stability were associated with baseline performance (r = −0.31, p = 0.001): individuals who performed worse at baseline demonstrated lesser stability and possible gains after repeated testing. At baseline, older adults performed worse than their younger counterparts (r = −0.19, p = 0.02).
Reverse-effects models
To test the directionality of effects, i.e., the precedence of iron accumulation before shrinkage and subsequent cognitive decline, the structural regression pathways were reversed. All reverse-effects models fit worse than the hypothesized models: all χ2 values >99.83, p ≤ 0.04; RMSEA ≥0.05; CFI <0.98; SRMR = 0.08; WRMR ≥0.78. Moreover, the reverse path of change in iron regressed on change in volume was not significant in the Cd (p = 0.25) and Pt (p = 0.11), and the reverse path between change in verbal working memory and baseline Cd iron was also not significant (p = 0.45). Finally, to confirm that winsorizing outliers did not bias the outcomes of the analyses, all models were reassessed with the original data. All reported effects remained significant (all p ≤ 0.04), except for the indirect effect in the Pt of baseline iron predicting change in volume, which was nominally significant but became a nonsignificant trend when estimating with the uncorrected data (p = 0.09).
Discussion
Long ago, Harman (1956) posited free non-heme iron as a major factor in neural and cognitive aging. Others have elaborated on this proposition (Schenck and Zimmerman, 2004; Bartzokis, 2011), but until now, the support for this hypothesis was limited to inference exclusively from cross-sectional studies. Here, we demonstrate that in normal adults, a longitudinal increase in striatal iron content over 2 years affects striatal volume and cognitive performance.
Whereas we replicated the previous findings of age differences in iron content and volume of the caudate nucleus, putamen, and hippocampus (Raz and Kennedy, 2009; Rodrigue et al., 2011; Daugherty and Raz, 2013), as well as greater brain iron content in persons with vascular risk (Rodrigue et al., 2011), our findings illustrate the discrepancy between inferences drawn from cross-sectional and longitudinal observations. Moreover, application of latent change score models allowed us to investigate individual difference in iron accumulation over time and potential determinants of individual variation. In contrast to the inference based on cross-sectional comparisons in the extant literature (Cherubini et al., 2009; Rodrigue et al., 2011, 2013), in this sample, we observed no change in hippocampal iron content and no relationship between hippocampal iron and shrinkage over 2 years. The finding of greater estimated iron content in the putamen in persons with higher vascular–metabolic risk scores replicates and expands previous reports of group differences between hypertensive and normotensive individuals (Rodrigue et al., 2011) and obese and nonobese persons (Blasco et al., 2014). Moreover, in accord with the latter study, we found a quantitative association between an index of metabolic health and regional iron content. Although the mechanisms behind these associations remain unclear, they may be plausibly linked to the reported reduction of cerebral blood flow that may impede delivery of necessary oxygen and nutrients (Grundy et al., 2005), as well as factors needed for metabolizing iron (Hare et al., 2013), in people with metabolic syndrome. In addition, as the brain vascular endothelium regulates brain iron transport (Deane et al., 2004), a decrease in blood flow may exacerbate the slowing clearance of free iron within neurons and neuropil, thus increasing the likelihood of oxidative stress and subsequent cellular damage. As we observed, even subclinical reduction in metabolic–vascular health increased iron content in the Pt, which in turn increased the likelihood of shrinkage.
Although greater iron content at baseline accounted for greater shrinkage in the striatum after 2 years, it did not predict faster accumulation of iron during the same period. To the contrary, people with higher iron content tended to show lesser change over a 2 year period. Thus, elevations in vascular–metabolic risk may increase the risk for iron accumulation and related atrophy, but decline in a rigorously selected sample of healthy adults may be constrained by a threshold that likely distinguishes aging from disease (Zecca et al., 2004; Bartzokis, 2011; Walsh et al., 2014).
Age-related iron accumulation has been proposed to account for cognitive declines (Zecca et al., 2004; Bartzokis et al., 2011; Bartzokis, 2011), yet the absence of longitudinal studies hampered the test of this proposition. With repeated-testing gains as an index of ability to acquire and retain information (Thorvaldsson et al., 2008), we demonstrate that, at least for verbal working memory, Cd iron accumulation may be an important factor in change. In a cross-sectional study of an independent sample drawn from the same population and using the same general episodic memory task, we found mediation of increased iron on episodic memory decline through decreased hippocampal, but not caudate, volume (Rodrigue et al., 2013). Notably, this contention was not supported by the longitudinal analyses, although age correlated at baseline with hippocampal iron, volume, and episodic memory. Furthermore, longitudinal estimates of change in striatal iron were larger than cross-sectional estimates (Li et al., 2013), despite similar baseline age differences to cross-sectional reports (Daugherty and Raz, 2013). These discrepancies are in accord with the proposition that cross-sectional studies provide a biased estimate of change, whereas longitudinal study is a more accurate portrayal of the gradual aging process (Maxwell and Cole, 2007; Raz and Lindenberger, 2010; Lindenberger et al., 2011). The lack of change in hippocampal R2* was unlikely to reflect the modest stability of the measurements because of explicit estimation of error in the latent factors, which was an advantage of LCSM.
Our results suggest a complex chain of events in which advanced age, via multiple risk factors, brings about metabolic changes that result in a gradual increase in iron burden, which in turn promotes shrinkage of the most vulnerable regions (e.g., caudate nucleus) and affects the ability to process and retain verbal information. Although we found no evidence to support a reversed causality chain in this sample, it remains possible that changes in cognitive ability signal far-reaching behavioral declines that reciprocally affect vascular risk and brain health. To disentangle these complex factors, a long-term, multiwave longitudinal study is needed.
Regional differences in iron content may stem from metabolic demands of neural function. For example, an increase in striatal iron content may initially reflect a response to regional metabolic demands, such as dopaminergic transmission (Bäckman et al., 2006; Berg et al., 2007), but eventually devolves into accumulation of the potent oxidant that sets a cascade of neural disruption and degradation (Zecca et al., 2004; Mills et al., 2010; Hare et al., 2013). The reasons for this switch in cellular iron metabolism from benefit to detriment are unclear. It is plausible that age-related energetic dysfunction is at the foundation of this phenomenon. Mitochondria that require iron for ATP synthesis are gradually failing, and their failure upsets the dynamic equilibrium of iron supply and demand, thus gradually moving the concentration of cellular iron to a progressively more dangerous level (Zecca et al., 2004; Mills et al., 2010; Hare et al., 2013). Testing such a hypothesis is beyond the scope of this study but can be accomplished in the future by pairing a detailed assessment of metabolic dynamics with the evaluation of iron content.
The findings reported here should be interpreted in the context of the study limitations. First, R2* (or its reciprocal, T2*) is a sensitive, but not specific, measure of iron in the brain. Differences in R2* can be influenced by the accumulation of other elements (Haacke et al., 2005), such as calcium, which may increase in subcortical regions with age (Naderi et al., 1993) and can be distinguished from iron only with phase-based MRI methods (Haacke et al., 2005). Future longitudinal studies may benefit from including several iron imaging methods to allow potentially more sensitive and more specific measurements (Haacke et al., 2015). Validity of R2* as an index of iron content may be also threatened by regional differences in myelination (Fukunaga et al., 2010; Langkammer et al., 2012; Lodygensky et al., 2012), although myelin-related bias in estimates of age differences in striatal iron is likely negligible (Daugherty and Raz, 2013). In contrast to the striatum, Hc may contain noniron components that affect R2*, e.g., myelin or amyloid (Quintana et al., 2006). Indeed, the sensitivity of R2* to these intrinsic tissue characteristics may explain image inhomogeneity that required filtering before R2* estimation.
Second, having two longitudinal measures enabled an accurate estimation of linear change only (McArdle and Hamagami, 2001), although even a limited longitudinal design provides more valid estimates of change than cross-sectional comparisons. Future studies with more than three measurement occasions will be able to examine nonlinear change.
Third, the sample size was sufficient to test the hypotheses, but it was vulnerable to attrition: ∼37% of the baseline sample did not return for longitudinal assessment, and the dropouts were younger than those who remained in the study. Although the possible bias of nonrandom attrition was addressed by including age in the models and by using the FIML estimation method, we cannot eliminate entirely the possibility that selective attrition influenced the results reported here. As this sample is part of an ongoing longitudinal study, in the future, we will examine change in regional iron with additional measurements and longer delays and attempt to reduce the attrition rate in subsequent assessments.
Finally, the observational longitudinal models without experimental manipulations cannot establish causality among factors. Intervention studies in animals support the precedence of iron accumulation to cognitive and neural decline (Zhang et al., 2009), and our models that test this hypothesis represented the observed data well. Yet, for testing the temporal order hypothesis, a longitudinal study with multiple occasions is needed, and to what extent observational studies can assess causality remains questionable (Winship and Morgan, 1999; Rubin, 2005; Pearl, 2014a,b).
Conclusion
This is the first longitudinal evidence for subcortical non-heme iron accumulation as a factor in cognitive aging. The results suggest that iron accumulation may precede striatal shrinkage, with increased metabolic risk moderating the relationship. Notably, increased iron deposition in the caudate is associated with lesser repeated-exposure gains in verbal working memory. Thus, high iron content may be a biomarker of neural and cognitive declines in normal aging.
Footnotes
This work was supported by National Institute on Aging Grant R37 AG011230 to N.R. and Blue Cross Blue Shield of Michigan Foundation student awards program Grant 1893.SAP to A.M.D.
The authors declare no competing financial interests.
References
- Apter NS, Halstead WC, Heimburger RF. Impaired cerebral functions in essential hypertension. Am J Psychiatry. 1951;107:808–813. doi: 10.1176/ajp.107.11.808. [DOI] [PubMed] [Google Scholar]
- Bäckman L, Nyberg L, Lindenberger U, Li SC, Farde L. The correlative triad among aging, dopamine, and cognition: current status and future prospects. Neurosci Biobehav Rev. 2006;30:791–807. doi: 10.1016/j.neubiorev.2006.06.005. [DOI] [PubMed] [Google Scholar]
- Bartzokis G. Alzheimer's disease as homeostatic responses to age-related myelin breakdown. Neurobiol Aging. 2011;32:1341–1371. doi: 10.1016/j.neurobiolaging.2009.08.007. [DOI] [PMC free article] [PubMed] [Google Scholar]
- Bartzokis G, Lu PH, Tingus K, Peters DG, Amar CP, Tishler TA, Finn JP, Villablanca P, Altshuler LL, Mintz J, Neely E, Connor JR. Gender and iron genes may modify associations between brain iron and memory in healthy aging. Neuropsychopharmacology. 2011;36:1375–1384. doi: 10.1038/npp.2011.22. [DOI] [PMC free article] [PubMed] [Google Scholar]
- Berg D, Kruger R, Rieß R, Riederer P. Parkinson's disease. In: Youdim M, Riederer P, Mandel S, Battistin L, editors. Handbook of neurochemistry and molecular neurobiology: degenerative diseases of the nervous system. Ed 3. New York: Springer; 2007. pp. 1–20. [Google Scholar]
- Blasco G, Puig J, Daunis-I-Estadella J, Molina X, Xifra G, Fernández-Aranda F, Pedraza S, Ricart W, Portero-Otín M, Fernández-Real J. Brain iron overload, insulin resistance and cognitive performance in obese subjects: a preliminary MRI case-control study. Diabetes Care. 2014;37:3076–3083. doi: 10.2337/dc14-0664. [DOI] [PubMed] [Google Scholar]
- Braver TS, Barch DM. A theory of cognitive control, aging cognition, and neuromodulation. Neurosci Biobehav Rev. 2002;26:809–817. doi: 10.1016/s0149-7634(02)00067-2. [DOI] [PubMed] [Google Scholar]
- Cherubini A, Peran P, Caltagirone C, Sabatini U, Spalletta G. Aging of subcortical nuclei: microstructural, mineralization and atrophy modifications measured in vivo using MRI. Neuroimage. 2009;48:29–36. doi: 10.1016/j.neuroimage.2009.06.035. [DOI] [PubMed] [Google Scholar]
- Cherbuin N, Sachdev P, Anstey KJ. Higher normal fasting plasma glucose is associated with hippocampal atrophy: the PATH Study. Neurology. 2012;79:1019–1026. doi: 10.1212/WNL.0b013e31826846de. [DOI] [PubMed] [Google Scholar]
- Dahle CL, Jacobs BS, Raz N. Aging, vascular risk and cognition: blood glucose, pulse pressure, and cognitive performance in healthy adults. Psychol Aging. 2009;24:154–162. doi: 10.1037/a0014283. [DOI] [PMC free article] [PubMed] [Google Scholar]
- Daugherty A, Raz N. Age-related differences in iron content of subcortical nuclei observed in vivo: a meta-analysis. Neuroimage. 2013;70:113–121. doi: 10.1016/j.neuroimage.2012.12.040. [DOI] [PMC free article] [PubMed] [Google Scholar]
- Deane R, Zheng W, Zlokovic BV. Brain capillary endothelium and choroid plexus epithelium regulate transport of transferrin-bound and free iron into the rat brain. J Neurochem. 2004;88:813–820. doi: 10.1046/j.1471-4159.2003.02221.x. [DOI] [PMC free article] [PubMed] [Google Scholar]
- Dobbs AR, Rule BG. Adult age differences in working memory. Psychol Aging. 1989;4:500–503. doi: 10.1037//0882-7974.4.4.500. [DOI] [PubMed] [Google Scholar]
- Engle RW, Cantor J, Carullo J. Individual differences in working memory and comprehension: a test of four hypotheses. J Exp Psychol Learn Mem Cogn. 1992;18:972–992. doi: 10.1037//0278-7393.18.5.972. [DOI] [PubMed] [Google Scholar]
- Finch CE, Morgan TE. Systemic inflammation, infection, ApoE alleles, and Alzheimer disease: a position paper. Curr Alzheimer Res. 2007;4:185–189. doi: 10.2174/156720507780362254. [DOI] [PubMed] [Google Scholar]
- Folstein MF, Folstein SE, McHugh PR. “Mini-mental state.” A practical method for grading the cognitive state of patients for the clinician. J Psych Res. 1975;12:189–198. doi: 10.1016/0022-3956(75)90026-6. [DOI] [PubMed] [Google Scholar]
- Franklin SS, Gustin WT, Wong ND, Larson MG, Weber MA, Kannel WB, Levy D. Hemodynamic patterns of age-related changes in blood pressure. The Framingham Heart Study. Circulation. 1997;96:308–315. doi: 10.1161/01.cir.96.1.308. [DOI] [PubMed] [Google Scholar]
- Fukunaga M, Li TQ, van Gelderen P, de Zwart JA, Shmueli K, Yao B, Lee J, Maric D, Aronova MA, Zhang G, Leapman RD, Schenck JF, Merkle H, Duyn JH. Layer-specific variation of iron content in cerebral cortex as a source of MRI contrast. Proc Natl Acad Sci U S A. 2010;107:3834–3839. doi: 10.1073/pnas.0911177107. [DOI] [PMC free article] [PubMed] [Google Scholar]
- Ghugre NR, Coates TD, Nelson MD, Wood JC. Mechanisms of tissue-iron relaxtivity: nuclear magnetic resonance studies of human liver biopsy specimens. Magn Reson Med. 2005;54:1185–1193. doi: 10.1002/mrm.20697. [DOI] [PMC free article] [PubMed] [Google Scholar]
- Gomori JM, Grossman RI. The relation between regional brain iron and T2 shortening. AJNR. 1993;14:1049–1050. [PMC free article] [PubMed] [Google Scholar]
- Grundy SM, Cleeman JI, Daniels SR, Donato KA, Eckel RH, Franklin BA, Gordon DJ, Krauss RM, Savage PJ, Smith SC, Jr, Spertus JA, Costa F. Diagnosis and management of the metabolic syndrome: an American Heart Association/National Heart, Lung, and Blood Institute scientific statement. Circulation. 2005;112:2735–2752. doi: 10.1161/CIRCULATIONAHA.105.169404. [DOI] [PubMed] [Google Scholar]
- Haacke EM, Cheng NYC, House MJ, Liu Q, Neelavalli J, Ogg RJ, Khan A, Ayaz M, Kirsch W, Obenaus A. Imaging iron stores in the brain using magnetic resonance imaging. JMRI. 2005;23:1–25. doi: 10.1016/j.mri.2004.10.001. [DOI] [PubMed] [Google Scholar]
- Haacke EM, Miao Y, Liu M, Habib CA, Katkuri Y, Liu T, Yang Z, Lang Z, Hu J, Wu J. Correlation of putative iron content as represented by changes in R2* and phase with age in deep gray matter of healthy adults. JMRI. 2010;32:561–576. doi: 10.1002/jmri.22293. [DOI] [PMC free article] [PubMed] [Google Scholar]
- Haacke EM, Liu S, Buch S, Zheng W, Wu D, Ye Y. Quantitative susceptibility mapping: current status and future directions. Magn Reson Imaging. 2015;33:1–25. doi: 10.1016/j.mri.2014.09.004. [DOI] [PubMed] [Google Scholar]
- Haider L, Simeonidou C, Steinberger G, Hametner S, Grigoriadis N, Deretzi G, Kovacs GG, Kutzelnigg A, Lassmann H, Frischer JM. Multiple sclerosis deep grey matter: the relation between demyelination, neurodegeneration, inflammation and iron. J Neurol Neurosurg Psychiatry. 2014;85:1386–1395. doi: 10.1136/jnnp-2014-307712. [DOI] [PMC free article] [PubMed] [Google Scholar]
- Hallgren B, Sourander P. The effect of age on the non-haemin iron in the human brain. J Neurochem. 1958;3:41–51. doi: 10.1111/j.1471-4159.1958.tb12607.x. [DOI] [PubMed] [Google Scholar]
- Hare D, Ayton S, Bush A, Lei P. A delicate balance: iron metabolism and diseases of the brain. Front Aging Neurosci. 2013;5:34. doi: 10.3389/fnagi.2013.00034. [DOI] [PMC free article] [PubMed] [Google Scholar]
- Harman D. Aging: a theory based on free radical and radiation chemistry. J Gerontol. 1956;11:298–300. doi: 10.1093/geronj/11.3.298. [DOI] [PubMed] [Google Scholar]
- Hayes AF, Scharkow M. The relative trustworthiness of inferential tests of the indirect effect in statistical mediation analysis: Does method really matter? Psych Sci. 2013;24:1918–1927. doi: 10.1177/0956797613480187. [DOI] [PubMed] [Google Scholar]
- Hultsch DF, Hertzog C, Dixon RA. Ability correlates of memory performance in adulthood and aging. Psychol Aging. 1990;5:356–368. doi: 10.1037//0882-7974.5.3.356. [DOI] [PubMed] [Google Scholar]
- Jack CR, Jr, Twomey CK, Zinsmeister AR, Sharbrough FW, Petersen RC, Cascino GD. Anterior temporal lobes and hippocampal formations: normative volumetric measurements from MR images in young adults. Radiology. 1989;172:549–554. doi: 10.1148/radiology.172.2.2748838. [DOI] [PubMed] [Google Scholar]
- James LR, Brett JM. Mediators, moderators, and tests for mediation. J Appl Psychol. 1984;69:307–321. [Google Scholar]
- Korf ES, White LR, Scheltens P, Launer LJ. Midlife blood pressure and the risk of hippocampal atrophy: The Honolulu Asia Aging Study. Hypertension. 2004;44:29–34. doi: 10.1161/01.HYP.0000132475.32317.bb. [DOI] [PubMed] [Google Scholar]
- Kroll JF, Potter MC. Recognizing words, pictures and concepts: a comparison of lexical, object and reality decisions. J Verbal Learn Verbal Behav. 1984;23:39–66. [Google Scholar]
- Langkammer C, Krebs N, Goessler W, Scheurer E, Yen K, Fazekas F, Ropele S. Susceptibility induced gray-white matter MRI contrast in the human brain. Neuroimage. 2012;59:1413–1419. doi: 10.1016/j.neuroimage.2011.08.045. [DOI] [PMC free article] [PubMed] [Google Scholar]
- Larsen R. Missing data imputation versus full information maximum likelihood with second-level dependencies. Struct Equation Model Multidisc J. 2011;18:649–662. [Google Scholar]
- Li W, Wu B, Batrachenko A, Bancroft-Wu V, Morey RA, Shashi V, Langkammer C, De Bellis MD, Ropele S, Song AW, Liu C. Differential developmental trajectories of magnetic susceptibility in human brain gray and white matter over the lifespan. Hum Brain Map. 2013;35:2698–2713. doi: 10.1002/hbm.22360. [DOI] [PMC free article] [PubMed] [Google Scholar]
- Lindenberger U, von Oertzen T, Ghisletta P, Hertzog C. Cross-sectional age variance extraction: what's change got to do with it? Psychol Aging. 2011;26:34–47. doi: 10.1037/a0020525. [DOI] [PubMed] [Google Scholar]
- Lodygensky GA, Marques JP, Maddage R, Perroud E, Sizonenko SV, Hüppi PS, Gruetter R. In vivo assessment of myelination by phase imaging at high magnetic field. Neuroimage. 2012;59:1979–1987. doi: 10.1016/j.neuroimage.2011.09.057. [DOI] [PubMed] [Google Scholar]
- Lorio S, Lutti A, Kherif F, Ruef A, Dukart J, Chowdhury R, Frackowiak RS, Ashburner J, Helms G, Weiskopf N, Draganski B. Disentangling in vivo the effects of iron content and atrophy on the ageing human brain. Neuroimage. 2014;103:280–289. doi: 10.1016/j.neuroimage.2014.09.044. [DOI] [PMC free article] [PubMed] [Google Scholar]
- Maxwell SE, Cole DA. Bias in cross-sectional analyses of longitudinal mediation. Psychol Methods. 2007;12:23–44. doi: 10.1037/1082-989X.12.1.23. [DOI] [PubMed] [Google Scholar]
- McArdle JJ. A latent difference score approach to longitudinal dynamic structural analyses. In: Cudeck R, du Toit S, Sorbom D, editors. Structural equation modeling: present and future. Lincolnwood, IL: Scientific Software International; 2001. pp. 342–380. [Google Scholar]
- McArdle JJ, Hamagami F. Latent difference score structural models for linear dynamic analyses with incomplete longitudinal data. In: Collins LM, Sayer AG, editors. New methods for the analysis of change. Decade of behavior. Washington, DC: APA; 2001. pp. 139–175. [Google Scholar]
- Mills E, Dong XP, Wang F, Xu H. Mechanisms of brain iron transport: insight into neurodegeneration and CNS disorders. Future Med Chem. 2010;2:51–64. doi: 10.4155/fmc.09.140. [DOI] [PMC free article] [PubMed] [Google Scholar]
- Muthén B, Kaplan D, Hollis M. On structural equation modeling with data that are not missing completely at random. Psychometrika. 1987;52:431–462. [Google Scholar]
- Naderi S, Colakoğlu Z, Lüleci G. Calcification of basal ganglia associated with pontine calcification in four cases: a radiologic and genetic study. Clin Neurol Neurosurg. 1993;95:155–157. doi: 10.1016/0303-8467(93)90012-6. [DOI] [PubMed] [Google Scholar]
- Oldfield RC. The assessment and analysis of handedness: the Edinburgh inventory. Neuropsychologica. 1971;9:97–113. doi: 10.1016/0028-3932(71)90067-4. [DOI] [PubMed] [Google Scholar]
- Pearl J. Interpretation and identification of causal mediation. Psychol Methods. 2014a;19:459–481. doi: 10.1037/a0036434. [DOI] [PubMed] [Google Scholar]
- Pearl J. Reply to commentary by Imai, Keele, Tingley, and Yamamoto, concerning causal mediation analysis. Psychol Methods. 2014b;19:488–492. doi: 10.1037/met0000022. [DOI] [PubMed] [Google Scholar]
- Penke L, Valdés Hernandéz MC, Maniega SM, Gow AJ, Murray C, Starr JM, Bastin ME, Deary IJ, Wardlaw JM. Brain iron deposits are associated with general cognitive ability and cognitive aging. Neurobiol Aging. 2012;33:510–517.e2. doi: 10.1016/j.neurobiolaging.2010.04.032. [DOI] [PubMed] [Google Scholar]
- Persson N, Ghisletta P, Dahle CL, Bender AR, Yang Y, Yuan P, Daugherty AM, Raz N. Regional brain shrinkage over two years: individual differences and effects of pro-inflammatory genetic polymorphisms. Neuroimage. 2014;103:334–348. doi: 10.1016/j.neuroimage.2014.09.042. [DOI] [PMC free article] [PubMed] [Google Scholar]
- Pujol J, Junqué C, Vendrell P, Grau JM, Martí-Vilalta JL, Olivé C, Gili J. Biological significance of iron-related magnetic resonance imaging changes in the brain. Arch Neurol. 1992;49:711–717. doi: 10.1001/archneur.1992.00530310053012. [DOI] [PubMed] [Google Scholar]
- Quintana C, Bellefqih S, Laval JY, Guerquin-Kern JL, Wu TD, Avila J, Ferrer I, Arranz R, Patiño C. Study of the localization of iron, ferritin, and hemosiderin in Alzheimer's disease hippocampus by analytical microscopy at the subcellular level. J Struct Biol. 2006;153:42–54. doi: 10.1016/j.jsb.2005.11.001. [DOI] [PubMed] [Google Scholar]
- Radloff LS. The CES-D scale: a self-report depression scale for research in the general population. Appl Psychol Meas. 1977;1:385–401. doi: 10.1177/014662167700100306. [DOI] [Google Scholar]
- Raykov T, Marcoulides GA. A first course in structural equation modeling. Ed 2. Mahwah, NJ: Erlbaum; 2006. [Google Scholar]
- Raz N, Kennedy KM. A systems approach to the aging brain: neuroanatomic changes, their modifiers, and cognitive correlates. In: Jagust W, D'Esposito M, editors. Imaging the aging brain. Oxford: Oxford UP; 2009. pp. 43–70. [Google Scholar]
- Raz N, Lindenberger U. News of cognitive cure for age-related brain shrinkage is premature: a comment on Burgmans et al. (2009) Neuropsychology. 2010;24:255–257. doi: 10.1037/a0018828. [DOI] [PMC free article] [PubMed] [Google Scholar]
- Raz N, Rodrgiue KM, Acker JD. Hypertension and the brain: vulnerability of the prefrontal regions and executive functions. Behav Neurosci. 2003;117:1169–1180. doi: 10.1037/0735-7044.117.6.1169. [DOI] [PubMed] [Google Scholar]
- Raz N, Rodrigue KM, Head D, Kennedy KM, Acker JD. Differential aging of the medial temporal lobe: a study of a five-year change. Neurology. 2004;62:433–438. doi: 10.1212/01.wnl.0000106466.09835.46. [DOI] [PubMed] [Google Scholar]
- Raz N, Lindenberger U, Rodrigue KM, Kennedy KM, Head D, Williamson A, Dahle C, Gerstorf D, Acker JD. Regional brain changes in aging healthy adults: general trends, individual differences, and modifiers. Cereb Cortex. 2005;15:1676–1689. doi: 10.1093/cercor/bhi044. [DOI] [PubMed] [Google Scholar]
- Raz N, Rodrigue KM, Haacke EM. Brain aging and its modifiers: insights from in vivo neuromophometry and susceptibility weighted imaging. Ann N Y Acad Sci. 2007;1097:84–93. doi: 10.1196/annals.1379.018. [DOI] [PMC free article] [PubMed] [Google Scholar]
- Rodrigue KM, Haacke EM, Raz N. Differential effects of age and history of hypertension of regional brain volumes and iron. Neuroimage. 2011;54:750–759. doi: 10.1016/j.neuroimage.2010.09.068. [DOI] [PMC free article] [PubMed] [Google Scholar]
- Rodrigue KM, Daugherty AM, Haacke EM, Raz N. The role of hippocampal iron concentration and hippocampal volume in age-related differences in memory. Cereb Cortex. 2013;23:1533–1541. doi: 10.1093/cercor/bhs139. [DOI] [PMC free article] [PubMed] [Google Scholar]
- Rubin Causal inference using potential outcomes: design, modeling, decisions. J Am Stat Assoc. 2005;100:322–331. doi: 10.1198/016214504000001880. [DOI] [Google Scholar]
- Salerno JA, Murphy DG, Horwitz B, DeCarli C, Haxby JV, Rapoport SI, Schapiro MB. Brain atrophy in hypertension: a volumetric magnetic resonance imaging study. Hypertension. 1992;20:340–348. doi: 10.1161/01.HYP.20.3.340. [DOI] [PubMed] [Google Scholar]
- Salthouse TA. The nature of the influence of speed on adult age differences in cognition. Dev Psychol. 1994;30:240–259. doi: 10.1037//0278-7393.20.6.1486. [DOI] [PubMed] [Google Scholar]
- Salthouse TA. General and specific speed mediation of adult age differences in memory. J Gerontol B Psychol Sci Soc Sci. 1996;51:P30–P42. doi: 10.1093/geronb/51b.1.p30. [DOI] [PubMed] [Google Scholar]
- Salthouse TA, Babcock RL. Decomposing adult age differences in working memory. Dev Psy. 1991;27:763–776. [Google Scholar]
- Salthouse TA, Hancock HE, Meinz EJ, Hambrick DZ. Interrelations of age, visual acuity, and cognitive functioning. J Gerontol B Psychol Sci Soc Sci. 1996;51:P317–P330. doi: 10.1093/geronb/51b.6.p317. [DOI] [PubMed] [Google Scholar]
- Schenck JF, Zimmerman EA. High-field magnetic resonance imaging of brain iron: birth of a biomarker? NMR Biomed. 2004;17:433–445. doi: 10.1002/nbm.922. [DOI] [PubMed] [Google Scholar]
- Shing YL, Rodrigue KM, Kennedy KM, Fandakova Y, Bodammer N, Werkle-Bergner M, Lindenberger U, Raz N. Hippocampal subfield volumes: age, vascular risk, and correlation with associative memory. Front Aging Neurosci. 2011;3:2. doi: 10.3389/fnagi.2011.00002. [DOI] [PMC free article] [PubMed] [Google Scholar]
- Shrout PE, Fleiss JL. Intraclass correlations: uses in assessing raters reliability. Psychol Bull. 1979;86:420–428. doi: 10.1037//0033-2909.86.2.420. [DOI] [PubMed] [Google Scholar]
- Sullivan EV, Adalsteinsson E, Rohlfing T, Pfefferbaum A. Relevance of iron deposition in deep gray matter brain structures to cognitive and motor performance in healthy elderly men and women: exploratory findings. Brain Imaging Behav. 2009;3:167–175. doi: 10.1007/s11682-008-9059-7. [DOI] [PMC free article] [PubMed] [Google Scholar]
- Thomas LO, Boyko OB, Anthony DC, Burger PC. MR detection of brain iron. Am J Neuroradiol. 1993;14:1043–1048. [PMC free article] [PubMed] [Google Scholar]
- Thorvaldsson B, Hofer SM, Hassing LB, Johansson B. Cognitive change as conditional on age heterogeneity in onset of mortality-related processes and repeated testing effects. In: Hoffer SM, Alwin DF, editors. Handbook of cognitive aging: interdisciplinary perspectives. Thousand Oaks, CA: Sage Publications; 2008. p. 248ff. [Google Scholar]
- Todorich B, Pasquini JM, Garcia CI, Paez PM, Connor JR. Oligodendrocytes and myelination: the role of iron. Glia. 2009;57:467–478. doi: 10.1002/glia.20784. [DOI] [PubMed] [Google Scholar]
- Ulla M, Bonny JM, Ouchchane L, Rieu I, Claise B, Durif F. Is R2* a new MRI biomarker for the progression of Parkinson's disease? A longitudinal follow-up. PLoS One. 2013;8:e57904. doi: 10.1371/journal.pone.0057904. [DOI] [PMC free article] [PubMed] [Google Scholar]
- Waldstein SR, Manuck SB, Ryan CM, Muldoon MF. Neuropsychological correlates of hypertension: review and methodologic considerations. Psychol Bull. 1991;110:451–468. doi: 10.1037/0033-2909.110.3.451. [DOI] [PubMed] [Google Scholar]
- Walsh AJ, Blevins G, Lebel RM, Seres P, Emery DJ, Wilman AH. Longitudinal MR imaging of iron in multiple sclerosis: an imaging marker of disease. Radiology. 2014;270:186–196. doi: 10.1148/radiol.13130474. [DOI] [PubMed] [Google Scholar]
- Wechsler D. Manual for Wechsler Memory Scale-Revised. Psychological Corporation. San Antonio, TX: Pearson Education; 1987. [Google Scholar]
- Winship C, Morgan SL. The estimation of causal effects from observational data. Ann Rev Sociol. 1999;25:659–706. doi: 10.1146/annurev.soc.25.1.659. [DOI] [Google Scholar]
- Wood JC, Fassler JD, Meade T. Mimicking liver iron overload using liposomal ferritin preparations. Magn Reson Med. 2004;51:607–611. doi: 10.1002/mrm.10735. [DOI] [PMC free article] [PubMed] [Google Scholar]
- Zecca L, Youdim MB, Riederer P, Connor JR, Crichton RR. Iron, brain ageing and neurodegenerative disorders. Nat Rev Neurosci. 2004;5:863–873. doi: 10.1038/nrn1537. [DOI] [PubMed] [Google Scholar]
- Zhang S, Wang J, Song N, Xie J, Jiang H. Up-regulation of divalent metal transporter 1 is involved in 1-methyl-4-phenylpyridinium (MPP+)-induced apoptosis in MES23.5 cells. Neurobiol Aging. 2009;30:1466–1476. doi: 10.1016/j.neurobiolaging.2007.11.025. [DOI] [PubMed] [Google Scholar]