

Abstract
Oscillatory activity in both beta and gamma ranges has been recorded in the subthalamic nucleus (STN) of Parkinson's disease (PD) patients and linked to motor function, with beta activity considered antikinetic, and gamma activity, prokinetic. However, the extent to which nonmotor networks contribute to this activity is unclear. This study uses hemiparkinsonian rats performing a treadmill walking task to compare synchronized STN local field potential (LFP) activity with activity in motor cortex (MCx) and medial prefrontal cortex (mPFC), areas involved in motor and cognitive processes, respectively. Data show increases in STN and MCx 29–36 Hz LFP spectral power and coherence after dopamine depletion, which are reduced by apomorphine and levodopa treatments. In contrast, recordings from mPFC 3 weeks after dopamine depletion failed to show peaks in 29–36 Hz LFP power. However, mPFC and STN both showed peaks in the 45–55 Hz frequency range in LFP power and coherence during walking before and 21 days after dopamine depletion. Interestingly, power in this low gamma range was transiently reduced in both mPFC and STN after dopamine depletion but recovered by day 21. In contrast to the 45–55 Hz activity, the amplitude of the exaggerated 29–36 Hz rhythm in the STN was modulated by paw movement. Furthermore, as in PD patients, after dopamine treatment a third band (high gamma) emerged in the lesioned hemisphere. The results suggest that STN integrates activity from both motor and cognitive networks in a manner that varies with frequency, behavioral state, and the integrity of the dopamine system.
Keywords: beta oscillation, dopamine, gamma oscillations, medial prefrontal cortex, Parkinson's disease, subthalamic nucleus
Introduction
Structural and functional connectivity studies indicate that the STN is an important point of integration of both motor and associative/limbic input into the basal ganglia circuit (Kolomiets et al., 2001; Tan et al., 2006; Temel et al., 2006; Brunenberg et al., 2012; Haynes and Haber, 2013). This observation appears particularly relevant to the emergence of the STN as a target for therapeutic treatment of motor symptoms in PD. Deep brain stimulation (DBS) of the STN, while most effective at reversing motor symptoms, can also affect nonmotor symptoms in both positive and negative ways, supporting a role for this nucleus in integrating both motor and nonmotor input (Biseul et al., 2005; Castrioto et al., 2014; Eisenstein et al., 2014; Jahanshahi et al., 2015; Rektor et al., 2015).
The use of DBS in the treatment of PD has additionally provided the opportunity to monitor STN activity during electrode implantation and allowed insight into the changes in network activity that give rise to parkinsonian symptoms (Levy et al., 2002; Eusebio and Brown, 2007; Stein and Bar-Gad, 2013; Friston et al., 2015). LFP recordings show synchronized and oscillatory activity in the STN that varies in peak frequency and power with drug treatment and the behavioral state of the patient. Most notably, excessive beta range (12–30 Hz) synchronization and gamma (30–300 Hz) oscillations have been reported (Brown et al., 2001, 2003; Foffani et al., 2003; Priori et al., 2004; Alegre et al., 2005; Alonso-Frech et al., 2006; López-Azcarate et al., 2010; Jenkinson and Brown, 2011; Florin et al., 2013; Jenkinson et al., 2013). These observations raise questions about the sources and functional significance of the different types of oscillatory and synchronized activity observed in the STN of PD patients. While different frequency ranges have been shown to be associated with different behavioral states in animal models of PD (Brown et al., 2002; Sharott et al., 2005; Brazhnik et al., 2014; Delaville et al., 2014), different frequencies could also reflect activity in different networks, such as limbic/cognitive versus motor networks (Fogelson et al., 2006; Oswal et al., 2013; Brittain and Brown, 2014).
The present study used a well characterized rodent model of PD, the rat with unilateral 6-hydroxydopamine (6-OHDA)-induced lesion, and a circular treadmill walking task to compare the relationships between synchronized oscillatory activity in the STN with synchronized activity in the motor cortex (MCx) and the mPFC. These two cortical areas are both directly and indirectly connected to the STN and known to be involved in motor and cognitive processes, respectively, across different behavioral states. The goal was to gain insight into how changes in behavior state and dopamine receptor stimulation differentially affect the impact of motor and limbic/cognitive circuits on STN oscillatory activity. A further goal was to assess how differences in STN-mPFC LFP coherence versus STN-MCx LFP coherence relate to changes in spike/LFP phase locking within and between these regions.
Materials and Methods
All experimental procedures were conducted in accordance with the NIH Guide for Care and Use of Laboratory Animals and approved by NINDS Animal Care and Use Committee. Every effort was made to minimize the number of animals used and their discomfort.
Subjects and behavioral training.
Male Long–Evans rats (Charles River), weighing 280–300 g, were housed with ad libitum access to chow and water in environmentally controlled conditions with a reversed 12 h light/dark cycle (lights on at 9:00 h). A week before the surgery, rats were handled daily and trained to walk on a circular rotating treadmill equipped with a paddle to encourage continuous walking (Avila et al., 2010). This task involves both motor (locomotion) and cognitive (attention) processes.
Surgical procedures.
During surgery, a guide cannula was implanted in the left medial forebrain bundle (MFB) to induce the unilateral lesion of the nigrostriatal pathway. Additionally, electrodes were implanted in the MCx, mPFC, and STN for LFP and spikes recordings. Rats were anesthetized with 75 mg/kg ketamine and 0.5 mg/kg medetomidine intraperitoneally (i.p.), and placed in a stereotaxic frame (David Kopf Instruments) with heads fixed with atraumatic ear bars. The incision area was shaved and a long-acting local anesthetic (1% Polocaine solution) was injected along the intended incision lines. Ophthalmic ointment was applied to prevent corneal dehydration and lidocaine gel was placed in the ear canals. A heating pad was used to maintain body temperature at 37°C. Small supplemental doses of ketamine were administered during the surgery as needed. As the cannula used to lesion the dopamine cell is 1 mm longer than its guide, standard stereotaxic procedures were used to place the guide cannula 1 mm dorsal to the MFB: AP: 4.4 mm from the lambdoid suture, L: 1.4 mm from the sagittal suture, and DV: 7 mm below the skull surface.
During surgery, holes were drilled in the skull above the target coordinates for the mPFC (AP: 4.0 mm from the bregma, L: 0.6 mm from the sagittal suture, and DV: 4.0 mm below the skull surface), MCx (AP: 2.0 mm from bregma, L: 2.5 mm from the sagittal suture, and DV: 2.0 mm below the skull surface), and STN (AP: 5.4 mm from the lambda, L: 2.5 mm from the sagittal suture, and DV: 7.8 mm below the skull surface). Electrode bundles, each consisting of eight stainless steel 50 μm Teflon-insulated microwires plus an additional ninth wire with no insulation for ∼1 mm on the recording tip, which served as a local reference (NB Laboratories), were implanted into the target regions and secured to the skull with screws and dental cement. Bundles had diameters of∼350 μm. Ground wires from each set of electrodes were wrapped around a screw located above the cerebellum and served as an instrument ground. After completion of surgeries, 0.15% of ketoprofen in 0.9% NaCl solution was given subcutaneously, and atipamezole (0.3–0.5 mg/kg, s.c.) was administered to reverse the effect of medetomidine. During the first week of postoperative recovery, the rat's diet was supplemented with fruit and bacon treats. Rats were retrained at the rotating treadmill walking task from the fourth postoperative day.
Unilateral lesion of the nigrostriatal pathway.
After recovery from the surgery and recordings in the control state, rats were given a unilateral intracerebral injection of 6-OHDA to lesion the dopaminergic nigrostriatal neurons. The 6-OHDA injection was preceded by administration of 15 mg/kg desipramine (i.p.) to protect norepinephrine neurons. Six micrograms of 6-OHDA-hydrobromide in 3 μl of 0.9% saline with 0.01% ascorbic acid was infused via the guide cannula using an internal cannula into the MFB at a rate of 1 μl/min over 3 min via a syringe pump (Harvard Apparatus). The cannula remained at the target site for 3 min after the completion of the infusion to prevent diffusion of the neurotoxin. The efficacy of the 6-OHDA injection was assessed behaviorally using the step test (Olsson et al., 1995). The extent of dopamine cell degeneration was assessed postmortem using immunohistochemistry for TH (see below).
Electrophysiological recordings and drug treatments.
Extracellular spike and LFP recordings were performed before the 6-OHDA injection and 12, 21, and 23–35 d following 6-OHDA injection. Data were collected during epochs of inattentive rest and walking on the rotating circular treadmill at standard speed rotation of nine rotations per minute. On day 21 after 6-OHDA injection, apomorphine (0.05 mg/kg, s.c.) was injected just after baseline epochs of treadmill ipsiversive walking and inattentive rest were recorded. Two epochs of open field activity recorded at least 5 min after apomorphine injection were used for analysis. Twenty to 25 min following this injection of apomorphine, a combination of the D1 antagonist (R(+)-SCH-23390 hydrochloride, 0.3 mg/kg) and the D2 antagonist (S-(−)-eticlopride hydrochloride, 0.2 mg/kg) was injected to reverse the effects of apomorphine. As this combination of D1 and D2 antagonists induced catalepsy, the rat was manually moved in the cylinder to induce an aroused state. Support for the use of this method was tested in the 6-OHDA-lesioned rat treated with the DA antagonists to show that investigator-assisted “movement” did induce an increase in power in the beta range in the dopamine-lesioned hemisphere similar to the increase observed in the same rats in the absence of dopamine antagonist-induced catalepsy. Starting on days 23–25 after 6-OHDA injection, rats were injected daily for 7 d with l-DOPA (12 mg/kg + benserazide, 15 mg/kg, s.c.). Following this l-DOPA priming, rats received a final dose of l-DOPA, and during peak dyskinesia (t = 85 min after l-DOPA injection), they received the serotonin 5-HT1A agonist (8-OH-DPAT; 0.2 mg/kg, s.c.), known to reduce dyskinesia (Carta et al., 2007), followed by its reversal agent, the 5-HT1A antagonist WAY100635 (0.3 mg/kg, s.c.).
Extracellular spike trains and LFPs were amplified and filtered using Plexon and Spike2 (Cambridge Electronic Design) systems. Spikes and LFPs from each electrode were referenced to a ninth wire 1 mm scraped in the same bundle. Sampling rates were 40 kHz for spikes and 1 kHz for LFPs (Micro 1401; Cambridge Electronic Design). Action potentials were amplified (10,000×) and bandpass filtered (0.3–8 kHz). LFPs were amplified (1000×) and bandpass filtered (0.7–150 Hz; Plexon). Discriminated spike and LFP signals were digitized, stored, and analyzed using Spike2 data acquisition and analysis software (Cambridge Electronic Design).
Direct observation and videotaped motor behavior were used to identify a 100 s interval within the treadmill walking epochs and 40–100 s inattentive rest epochs. Any epochs showing artifacts were excluded. Furthermore, spindles often contaminated inattentive rest epochs if the animal tended toward sleep. Such inattentive rest epochs were also discarded.
Spectral analysis of LFP recordings.
Before power and coherence analysis, LFP signals were smoothed to 500 Hz. LFP power was measured by FFT with a frequency resolution of 1 Hz. Using a Spike2 script, total power was calculated for each structure in two different frequency ranges: 29–36 Hz (high beta) and 45–55 Hz (low gamma). After apomorphine or l-DOPA injections, a third frequency range was also analyzed: 80–120 Hz (high gamma). LFP power from two electrodes per bundle during two epochs for each behavioral condition was averaged. Data are reported as mean ± SEM. FFT-based spectral coherence was calculated for each pair of electrodes (MCx-mPFC, STN-MCx, and STN-mPFC) using a Spike2 script.
The following criteria were applied to identify significant peaks in power or coherence spectra: (1) a relative maximum must be greater than the surrounding 8 frequency bins in the high beta range (29–36 Hz), 12 frequency bins in the low gamma range (45–55 Hz), and 16 bins in the high gamma range (80–120 Hz); (2) the first derivative of the spectrum must be positive to the left of the peak and negative to the right of the peak; and (3) the second derivative at the peak must be negative, indicating a downward concavity. A relative maximum that met all three criteria was said to be a significant spectral peak, and the frequency at which that peak occurred was said to be the peak frequency in that frequency range (Brazhnik et al., 2012).
The following formula, where L is the length of the window, was used to construct a lower limit line of coherence significance for analysis of coherence spectra (Rosenberg et al., 1989):
To visualize spectral power changes over time for the selected epochs, time-frequency wavelet spectra were constructed using continuous wavelet transforms. The Morlet wavelet was applied to the LFPs using 128 frequency scales and a time resolution of ∼750 ms (Time-Frequency Toolbox; http://tftb.nongnu.org).
Time-frequency coherence for each pair of electrodes (MCx-mPFC, STN-MCx, and STN-mPFC) was calculated using FFT-based coherence over a 10 s (s) sliding window (Chronux: http://chronux.org). The multitaper coherence analysis introduced a bias determined by the following formula:
 |
B is the bias introduced by the analysis and ν represents the degrees of freedom, equivalent in this case to the number of tapers used. This multitaper calculation used 19 tapers, resulting in a bias of ∼0.23. To compensate for this, the smallest coherence values in the plot were adjusted to 0.23 and the largest to 1.23, rather than 0 and 1, respectively (Mitra and Bokil, 2007).
Changes in coherence and power between control and lesion rats over specific frequency ranges were assessed within inattentive rest and treadmill walking using one-way ANOVA followed by Fisher LSD post hoc comparisons with the level of significance α = 0.05. In the experiments with drug treatments, spectral power and coherence were calculated before and after drug treatments while the rat was walking on the circular treadmill. The alterations in total LFP spectral power and coherence were assessed using a one-way ANOVA followed by Student-Newman–Keuls post hoc test comparisons with the level of significance α = 0.05.
Video scoring analysis.
A web camera (Logitech) was mounted next to the treadmill to provide behavioral data synchronized with the electrophysiological recordings. A Spike2 script was used to record the moment when the front paw contralateral to the implanted hemisphere touched the floor. To synchronize paw movements and electrophysiological recordings, LFPs were smoothed to 500 Hz, and then bandpass filtered to either 29–36 Hz or 45–55 Hz and rectified.
For a given step sequence, step-triggered waveform averages (step-TWAs) were calculated during treadmill walking epochs before and 21 d after dopamine depletion. In addition to step-TWAs generated from the original step data, shuffled step-TWAs were generated by randomly shuffling the original interstep intervals and calculating another waveform average with the random step train. This was repeated 50 times and the resulting step-TWAs were used to obtain a set of 50 peak-to-trough values that were averaged for comparison to the unshuffled waveform. Stepping movements were considered to be significantly correlated with the LFP oscillations when the peak-to-trough amplitude of the unshuffled step train STWA was greater than the mean + 3 SDs of the mean of the shuffled distribution. Comparison of mean step-TWA ratios between control and lesion conditions was done using a Mann–Whitney t test. Comparison of the percentage of correlated events between control and lesion condition was done using the χ2 test. In both cases, the level of significance was set at p < 0.05.
Cell sorting and spike-triggered waveform analysis.
Spike waveforms from the STN were sorted using principal component analysis in Spike2 software. The trigger level was calculated as three to five times the root mean square of the whole signal. To assess effective sorting for single cells, interspike interval (ISI) histograms were generated and inspected to ensure that sorted cell clusters did not exhibit multi-unit behavior by firing within the assumed refractory period (1 ms). To determine changes in firing rate between walk and rest, rates were averaged over two epochs for each behavior for a given spike train. A change of >20% was considered a significant increase or decrease of firing rate.
To assess the temporal relationship between the spiking activity of individual neurons and LFPs from the same structure or from others, spike-triggered waveform averages (STWAs) were calculated from recordings obtained during treadmill walking. LFPs were bandpass filtered to the desired frequency range (29–36 Hz or 45–55 Hz). Peak-to-trough amplitudes of the STWAs at or around the spike (zero time) were obtained as a measure of phase locking between spike train and dominant LFP oscillation. As in step-TWA analysis (see above), 10 shuffled STWAs from the same epochs were created by shuffling the ISIs of each spike train and used to create 10 normally distributed peak-to-trough values. Spike trains were considered to be significantly correlated with LFP oscillations when the peak-to-trough amplitude of the unshuffled spike train STWA exceeded the mean shuffled peak-to-trough amplitude by 3 SDs.
The extent of phase locking between spikes and LFPs in lesioned and control rats was assessed using both the percentage of spike trains significantly correlated to LFP and the mean ratio of unshuffled/shuffled peak-to-trough amplitudes. Comparisons of STWA ratio between control and lesion rats were assessed using one-way ANOVA followed by Student-Newman–Keuls post hoc test comparisons with the level of significance α = 0.05. Comparisons of the percentage of correlated neurons were conducted using a χ2 test at α = 0.05.
Histology and immunochemistry.
After recordings were completed, rats were deeply anesthetized with urethane (1.6 g/kg, i.p.), and recording sites were marked by passing a 10 μA positive current for 10 s via three microwires and the reference electrode. Rats were perfused intracardially with 200 ml cold saline followed by 200 ml 4% paraformaldehyde in PBS. Brains were postfixed in paraformaldehyde solution overnight and then immersed in 10% sucrose in PBS (0.1 m, pH 7.4). Coronal sections of 35 μm were collected in PBS. Sections for electrode placement verification were mounted on glass slides and stained with cresyl violet and 5% potassium ferricyanide-9% HCl to reveal the iron deposited at the electrode tips.
To assess the loss of dopaminergic neurons in the substantia nigra pars reticulata (SNpr) and VTA, a standard immunohistochemical protocol was used for staining TH in freely floating sections (Avila et al., 2010). Brain sections were washed three times in PBS (0.01 m, pH 7.4) before incubation with rabbit polyclonal anti-TH antibody (1:200 dilution; Pel-Freez Biologicals) for 12–18 h at room temperature, with moderate agitation. Sections were rinsed three times in PBS and incubated with secondary antibody biotinylated anti-rabbit IgG (1: 200 dilution; Vector Laboratories). After 1 h of incubation, sections were rinsed three times in PBS and incubated with avidin-biotin-peroxidase complex (ABC kit; Vector Laboratories) for 60 min, then rinsed in 50 mm Tris, pH 7.4, and reacted with 0.05% 3,3′-diaminobenzidine tetrahydrochloride and 0.01% H2O2 (DAB kit; Vector Laboratories) for 2–10 min, until intense staining emerged. Sections were washed in 50 mm Tris then mounted on slides, dehydrated, and prepared for light microscopy. The extent of dopamine cell degeneration was assessed by examination and digitization of the image under the light microscope obtained with wide-field optics, allowing simultaneous capture of both lesioned and nonlesioned hemispheres. The optical density values of TH fibers and neurons in the SN and the VTA were measured (using ImageJ software, NIH) in anterior, middle, and posterior sections of the SN in the lesioned hemisphere and compared with density in homologous regions in the nonlesioned hemisphere. Selection criteria were determined with a TH density in SN from the lesioned hemisphere <95% of that in the nonlesioned hemisphere. Average of TH staining depletion in the lesioned side compared with the unlesioned side was 99.4 ± 0.2% in the SN and 80.3 ± 3.7% in the VTA.
Results
LFP activity recorded from STN in dopamine-depleted hemisphere shares features with LFP activity in MCx and mPFC
Simultaneous spike and LFP recordings were performed in the STN, MCx, and mPFC to examine relationships between synchronized activity in these nuclei before and after unilateral dopamine cell lesion (Fig. 1J–L). Data were obtained during two behavioral states: inattentive rest and walking on a circular treadmill in a direction ipsilateral to the lesioned hemisphere. In control rats, wavelet-based scalograms of LFP recordings from all three nuclei showed significant spectral peaks in the low gamma range during treadmill walking that were not present during inattentive rest epochs (Fig. 1A–C, M,N). The total LFP power in the low gamma 45–55 Hz range in all three areas was significantly greater during treadmill walking than during inattentive rest (MCx: p < 0.001; mPFC and STN: p < 0.01; Fig. 1G–I). However, the peak frequencies of the low gamma activity differed in the two cortical regions. In accordance with previous observations (Brazhnik et al., 2012), LFPs recorded from the MCx of control rats (n = 8) showed a broad and modest, but significant spectral peak (see Materials and Methods) with a mean peak frequency of 46.5 ± 1.5 Hz during treadmill walking (Fig. 1A,D). A more distinct spectral peak was evident in LFP recordings from both STN (Fig. 1B,E) and mPFC (Fig. 1C,F) during treadmill walking, with a higher mean peak frequency of 51.5 ± 0.8 Hz (n = 8) in the mPFC and 51.8 ± 0.9 Hz in the STN (n = 9). Thus, in control rats, the frequencies of the spectral peaks in the low gamma range in mPFC and STN LFP during treadmill walking were not significantly different from each other (p > 0.05) and were significantly higher than the peak frequency in the MCx during the same epochs (p < 0.01).
Figure 1.
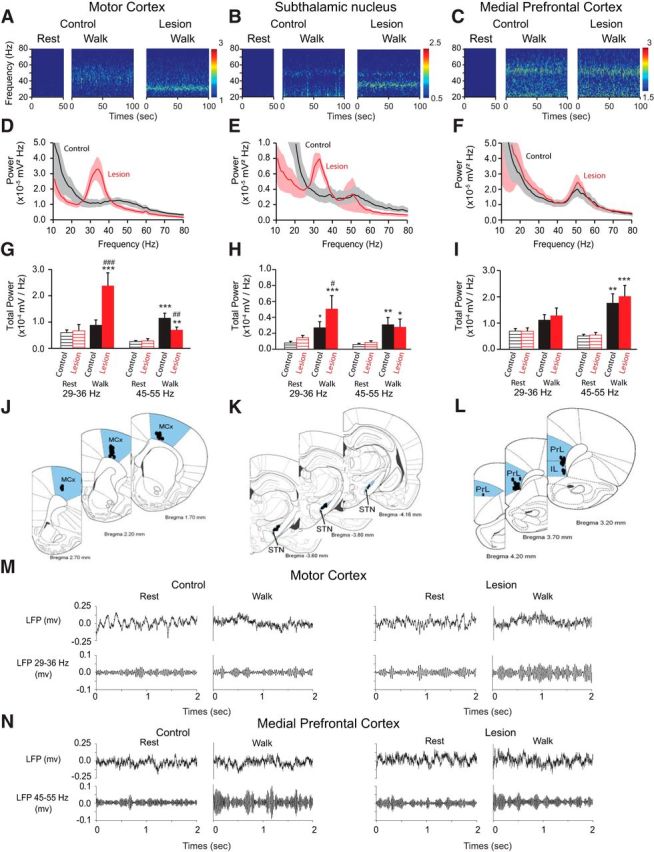
Effect of dopamine cell lesion on power of the MCx, STN, and mPFC during rest and treadmill walking. A–C, Representative wavelet-based scalograms represent the time-frequency plots of LFP spectral power in the MCx (A), STN (B), and mPFC (C) during inattentive rest and treadmill walking before (Control) and 21 d after dopamine cell lesion (Lesion). Spectral power was plotted on a logarithmic scale with greater power represented by red colors. D–F, Linear graphs show averaged LFP power spectra (10–80 Hz) for walking epochs from control rats (black, n = 8–9 rats) and lesioned rats at day 21 post lesion (red, n = 9–11 rats). G–I, Bar graphs represent mean total LFP power during inattentive rest (stripes) and treadmill walking (solid) in intact (black) and lesioned rats (red) within two frequency ranges: high beta (29–36 Hz) and low gamma (45–55 Hz). J–L, Atlas pictures showing electrode localization in the MCx (J), STN (K), and mPFC (L); prelimbic cortex (PrL) and infralimbic cortex (IL) are the main structures of the mPFC. M, N, Examples of raw LFP signal (top; 0.7–150 Hz; see Materials and Methods) recorded from the same wire before and 21 d after dopamine depletion during rest and treadmill walking. Bottom, Shows the same LFP signal bandpass filtered between 29 and 36 Hz for MCx (M) and between 45 and 55 Hz for mPFC (N). Values are reported as mean ± SEM; *p < 0.05, **p < 0.01, ***p < 0.001, significant difference between rest and walk in control or lesion rats; #p < 0.05, ##p < 0.01, ###p < 0.001 significant difference between control and lesion rats, one-way ANOVA followed by a fisher LSD test.
After dopamine cell lesion, a new and prominent spectral peak was evident in the STN in the high beta 29–36 Hz range during treadmill walking, which was not present during inattentive rest epochs (Fig. 1B,E,H). At 3 weeks post lesion, the mean peak frequency of this high beta band in the STN was 32.9 ± 1.0 Hz during treadmill walking (p < 0.001; Fig. 1B,E,H), and STN LFP power in the 29–36 Hz range was significantly increased in the dopamine-lesioned hemisphere relative to controls (Fig. 1H). Simultaneous recordings from the MCx in the lesioned hemisphere also showed a dramatic increase in the high beta 29–36 Hz activity with a mean peak frequency of 32.8 ± 0.5 Hz during treadmill walking, which was not present during inattentive rest epochs (p < 0.001; Fig. 1A,D,G). These observations are consistent with previous results showing increases in the same frequency range from simultaneous LFP recordings in the MCx and SNpr in hemiparkinsonian rats during treadmill walking (Brazhnik et al., 2012). Importantly, increases in high beta power were not present in power spectra from LFPs recorded in the mPFC (Fig. 1C,F,I).
In contrast to the emergence of high beta power following dopamine cell lesion, 51 Hz low gamma power was temporarily reduced after dopamine cell lesion in the mPFC and STN (mPFC: p < 0.05, STN: p < 0.01; Fig. 2). However, by 3 weeks post lesion during treadmill walking, this low gamma activity had recovered in both STN (n = 8) and mPFC (n = 9; p < 0.001; Fig. 1H,I) and was not significantly different from that seen in the STN and mPFC in control rats during treadmill walking (p > 0.05; Fig. 1H,I). This temporary decrease and subsequent recovery suggests a dopaminergic modulation of this low gamma power and the presence of a compensatory mechanism facilitating its recovery (Lew and Tseng, 2014). This 51 Hz low gamma peak was not evident in the MCx before or after dopamine cell lesion (Fig. 1A,D). Moreover, the modest 45 Hz LFP peak seen in the MCx in the control state was consistently reduced following dopamine cell lesion, and remained significantly diminished at 3 weeks post lesion (p < 0.01; Fig. 1A,D,G).
Figure 2.
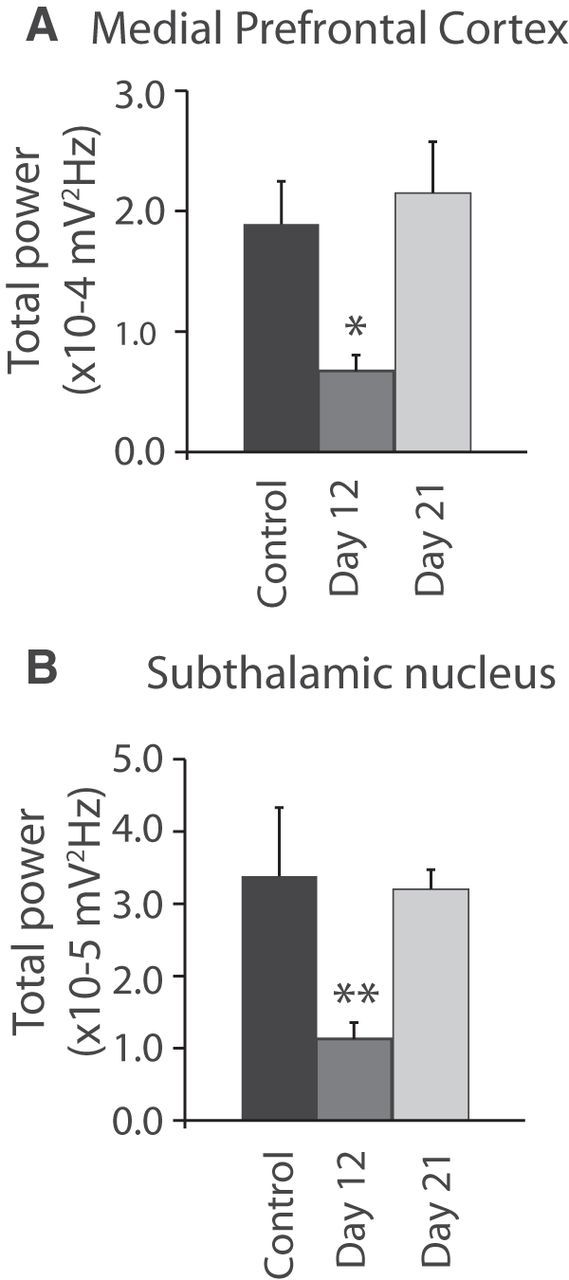
Time course of STN and mPFC LFP power in the low gamma frequency range (45–55 Hz). Bar graphs represent the mean total LFP power within the 45–55 Hz frequency range in the mPFC (A; n = 7–8 rats) and the STN (B; n = 8–9 rats) during treadmill walking before lesion (black) and 12 d (gray) and 21 d (light gray) after 6-OHDA injection. Values are reported as mean ± SEM, **p < 0.01, one-way ANOVA followed by a fisher LSD test.
Thus, in the MCx, dopamine cell lesion was associated with the introduction of high beta power during treadmill walking and a reduction in the 46 Hz low gamma power. In contrast, in the mPFC, dopamine depletion was not associated with an increase of the high beta power during treadmill walking but with a temporary decrease and subsequent restoration of 51 Hz low gamma power at 3 weeks post lesion, to a level comparable to control. In the STN, three weeks after dopamine cell lesion, both effects were observed: an increase of the high beta range synchrony during treadmill walking activity and LFP activity in the 51 Hz low gamma power comparable to control.
STN LFP activity is coherent with high beta in MCx and low gamma activity in mPFC
To gain further insight into the relationships between oscillatory LFP activity in the MCx, mPFC, and STN, LFP spectral coherence was measured in the high beta and low gamma ranges between these regions during inattentive rest and walk epochs in control rats and in lesioned rats three weeks after dopamine depletion. In control rats, the increases in oscillatory activity in the low gamma range in the STN and mPFC during treadmill walking were consistently associated with increases in STN-mPFC LFP coherence in the same frequency range (Fig. 3B,E,H). As shown in the representative wavelet-based spectrogram (Fig. 3B), this increase in coherence had a mean peak of 51.5 ± 1.1 Hz (n = 7, p < 0.01; Fig. 3B,E). In contrast, LFP activity in the low gamma range in the MCx was neither coherent with STN LFP activity (n = 7, p > 0.05; Fig. 3A,D,G) nor with mPFC LFP activity (n = 8, p > 0.05; Fig. 3C,F,I) during walking or inattentive rest epochs.
Figure 3.

Effect of dopamine cell lesion on coherence between MCx, STN, and mPFC LFP activity during rest and treadmill walking. A–C, Representative FFT-based spectrograms show coherence between STN and MCx (A), STN and mPFC (B), and between MCx and mPFC (C) during treadmill walking in control rats and 21 d after dopamine cell lesion. D–F, Line graphs show averaged coherence spectra (10–80 Hz) during treadmill walking from control rats (black; n = 7–8 rats) and lesioned rats at day 21 post lesion (red; n = 7–8 rats). G–I, Bar graphs represent mean average LFP coherence between MCx and STN (G), STN and mPFC (H), and between MCx and mPFC (I) during inattentive rest (stripes) and treadmill walking (solid) in intact (black) and 21 d after dopamine cell lesion (red) within two frequency ranges: high beta (29–36 Hz) and low gamma (45–55 Hz). Values are reported as mean ± SEM; *p < 0.05, ***p < 0.001, significant difference between rest and walk in control or lesion rats; ###p < 0.001 significant difference between control and lesion rats, one-way ANOVA followed by a fisher LSD test.
Interestingly, three weeks after 6-OHDA injection, increases in STN-mPFC coherence during treadmill walking were similar to those observed in the control state and consistent with the increases in STN and mPFC LFP power in the low gamma range during treadmill walking, as shown in the representative wavelet-based spectrogram (Fig. 3B). The mean peak frequency of low gamma coherence was 51.7 ± 1.2 Hz (n = 8, p < 0.01). Moreover, in parallel with the increases in power in the high beta range in MCx and STN LFP, a dramatic increase in the STN-MCx coherence was also observed with a mean peak frequency of 32.9 ± 0.9 Hz (n = 7, p < 0.001; Fig. 3A,D,G). Furthermore, after dopamine depletion, as in controls, there was no significant coherence between MCx and mPFC LFP activity during walk and inattentive rest epochs (n = 8; p > 0.05; Fig. 3C,F,I). These observations show that STN activity is coherent with both mPFC in the low gamma range and with MCx in the high beta range during treadmill walking after dopamine cell lesion. The lack of coherence between the two cortical areas in either frequency range supports the view that different networks are involved in mediating the relationships between the STN and the mPFC, on the one hand, and STN and MCx on the other.
Relationship between motor behavior and STN LFPs
The increases in STN LFP power in both the high beta and low gamma ranges were clearly evident in epochs of ipsiversive walking on the circular treadmill and absent in inattentive rest epochs (Fig. 1). To gain further insight into the relationships between power in these bands and motor activity on shorter timescales, the amplitude of the rectified LFP signal was closely examined in conjunction with the repetitive, ∼1.5 s cycle of stepping activity of the front paw contralateral to the dopamine cell lesion during treadmill walking. STN LFPs were rectified and bandpass filtered to either 29–36 Hz or 45–55 Hz. The planting of the front contralateral paw at the end of a step was used as an event to produce a step-triggered waveform average of the change in STN LFP amplitude around the step (step-TWA; see Materials and Methods).
In control rats, no significant amplitude modulation was seen in the high beta range-filtered STN LFP during the cycle of treadmill stepping. Only 1 of 28 walking epochs showed significant modulation of the 29–36 Hz filtered STN LFP with a mean ratio of unshuffled:shuffled step-TWA peak-to-trough amplitude of 0.77 ± 0.06. However, after dopamine depletion there was a significant increase in contralateral step-triggered amplitude modulation of beta range-filtered STN LFP activity (Fig. 4A,C–E), with 40% of the stepping epochs showing significant amplitude modulation (11 of 28, p < 0.01, χ2 test; Fig. 4D) and a mean ratio of unshuffled:shuffled step-TWA peak-to-trough amplitude of 1.42 ± 0.10 mV (p < 0.001, Mann–Whitney U test; Fig. 4E).
Figure 4.

Event-related desynchronization between contralateral paw movement and STN LFP filtered between 29 and 36 Hz, but not between the 45 and 55 Hz frequency ranges. A, B, Step-TWA in control (full line) and 21 d after dopamine cell lesion (dashed line). The step event corresponds to the moment when the contralateral front paw touches the floor. STN LFPs are either filtered between 29 and 36 Hz (A) or between 45 and 55 Hz (B). C, Examples of filtered STN LFPs between 29 and 36 Hz frequency range in control (black) and 21 d after dopamine depletion (gray). Vertical dashed line represents the planting of the contralateral front paw. D, Percentage of significant step trains correlated to the STN LFPs filtered between 29 and 36 Hz frequency range in control (black; n = 16 step trains from 8 rats) and lesion (gray; n = 16 step trains from 8 rats). E, Average of ratios between unshuffled and shuffled peak-to-trough step-TWA filtered between 29 and 36 Hz frequency range in control (black) and lesion (gray). A ratio of 1 (horizontal line) indicates no difference between shuffled and unshuffled values. Values are reported as mean ± SEM, **p < 0.01, ***p < 0.001, t test.
Unlike high beta range activity, low gamma range STN and mPFC LFP activity did not show amplitude modulation in conjunction with the stepping cycle in control or dopamine-cell lesion animals (Fig. 4B). Indeed, for example, in STN, only 1 of 34 stepping epochs was significantly correlated with the amplitude of its respective LFP bandpass filtered at 45–55 Hz in control and 2 of 34 after dopamine depletion (data not shown). These results indicate that despite the fact that the low gamma activity was evident during walk in both STN and mPFC and was not present during rest, there is no direct relationship between elevated low gamma range synchrony and the motoric aspect of the stepping process. This is consistent with the idea that having to continually walk on the treadmill to avoid contact with a stationary paddle (Avila et al., 2010) involves, in addition to motor activity, cognitive processes such as attention, both thought to be associated with low gamma oscillatory activity in the mPFC.
Effect of acute apomorphine and acute and chronic l-DOPA treatments on MCx, STN, and mPFC LFP power and coherence
To explore the relative effects of dopamine receptor stimulation on changes in LFP activity in the STN, mPFC, and MCx after dopamine cell lesion, hemiparkinsonian rats were administered an acute injection of apomorphine (0.5 mg/kg, i.p.) 21 d after dopamine cell lesion. Significant decreases in the prominent spectral peaks in high beta power were observed in the MCx (p < 0.05; Fig. 5A–C) and the STN (p < 0.05; Fig. 5G–I) 2–5 min after apomorphine injection as rats became more active and explored their environment. Interestingly, power in the low gamma frequency range in both the mPFC and the STN was also reduced after apomorphine injection (p < 0.05; Fig. 5D–I) relative to levels seen during treadmill walking.
Figure 5.
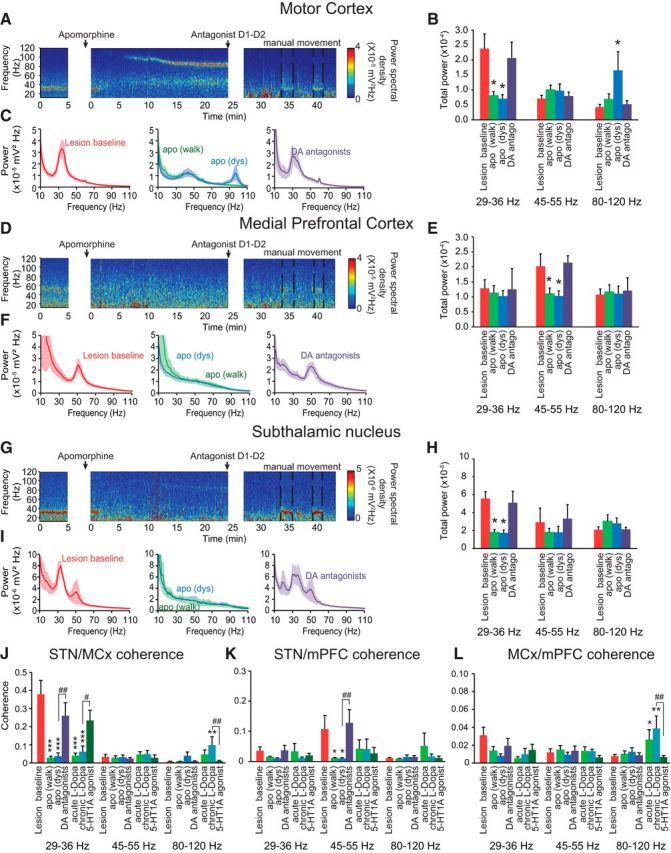
Effects of acute injection of the dopamine agonist apomorphine (0.5 mg/kg) and acute and chronic l-DOPA (12 mg/kg) treatment on MCx, mPFC, and STN power and coherence after dopamine depletion. A, D, G, Representative FFT-based scalograms represent the time-frequency plots of LFP spectral power in the MCx (A–C), mPFC (D–F), and STN (G–I) 21 d after dopamine depletion before any treatment (left); after apomorphine injection (middle); and after a mix of D1 and D2 receptor antagonist (SCH-23390, 0.3 mg/kg, and eticlopride, 0.2 mg/kg) injection (right). D1 and D2 antagonists were injected 25 min after apomorphine to reverse its effect. Since these antagonists induced catalepsy, rats were manually moved to induce the urge to walk (dashed lines). Spectral power was plotted on a logarithmic scale with greater power represented by red colors. C, F, I, Linear graphs show averaged LFP power spectra (10–110 Hz) in the MCx (C; n = 6–9 rats), mPFC (F; n = 6–9 rats), and STN (I; n = 7–9 rats) 21 d after dopamine depletion before treatments (left, red), after apomorphine injection [middle, green, during walking <10 min after injection, and blue, during dyskinesia (dys), 10–25 min after injection] and after SCH-23390/eticlopride injections during manual movement epochs (right, purple). B, E, H, Bar graphs represent mean total LFP power in the MCx (B; n = 6–9 rats), mPFC (E; n = 6–9 rats), and STN (H; n = 7–9 rats) within three frequency ranges: high beta (29–36 Hz), low gamma (45–55 Hz), and high gamma (80–120 Hz). Recordings were done 21 d after dopamine depletion before any treatment (red), after apomorphine injection, <10 min after injection (green), and >10 min after injection when rats presented a dyskinetic behavior (blue) and after SCH-23390/eticlopride injections during manual movement (right, purple). J, K, L, Bar graphs represent mean total LFP coherence between STN and MCx (J; n = 6–9 rats), STN and mPFC (K; n = 6–9 rats), and MCx and mPFC (L; n = 6–9 rats); after dopamine depletion before treatments (red); after apomorphine injection (dark blue); after SCH-23390/eticlopride injections during manual movement epochs (purple); after acute l-DOPA injection (light green); after 7 d of chronic l-DOPA treatment (light blue); and after 5-HT1A injection (8-OH-DPAT), given 85 min following the last l-DOPA injection. These coherences were analyzed within three frequency ranges: high beta (29–36 Hz), low gamma (45–55 Hz), and high gamma (80–120 Hz). Values are reported as mean ± SEM, *p < 0.05, **p < 0.01, ***p < 0.001 significant difference from lesion baseline; #p < 0.05, ##p < 0.01, significant difference from previous treatment, one-way ANOVA followed by a Fisher LSD test.
In the MCx, a striking band of high gamma oscillatory activity in a significantly higher range (80–120 Hz) appeared between 5 and 10 min after apomorphine injection (p < 0.05; Fig. 5A–C) parallel to the emergence of dyskinetic behavior (data not shown). Power in the 80–120 Hz range in STN showed a significant peak (82 Hz; see Materials and Methods) after apomorphine treatment, which was not present before treatment; however, total power over the 80–120 Hz range was not significantly increased (p > 0.05, one-way ANOVA; Fig. 5G–I). These increases in high gamma range power were significantly reversed by the injection of a mix of D1 and D2 antagonists (Fig. 5).
Treatment with l-DOPA, whether administered acutely or chronically, induced effects similar to those induced by apomorphine treatment; LFP power in the high beta and low gamma ranges was reduced and LFP power in the high gamma range (peak frequency: ∼97 Hz) was increased. Indeed, the apomorphine and l-DOPA-induced decreases in MCx and STN LFP high beta power concomitant with the increases in high gamma power (FTG) were associated with a marked decrease in STN-MCx high beta coherence (p < 0.001; Fig. 5J). Furthermore, the decreases in mPFC and STN low gamma power (51 Hz) after apomorphine injection were also associated with a significant decrease in STN-mPFC low gamma coherence (p < 0.05; Fig. 5K). These changes in high beta and low gamma coherence levels induced by apomorphine or l-DOPA injections were reversed by injection of a mix of D1 and D2 antagonists (Fig. 5J,K) or by the 5-HT1A agonist 8-OH-DPAT (Fig. 5J,K). Acute injection of apomorphine as well as acute and chronic treatment of l-DOPA did not significantly change the coherence between MCx and mPFC in high beta and low gamma frequency ranges (p > 0.05, one-way ANOVA; Fig. 5L). The observations of increased high gamma activity are consistent with previous reports of higher bands of gamma activity in the MCx of hemiparkinsonian rats in conjunction with l-DOPA-induced dyskinesia (Halje et al., 2012) and in STN in PD patients during movement after l-DOPA treatment referred to as finely-tuned gamma (FTG; Brown et al., 2001; Jenkinson et al., 2013).
Interestingly, although apomorphine treatment did not significantly modify the coherence in the high gamma 80–120 Hz frequency range between any of the structures, chronic l-DOPA treatment significantly increased STN-MCx and MCx-mPFC coherence in the 80–120 Hz frequency range (p < 0.05; Fig. 5J). As previously shown (Brazhnik et al., 2012; Delaville et al., 2014), these l-DOPA-induced changes in coherence were significantly reversed by the 5-HT1A agonist (Fig. 5J,L), and restored by injection of WAY100635, a 5-HT1A antagonist (data not shown). Thus, high gamma activity seems to be more synchronized in a broad area of cortex after chronic l-DOPA treatment compared with acute dopamine treatment, implying a long-term plasticity induced by daily injection of l-DOPA.
STN spike–LFP relationships
To further investigate the functional significance of the changes in LFP synchronization associated with dopamine cell lesion and treadmill walking, spike trains recorded from the STN in control rats and 3 weeks after dopamine cell lesion were examined for changes in firing rate and phase locking to the dominant LFP rhythms. Spike trains were also examined following drug treatments. The average firing rate of STN neurons did not significantly differ in control rats relative to lesioned animals during treadmill walking (10.37 ± 1.5 vs 10.1 ± 1.2 Hz, respectively, p > 0.05, Student's t test; Fig. 6A) or during inattentive rest (10.12 ± 2.3 vs 10.1 ± 2.3 Hz, respectively, p > 0.05, Student's t test; Fig. 6A). Additionally, the average firing rate did not differ between inattentive rest and walking in either the control or lesion groups (p > 0.05, Student's t test; Fig. 6A). However, consideration of individual spike trains revealed that STN cells exhibited changes in rate not evident when the average rates were considered. Indeed, in control rats during walking, 43% of all cells exhibited a significant increase in rate, 36% showed a decrease, and 21% showed no change, with respect to inattentive rest. Similarly, in lesioned rats during walking, 58% of the cells showed a significant increase in rate, 29% showed a decrease, and 13% of the cells did not differ, with respect to inattentive rest (p > 0.05 compared with control animals, χ2 test; Fig. 6B). Therefore, in dopamine cell-lesioned hemisphere, a greater proportion of STN neurons showed a significant increase in firing rate during walking, relative to the control state (p < 0.01, χ2 test; Fig. 6B).
Figure 6.

Effect of dopamine cell lesion on STN firing rate and spike-LFP phase locking with STN LFP, MCx LFP, and mPFC LFP filtered in the high beta 29–36 Hz and the low gamma 45–55 Hz frequency ranges during rest and treadmill walking. A, Firing rate of STN in control (black; n = 28 cells from 8 rats) and 21 d after dopamine depletion (gray; n = 32 cells from 9 rats) during rest (stripes) and treadmill walking (full). B, Percentage of STN cells showing an increase of rate during walk compared with rest (black; control: n = 12 cells; lesion: n = 19), a decrease (gray; control: n = 10 cells; lesion: n = 9), or no change (white; control: n = 6 cells; lesion: n = 4) in control and 21 d after dopamine depletion. C, Phase plots showing the distributions of phase relationships between STN spikes and STN LFPs filtered between 29 and 36 Hz for spike trains showing significant phase locking to local LFP in control (n = 13 spike trains from 8 rats) and lesion (n = 33 spike trains from 9 rats). Spikes were significantly oriented to high beta STN LFP oscillations; Rayleigh test: p < 0.05. Arrows reflect a measure of the strength of concentration of the distribution of the mean phase values, normalized to the radius of the circular plot. D–F, Top, Percentage of significantly correlated subthalamic spike trains to subthalamic LFPs (D), to MCx LFPs (E), and to mPFC LFPs (F) within two frequency ranges: high beta (29–36 Hz) and low gamma (45–55 Hz). Bottom, Mean ratios of peak-to-trough amplitude of unshuffled/shuffle STWA of subthalamic spike trains to subthalamic LFPs (D), to MCx LFPs (E), and to mPFC LFPs (F) within two frequency ranges: high beta (29–36 Hz) and low gamma (45–55 Hz). Two walk epochs were analyzed in control (n = 50 spike trains, n = 8 rats), lesion (n = 68 spikes trains, n = 9 rats), and after apomorphine injection before dyskinesia (n = 64 spike trains, n = 8 rats), and only the epochs corresponding to 60 min after l-DOPA injection, during dyskinesia, were analyzed (n = 29 spike trains from 5 rats). Values are reported as percentage or mean ± SEM, **p < 0.01, ***p < 0.001, significant difference from control animals, ##p < 0.01, ###p < 0.001, significant difference with lesion animals 21 d after dopamine depletion before treatments; one-way ANOVA followed by a Fisher test.
The degree of phase locking between STN spikes and simultaneously recorded 29–36 Hz high beta LFP oscillations in the STN was examined. In control rats during walk, 26% of the STN spike trains were significantly phase locked to high beta STN LFPs (13/50 cells; Fig. 6D) with a mean ratio of unshuffled-to-shuffled STWA peak-to-trough amplitude of 1.78 ± 0.18. After 6-OHDA injection, the degree of STN spike-high beta LFP phase locking during walking dramatically increased; 48.5% of spike trains were significantly correlated (33/68, p < 0.01, relative to control, χ2 test; Fig. 6D) with a mean STWA shuffled/unshuffled ratio of 4.3 ± 0.62 (p < 0.001, relative to control; Fig. 6D). Notably, acute apomorphine and chronic l-DOPA treatments each significantly reduced this ratio to levels comparable to control (p < 0.01 after apomorphine and p < 0.001 after l-DOPA compared with after dopamine depletion, p > 0.05 relative to control; Fig. 6D).
In addition, the phase angles between spikes and the high beta range LFP oscillations were examined for the phase-locked spike trains. In control as well as lesioned animals, spikes in the majority of STN spike trains were significantly oriented with their own LFPs, filtered between 29 and 36 Hz, with a preferred angle between 70 and 105 degrees (p < 0.01 and p < 0.05, respectively, Rayleigh test; Fig. 6C). This corresponds to the descending segment of the high beta-filtered STN LFP oscillation (reflecting the trend toward increasing intraneuronal depolarization). These distributions were not significantly different between control and lesion (p > 0.05, Mardia–Watson–Wheeler test).
We also analyzed the extent to which STN spiking activity was phase locked to high beta LFP activity in the MCx and mPFC. In control, only 2% of STN cells were significantly correlated to 29–36 Hz MCx LFPs (1/50 cells; Fig. 6E) with a mean ratio of unshuffled-to-shuffled STWA peak-to-trough amplitude of 1.1 ± 0.05. However, after dopamine depletion, we observed a dramatic increase in the percentage of correlated cells (36% in lesion vs 2% in control, p < 0.001, χ2 test) as well as in the mean ratio of unshuffled-to-shuffled STWA peak-to-trough amplitude (3.3 ± 0.35 in lesion vs 1.1 ± 0.05 in control, p < 0.001; Fig. 6E). Similar to the effects of apomorphine and l-DOPA on STN spike to STN LFP phase locking, injections of these agents significantly reduced both the percentage of STN cells phase locked to MCx LFPs in the high beta range and the mean ratio of unshuffled-to-shuffled STWA peak-to-trough amplitudes to control levels (p < 0.01 after apomorphine and p < 0.001 after l-DOPA vs dopamine lesion; p > 0.05 vs control; Fig. 6E).
Furthermore, as expected due to the lack of prominent high beta power in the mPFC, STN spike trains were not significantly correlated with mPFC LFPs filtered in the high beta range. Indeed, the mean ratio of unshuffled-to-shuffled STWA peak-to-trough amplitudes is 1.2 ± 0.05 (p > 0.05, one-way ANOVA; Fig. 6F) with only 4% of the STN cells significantly correlated to the mPFC LFPs in control (p > 0.05, χ2; Fig. 6F). In lesioned animals, only 13% of the STN cells were significantly correlated to the high beta mPFC LFPs with a mean ratio of 1.4 ± 0.06 (p > 0.05, χ2 and one-way ANOVA, respectively; Fig. 6F). These data are consistent with an influence of the robust synchronized high beta activity from the MCx on the STN via the hyperdirect pathway.
In the low gamma (45–55 Hz) frequency range, phase locking of STN spikes to their own LFPs was evident in both control and lesioned rats in 40 and 30% of the neurons recorded, respectively. Phase locking was similar 21 d post lesion compared with control (p > 0.05; Fig. 6D). However, STN spike trains were not significantly correlated to 45–55 Hz MCx LFPs in either control or dopamine cell-lesioned rats (p > 0.05; Fig. 6E). The high degree of phase locking between STN spike trains and high beta MCx LFP in the lesioned rats contrasts with the lack of significant phase locking of STN spike trains to mPFC LFP despite STN-mPFC LFP coherences in the low gamma 45–55 Hz frequency range (p > 0.05; Fig. 6F). This contrast supports the view that LFP power is not necessarily a reliable indication of increases in phase-locked spiking activity. Spiking activity in the STN appears more strongly entrained to the increased oscillatory activity within motor circuits after dopamine cell lesion than to oscillatory activity in mPFC during treadmill walking.
Discussion
The current results show that LFP activity in the rat STN can exhibit significant coherence with distinct activity in both mPFC and MCx during a walking task, and highlight the potential for STN integration of input from both associative/limbic and motor networks, as well as the ability of dopamine to modulate these networks. This evidence was obtained as the rats performed a walking task that required maintenance of a steady pace on a rotating circular treadmill. In the control state, STN exhibited increases in low gamma (45–55 Hz) LFP power that were coherent with similar increases in the mPFC (mean peak: ∼51 Hz) during walking epochs. This coherent activity was reduced at 12 d after dopamine cell lesion, but recovered by 3 weeks post lesion to control levels. In contrast, STN showed increases in LFP power coherent with increases in the MCx in the high beta range (29–36 Hz) during walking, only after lesion, consistent with previous observations in MCx and SNpr (Avila et al., 2010; Brazhnik et al., 2012). The presence of both high beta and low gamma power simultaneously expressed in the STN, but with distinctly different coherence relationships with MCx and mPFC, along with a lack of any significant LFP coherence between the two cortical sites, suggests that the two cortical areas are participating in functionally distinct networks during the walking task, each with a link to the STN.
In addition, after chronic l-DOPA treatment and in parallel with dyskinetic behavior, power in a third frequency range, focused in a high gamma band (mean peak: ∼97 Hz), emerged in MCx in the dopamine cell-lesioned hemisphere. This activity was coherent with STN and mPFC LFP and seems a possible rodent correlate of the FTG evident during movement in the STN of PD patients in the “ON” state associated with l-DOPA treatment (Cassidy et al., 2002; Alegre et al., 2005; Alonso-Frech et al., 2006; Trottenberg et al., 2006; Jenkinson et al., 2013). Collectively, the presence of these three distinct bands in paired recordings from the STN-MCx and/or STN-mPFC in the hemiparkinsonian rat supports the view that frequency may be a useful tool for obtaining insight into the nature of the different networks giving rise to exaggerated oscillatory activity in the STN of PD patients (Fogelson et al., 2006; Oswal et al., 2013; Tan et al., 2013; Brittain and Brown, 2014).
Analysis of movement-related modulation of LFP amplitude provided further indication that functionally different networks are involved in generating the synchronized activity in the high beta and low gamma ranges in the STN. The stepping rhythm of the contralateral paw modulated the amplitude of high beta LFP activity in the STN but not low gamma LFP activity in the STN or mPFC. These results are consistent with movement-related modulation of beta range LFP activity in the STN of PD patients (Cassidy et al., 2002; Priori et al., 2002; Kühn et al., 2004; Kempf et al., 2007; Joundi et al., 2012; Florin et al., 2013) and support the idea that the increase in low gamma in the mPFC and STN is less related to the motor components than to the cognitive requirements of the treadmill walking task (Anzak et al., 2011, 2013). The ongoing need to continue walking to avoid being bumped by a stationary barrier placed across the treadmill track may engage working memory and processes such as attention (Womelsdorf and Fries, 2007; Baunez and Lardeux, 2011; Benchenane et al., 2011; Donnelly et al., 2014).
Dopamine receptor-stimulating agents induced additional changes in mPFC, MCx, and STN LFP activity in the hemiparkinsonian rat that appear relevant to observations in the PD patient. Three weeks post lesion, acute administration of apomorphine and chronic l-DOPA treatment each induced decreases in low gamma activity in mPFC, as well as high beta activity in the MCx. High beta MCx-STN coherence was also decreased by these drugs. These observations are consistent with decreases in STN LFP power and coherence with EEG motor cortex recordings induced by l-DOPA in the beta range observed in PD patients (Cassidy et al., 2002; Williams et al., 2002). They are also consistent with reports of apomorphine-induced reduction in low gamma activity in the mPFC of control rats (Berke, 2009).
The decrease in low gamma power during walking associated with administration of dopaminergic agents in the hemiparkinsonian rat may also have been related to the emergence of the high gamma LFP power band in the MCx in association with l-DOPA-induced dyskinesia as hypothesized by others (Berke, 2009; van der Meer and Redish, 2009; van der Meer et al., 2010). Significant peaks in this high gamma range and significant high gamma coherence between MCx and both STN and mPFC were evident after chronic l-DOPA treatment. Thus, the high gamma activity associated with chronic l-DOPA treatment appears synchronized over a broader area of cortex than the high beta activity prominent in the basal ganglia after dopamine depletion and the low gamma activity evident in the mPFC during walking. While there are reports of high gamma activity (FTG-like) in non-PD patients (Brücke et al., 2008, 2013; Kempf et al., 2009), this activity is clearly evident in the PD patients “on” medication, a state in which it may be enhanced by compensatory changes in the striatum induced by loss of dopamine (Jenkinson et al., 2013). It is tempting to speculate that l-DOPA-induced increases in striatonigral “direct” pathway activity might lead to a reduction in the SNpr activity and disinhibition of the thalamocortical input, facilitating expression of FTG in the MCx in conjunction with dyskinesia.
The lower frequency gamma, although less commonly reported, was found in STN recordings from PD patients in the “off state” (Weinberger et al., 2009; Sharott et al., 2014). The rat model data support the view that these two gamma bands are distinct phenomena, with the lower frequency correlating with activity in the mPFC, and the FTG more strongly organized in the MCx, both modulated by alterations in dopamine receptor stimulation. The fact that the ∼50 Hz gamma band is present in control as well as lesioned rats in the STN and mPFC during walking (Brown et al., 2002; van der Meer and Redish, 2009; van der Meer et al., 2010), argues that it is a normal, albeit cognitive, correlate of movement. On the other hand, the fact that this activity was reduced at day 12 post lesion in the hemiparkinsonian rats, and recovered by 3 weeks post lesion, suggests that both dopamine cell lesion and subsequent compensatory processes have impacted its expression (Lew and Tseng, 2014).
With respect to how loss of dopamine affects the information flow from mPFC and MCx to the STN, it is important to note that both the MCx and the mPFC project directly to the STN, as part of the hyperdirect pathway, and also influence STN activity indirectly, for example, through the striatum. While LFP activity most reliably reflects net input to the neurons surrounding the recording electrode, it may also be associated with synchronized spiking, and lead to phase-locked activity. Indeed, in many reports from parkinsonian patients, STN spiking is significantly phase locked to the exaggerated STN beta rhythm (Kühn et al., 2005; Weinberger et al., 2006; Yang et al., 2014). Here, we have also shown that STN spikes become significantly phase locked to 29–36 Hz LFP activity in the STN and MCx in the hemiparkinsonian rat during walking. This phase locking is consistent with the STN being influenced by synchronized activity in the hyperdirect pathway from MCx to STN and is dopamine dependent, as apomorphine and l-DOPA treatments reverse this synchronization.
The coherence between STN-mPFC in the low gamma range during treadmill walking in control and at 21 d after lesion was not associated with significant phase locking between STN spike trains and low gamma mPFC LFP. This may be relevant to the fact that the low gamma mPFC-STN coherence, albeit significant, is weaker than the high beta MCx-STN coherence, and to indications that the high beta activity in the STN is dysfunctional, whereas the low gamma activity may have a normal role within the limbic network coordinating responses to phasic events.
In conclusion, STN LFP activity can become synchronized with, and presumably modulated by, activity in both mPFC and MCx in a manner that varies with frequency range, behavioral state, and the integrity of the dopamine system. In hemiparkinsonian rats, oscillations of the high beta STN LFP are significantly modulated in conjunction with the contralateral paw movement whereas low gamma STN activity seems to be more related to the general demands of the motor task. Results support the role of the STN in integrating activity from motor and cognitive networks and the utility of the rodent model in examination of LFP activity power and coherence at different points within these networks in the context of different behavioral states and alterations in dopamine receptor stimulation.
Footnotes
This work was supported by the Intramural Research Program of the National Institute of Neurological Disorders and Stroke, National Institutes of Health (NIH). We thank Tom Talbot, Daryl Bandy, and Newlin Morgan in the section of Instrumentation, National Institute of Mental Health–National Institute of Neurological Disorders and Stroke for design and fabrication of the rotary treadmill.
The authors declare no competing financial interests.
References
- Alegre M, Alonso-Frech F, Rodríguez-Oroz MC, Guridi J, Zamarbide I, Valencia M, Manrique M, Obeso JA, Artieda J. Movement-related changes in oscillatory activity in the human subthalamic nucleus: ipsilateral vs contralateral movements. Eur J Neurosci. 2005;22:2315–2324. doi: 10.1111/j.1460-9568.2005.04409.x. [DOI] [PubMed] [Google Scholar]
- Alonso-Frech F, Zamarbide I, Alegre M, Rodríguez-Oroz MC, Guridi J, Manrique M, Valencia M, Artieda J, Obeso JA. Slow oscillatory activity and levodopa-induced dyskinesias in Parkinson's disease. Brain. 2006;129:1748–1757. doi: 10.1093/brain/awl103. [DOI] [PubMed] [Google Scholar]
- Anzak A, Gaynor L, Beigi M, Limousin P, Hariz M, Zrinzo L, Foltynie T, Brown P, Jahanshahi M. A gamma band specific role of the subthalamic nucleus in switching during verbal fluency tasks in Parkinson's disease. Exp Neurol. 2011;232:136–142. doi: 10.1016/j.expneurol.2011.07.010. [DOI] [PubMed] [Google Scholar]
- Anzak A, Gaynor L, Beigi M, Foltynie T, Limousin P, Zrinzo L, Brown P, Jahanshahi M. Subthalamic nucleus gamma oscillations mediate a switch from automatic to controlled processing: a study of random number generation in Parkinson's disease. Neuroimage. 2013;64:284–289. doi: 10.1016/j.neuroimage.2012.08.068. [DOI] [PubMed] [Google Scholar]
- Avila I, Parr-Brownlie LC, Brazhnik E, Castañeda E, Bergstrom DA, Walters JR. Beta frequency synchronization in basal ganglia output during rest and walk in a hemiparkinsonian rat. Exp Neurol. 2010;221:307–319. doi: 10.1016/j.expneurol.2009.11.016. [DOI] [PMC free article] [PubMed] [Google Scholar]
- Baunez C, Lardeux S. Frontal cortex-like functions of the subthalamic nucleus. Front Syst Neurosci. 2011;5:83. doi: 10.3389/fnsys.2011.00083. [DOI] [PMC free article] [PubMed] [Google Scholar]
- Benchenane K, Tiesinga PH, Battaglia FP. Oscillations in the prefrontal cortex: a gateway to memory and attention. Curr Opin Neurobiol. 2011;21:475–485. doi: 10.1016/j.conb.2011.01.004. [DOI] [PubMed] [Google Scholar]
- Berke JD. Fast oscillations in cortical-striatal networks switch frequency following rewarding events and stimulant drugs. Eur J Neurosci. 2009;30:848–859. doi: 10.1111/j.1460-9568.2009.06843.x. [DOI] [PMC free article] [PubMed] [Google Scholar]
- Biseul I, Sauleau P, Haegelen C, Trebon P, Drapier D, Raoul S, Drapier S, Lallement F, Rivier I, Lajat Y, Verin M. Fear recognition is impaired by subthalamic nucleus stimulation in Parkinson's disease. Neuropsychologia. 2005;43:1054–1059. doi: 10.1016/j.neuropsychologia.2004.10.006. [DOI] [PubMed] [Google Scholar]
- Brazhnik E, Cruz AV, Avila I, Wahba MI, Novikov N, Ilieva NM, McCoy AJ, Gerber C, Walters JR. State-dependent spike and local field synchronization between motor cortex and substantia nigra in hemiparkinsonian rats. J Neurosci. 2012;32:7869–7880. doi: 10.1523/JNEUROSCI.0943-12.2012. [DOI] [PMC free article] [PubMed] [Google Scholar]
- Brazhnik E, Novikov N, McCoy AJ, Cruz AV, Walters JR. Functional correlates of exaggerated oscillatory activity in basal ganglia output in hemiparkinsonian rats. Exp Neurol. 2014;261:563–577. doi: 10.1016/j.expneurol.2014.07.010. [DOI] [PMC free article] [PubMed] [Google Scholar]
- Brittain JS, Brown P. Oscillations and the basal ganglia: motor control and beyond. Neuroimage. 2014;85:637–647. doi: 10.1016/j.neuroimage.2013.05.084. [DOI] [PMC free article] [PubMed] [Google Scholar]
- Brown P. Oscillatory nature of human basal ganglia activity: relationship to the pathophysiology of Parkinson's disease. Mov Disord. 2003;18:357–363. doi: 10.1002/mds.10358. [DOI] [PubMed] [Google Scholar]
- Brown P, Oliviero A, Mazzone P, Insola A, Tonali P, Di Lazzaro V. Dopamine dependency of oscillations between subthalamic nucleus and pallidum in Parkinson's disease. J Neurosci. 2001;21:1033–1038. doi: 10.1523/JNEUROSCI.21-03-01033.2001. [DOI] [PMC free article] [PubMed] [Google Scholar]
- Brown P, Kupsch A, Magill PJ, Sharott A, Harnack D, Meissner W. Oscillatory local field potentials recorded from the subthalamic nucleus of the alert rat. Exp Neurol. 2002;177:581–585. doi: 10.1006/exnr.2002.7984. [DOI] [PubMed] [Google Scholar]
- Brücke C, Kempf F, Kupsch A, Schneider GH, Krauss JK, Aziz T, Yarrow K, Pogosyan A, Brown P, Kühn AA. Movement-related synchronization of gamma activity is lateralized in patients with dystonia. Eur J Neurosci. 2008;27:2322–2329. doi: 10.1111/j.1460-9568.2008.06203.x. [DOI] [PubMed] [Google Scholar]
- Brücke C, Bock A, Huebl J, Krauss JK, Schönecker T, Schneider GH, Brown P, Kühn AA. Thalamic gamma oscillations correlate with reaction time in a Go/noGo task in patients with essential tremor. Neuroimage. 2013;75:36–45. doi: 10.1016/j.neuroimage.2013.02.038. [DOI] [PubMed] [Google Scholar]
- Brunenberg EJ, Moeskops P, Backes WH, Pollo C, Cammoun L, Vilanova A, Janssen ML, Visser-Vandewalle VE, ter Haar Romeny BM, Thiran JP, Platel B. Structural and resting state functional connectivity of the subthalamic nucleus: identification of motor STN parts and the hyperdirect pathway. PLoS One. 2012;7:e39061. doi: 10.1371/journal.pone.0039061. [DOI] [PMC free article] [PubMed] [Google Scholar]
- Carta M, Carlsson T, Kirik D, Björklund A. Dopamine released from 5-HT terminals is the cause of l-DOPA-induced dyskinesia in parkinsonian rats. Brain. 2007;130:1819–1833. doi: 10.1093/brain/awm082. [DOI] [PubMed] [Google Scholar]
- Cassidy M, Mazzone P, Oliviero A, Insola A, Tonali P, Di Lazzaro V, Brown P. Movement-related changes in synchronization in the human basal ganglia. Brain. 2002;125:1235–1246. doi: 10.1093/brain/awf135. [DOI] [PubMed] [Google Scholar]
- Castrioto A, Lhommée E, Moro E, Krack P. Mood and behavioural effects of subthalamic stimulation in Parkinson's disease. Lancet Neurol. 2014;13:287–305. doi: 10.1016/S1474-4422(13)70294-1. [DOI] [PubMed] [Google Scholar]
- Delaville C, Cruz AV, McCoy AJ, Brazhnik E, Avila I, Novikov N, Walters JR. Oscillatory activity in basal ganglia and motor cortex in an awake behaving rodent model of Parkinson's disease. Basal Ganglia. 2014;3:221–227. doi: 10.1016/j.baga.2013.12.001. [DOI] [PMC free article] [PubMed] [Google Scholar]
- Donnelly NA, Holtzman T, Rich PD, Nevado-Holgado AJ, Fernando AB, Van Dijck G, Holzhammer T, Paul O, Ruther P, Paulsen O, Robbins TW, Dalley JW. Oscillatory activity in the medial prefrontal cortex and nucleus accumbens correlates with impulsivity and reward outcome. PLoS One. 2014;9:e111300. doi: 10.1371/journal.pone.0111300. [DOI] [PMC free article] [PubMed] [Google Scholar]
- Eisenstein SA, Dewispelaere WB, Campbell MC, Lugar HM, Perlmutter JS, Black KJ, Hershey T. Acute changes in mood induced by subthalamic deep brain stimulation in Parkinson disease are modulated by psychiatric diagnosis. Brain Stimul. 2014;7:701–708. doi: 10.1016/j.brs.2014.06.002. [DOI] [PMC free article] [PubMed] [Google Scholar]
- Eusebio A, Brown P. Oscillatory activity in the basal ganglia. Parkinsonism Relat Disord. 2007;13:S434–S436. doi: 10.1016/S1353-8020(08)70044-0. [DOI] [PubMed] [Google Scholar]
- Florin E, Erasmi R, Reck C, Maarouf M, Schnitzler A, Fink GR, Timmermann L. Does increased gamma activity in patients suffering from Parkinson's disease counteract the movement inhibiting beta activity? Neuroscience. 2013;237:42–50. doi: 10.1016/j.neuroscience.2013.01.051. [DOI] [PubMed] [Google Scholar]
- Foffani G, Priori A, Egidi M, Rampini P, Tamma F, Caputo E, Moxon KA, Cerutti S, Barbieri S. 300-Hz subthalamic oscillations in Parkinson's disease. Brain. 2003;126:2153–2163. doi: 10.1093/brain/awg229. [DOI] [PubMed] [Google Scholar]
- Fogelson N, Williams D, Tijssen M, van Bruggen G, Speelman H, Brown P. Different functional loops between cerebral cortex and the subthalmic area in Parkinson's disease. Cereb Cortex. 2006;16:64–75. doi: 10.1093/cercor/bhi084. [DOI] [PubMed] [Google Scholar]
- Friston KJ, Bastos AM, Pinotsis D, Litvak V. LFP and oscillations—what do they tell us? Curr Opin Neurobiol. 2015;31:1–6. doi: 10.1016/j.conb.2014.05.004. [DOI] [PMC free article] [PubMed] [Google Scholar]
- Halje P, Tamtè M, Richter U, Mohammed M, Cenci MA, Petersson P. Levodopa-induced dyskinesia is strongly associated with resonant cortical oscillations. J Neurosci. 2012;32:16541–16551. doi: 10.1523/JNEUROSCI.3047-12.2012. [DOI] [PMC free article] [PubMed] [Google Scholar]
- Haynes WI, Haber SN. The organization of prefrontal-subthalamic inputs in primates provides an anatomical substrate for both functional specificity and integration: implications for Basal Ganglia models and deep brain stimulation. J Neurosci. 2013;33:4804–4814. doi: 10.1523/JNEUROSCI.4674-12.2013. [DOI] [PMC free article] [PubMed] [Google Scholar]
- Jahanshahi M, Obeso I, Baunez C, Alegre M, Krack P. Parkinson's disease, the subthalamic nucleus, inhibition, and impulsivity. Mov Disord. 2015;30:128–140. doi: 10.1002/mds.26049. [DOI] [PubMed] [Google Scholar]
- Jenkinson N, Brown P. New insights into the relationship between dopamine, beta oscillations and motor function. Trends Neurosci. 2011;34:611–618. doi: 10.1016/j.tins.2011.09.003. [DOI] [PubMed] [Google Scholar]
- Jenkinson N, Kühn AA, Brown P. Gamma oscillations in the human basal ganglia. Exp Neurol. 2013;245:72–76. doi: 10.1016/j.expneurol.2012.07.005. [DOI] [PubMed] [Google Scholar]
- Joundi RA, Brittain JS, Green AL, Aziz TZ, Brown P, Jenkinson N. Oscillatory activity in the subthalamic nucleus during arm reaching in Parkinson's disease. Exp Neurol. 2012;236:319–326. doi: 10.1016/j.expneurol.2012.05.013. [DOI] [PubMed] [Google Scholar]
- Kempf F, Kühn AA, Kupsch A, Brücke C, Weise L, Schneider GH, Brown P. Premovement activities in the subthalamic area of patients with Parkinson's disease and their dependence on task. Eur J Neurosci. 2007;25:3137–3145. doi: 10.1111/j.1460-9568.2007.05536.x. [DOI] [PubMed] [Google Scholar]
- Kempf F, Brücke C, Salih F, Trottenberg T, Kupsch A, Schneider GH, Doyle Gaynor LM, Hoffmann KT, Vesper J, Wöhrle J, Altenmüller DM, Krauss JK, Mazzone P, Di Lazzaro V, Yelnik J, Kühn AA, Brown P. Gamma activity and reactivity in human thalamic local field potentials. Eur J Neurosci. 2009;29:943–953. doi: 10.1111/j.1460-9568.2009.06655.x. [DOI] [PubMed] [Google Scholar]
- Kolomiets BP, Deniau JM, Mailly P, Ménétrey A, Glowinski J, Thierry AM. Segregation and convergence of information flow through the cortico-subthalamic pathways. J Neurosci. 2001;21:5764–5772. doi: 10.1523/JNEUROSCI.21-15-05764.2001. [DOI] [PMC free article] [PubMed] [Google Scholar]
- Kühn AA, Williams D, Kupsch A, Limousin P, Hariz M, Schneider GH, Yarrow K, Brown P. Event-related beta desynchronization in human subthalamic nucleus correlates with motor performance. Brain. 2004;127:735–746. doi: 10.1093/brain/awh106. [DOI] [PubMed] [Google Scholar]
- Kühn AA, Trottenberg T, Kivi A, Kupsch A, Schneider GH, Brown P. The relationship between local field potential and neuronal discharge in the subthalamic nucleus of patients with Parkinson's disease. Exp Neurol. 2005;194:212–220. doi: 10.1016/j.expneurol.2005.02.010. [DOI] [PubMed] [Google Scholar]
- Levy R, Ashby P, Hutchison WD, Lang AE, Lozano AM, Dostrovsky JO. Dependence of subthalamic nucleus oscillations on movement and dopamine in Parkinson's disease. Brain. 2002;125:1196–1209. doi: 10.1093/brain/awf128. [DOI] [PubMed] [Google Scholar]
- Lew SE, Tseng KY. Dopamine modulation of GABAergic function enables network stability and input selectivity for sustaining working memory in a computational model of the prefrontal cortex. Neuropsychopharmacology. 2014;39:3067–3076. doi: 10.1038/npp.2014.160. [DOI] [PMC free article] [PubMed] [Google Scholar]
- Löpez-Azcarate J, Tainta M, Rodríguez-Oroz MC, Valencia M, González R, Guridi J, Iriarte J, Obeso JA, Artieda J, Alegre M. Coupling between beta and high-frequency activity in the human subthalamic nucleus may be a pathophysiological mechanism in Parkinson's disease. J Neurosci. 2010;30:6667–6677. doi: 10.1523/JNEUROSCI.5459-09.2010. [DOI] [PMC free article] [PubMed] [Google Scholar]
- Mitra PP, Bokil H. Observed brain dynamics. Oxford UP: 2007. [Google Scholar]
- Olsson M, Nikkhah G, Bentlage C, Björklund A. Forelimb akinesia in the rat Parkinson model: differential effects of dopamine agonists and nigral transplants as assessed by a new stepping test. J Neurosci. 1995;15:3863–3875. doi: 10.1523/JNEUROSCI.15-05-03863.1995. [DOI] [PMC free article] [PubMed] [Google Scholar]
- Oswal A, Brown P, Litvak V. Synchronized neural oscillations and the pathophysiology of Parkinson's disease. Curr Opin Neurol. 2013;26:662–670. doi: 10.1097/WCO.0000000000000034. [DOI] [PubMed] [Google Scholar]
- Priori A, Foffani G, Pesenti A, Bianchi A, Chiesa V, Baselli G, Caputo E, Tamma F, Rampini P, Egidi M, Locatelli M, Barbieri S, Scarlato G. Movement-related modulation of neural activity in human basal ganglia and its L-DOPA dependency: recordings from deep brain stimulation electrodes in patients with Parkinson's disease. Neurol Sci. 2002;23(Suppl 2):S101–S102. doi: 10.1007/s100720200089. [DOI] [PubMed] [Google Scholar]
- Priori A, Foffani G, Pesenti A, Tamma F, Bianchi AM, Pellegrini M, Locatelli M, Moxon KA, Villani RM. Rhythm-specific pharmacological modulation of subthalamic activity in Parkinson's disease. Exp Neurol. 2004;189:369–379. doi: 10.1016/j.expneurol.2004.06.001. [DOI] [PubMed] [Google Scholar]
- Rektor I, Bocková M, Chrastina J, Rektorova I, Baláz̆ M. The modulatory role of subthalamic nucleus in cognitive functions-A viewpoint. Clin Neurophysiol. 2015;126:653–658. doi: 10.1016/j.clinph.2014.10.156. [DOI] [PubMed] [Google Scholar]
- Rosenberg JR, Amjad AM, Breeze P, Brillinger DR, Halliday DM. The Fourier approach to the identification of functional coupling between neuronal spike trains. Prog Biophys Mol Biol. 1989;53:1–31. doi: 10.1016/0079-6107(89)90004-7. [DOI] [PubMed] [Google Scholar]
- Sharott A, Magill PJ, Harnack D, Kupsch A, Meissner W, Brown P. Dopamine depletion increases the power and coherence of beta-oscillations in the cerebral cortex and subthalamic nucleus of the awake rat. Eur J Neurosci. 2005;21:1413–1422. doi: 10.1111/j.1460-9568.2005.03973.x. [DOI] [PubMed] [Google Scholar]
- Sharott A, Gulberti A, Zittel S, Tudor Jones AA, Fickel U, Münchau A, Köppen JA, Gerloff C, Westphal M, Buhmann C, Hamel W, Engel AK, Moll CK. Activity parameters of subthalamic nucleus neurons selectively predict motor symptom severity in Parkinson's disease. J Neurosci. 2014;34:6273–6285. doi: 10.1523/JNEUROSCI.1803-13.2014. [DOI] [PMC free article] [PubMed] [Google Scholar]
- Stein E, Bar-Gad I. Beta oscillations in the cortico-basal ganglia loop during parkinsonism. Exp Neurol. 2013;245:52–59. doi: 10.1016/j.expneurol.2012.07.023. [DOI] [PubMed] [Google Scholar]
- Tan H, Pogosyan A, Anzak A, Ashkan K, Bogdanovic M, Green AL, Aziz T, Foltynie T, Limousin P, Zrinzo L, Brown P. Complementary roles of different oscillatory activities in the subthalamic nucleus in coding motor effort in Parkinsonism. Exp Neurol. 2013;248:187–195. doi: 10.1016/j.expneurol.2013.06.010. [DOI] [PMC free article] [PubMed] [Google Scholar]
- Tan SK, Temel Y, Blokland A, Steinbusch HW, Visser-Vandewalle V. The subthalamic nucleus: from response selection to execution. J Chem Neuroanat. 2006;31:155–161. doi: 10.1016/j.jchemneu.2006.01.001. [DOI] [PubMed] [Google Scholar]
- Temel Y, Kessels A, Tan S, Topdag A, Boon P, Visser-Vandewalle V. Behavioural changes after bilateral subthalamic stimulation in advanced Parkinson disease: a systematic review. Parkinsonism Relat Disord. 2006;12:265–272. doi: 10.1016/j.parkreldis.2006.01.004. [DOI] [PubMed] [Google Scholar]
- Trottenberg T, Fogelson N, Kühn AA, Kivi A, Kupsch A, Schneider GH, Brown P. Subthalamic gamma activity in patients with Parkinson's disease. Exp Neurol. 2006;200:56–65. doi: 10.1016/j.expneurol.2006.01.012. [DOI] [PubMed] [Google Scholar]
- van der Meer MA, Redish AD. Low and high gamma oscillations in rat ventral striatum have distinct relationships to behavior, reward, and spiking activity on a learned spatial decision task. Front Integr Neurosci. 2009;3:9. doi: 10.3389/neuro.07.009.2009. [DOI] [PMC free article] [PubMed] [Google Scholar]
- van der Meer MA, Kalenscher T, Lansink CS, Pennartz CM, Berke JD, Redish AD. Integrating early results on ventral striatal gamma oscillations in the rat. Front Neurosci. 2010;4:300. doi: 10.3389/fnins.2010.00028. [DOI] [PMC free article] [PubMed] [Google Scholar]
- Weinberger M, Mahant N, Hutchison WD, Lozano AM, Moro E, Hodaie M, Lang AE, Dostrovsky JO. Beta oscillatory activity in the subthalamic nucleus and its relation to dopaminergic response in Parkinson's disease. J Neurophysiol. 2006;96:3248–3256. doi: 10.1152/jn.00697.2006. [DOI] [PubMed] [Google Scholar]
- Weinberger M, Hutchison WD, Lozano AM, Hodaie M, Dostrovsky JO. Increased gamma oscillatory activity in the subthalamic nucleus during tremor in Parkinson's disease patients. J Neurophysiol. 2009;101:789–802. doi: 10.1152/jn.90837.2008. [DOI] [PubMed] [Google Scholar]
- Williams D, Tijssen M, Van Bruggen G, Bosch A, Insola A, Di Lazzaro V, Mazzone P, Oliviero A, Quartarone A, Speelman H, Brown P. Dopamine-dependent changes in the functional connectivity between basal ganglia and cerebral cortex in humans. Brain. 2002;125:1558–1569. doi: 10.1093/brain/awf156. [DOI] [PubMed] [Google Scholar]
- Womelsdorf T, Fries P. The role of neuronal synchronization in selective attention. Curr Opin Neurobiol. 2007;17:154–160. doi: 10.1016/j.conb.2007.02.002. [DOI] [PubMed] [Google Scholar]
- Yang AI, Vanegas N, Lungu C, Zaghloul KA. Beta-coupled high-frequency activity and beta-locked neuronal spiking in the subthalamic nucleus of Parkinson's disease. J Neurosci. 2014;34:12816–12827. doi: 10.1523/JNEUROSCI.1895-14.2014. [DOI] [PMC free article] [PubMed] [Google Scholar]