Abstract
Background:
The protein hormone granulocyte colony-stimulating factor (GCSF) stimulates the production of white blood cells and plays an important role in medical treatment of cancer patients.
Methods:
An efficient process was developed for heterologous expression of the human GCSF in E. coli BL21 (DE3). The feeding rate was adjusted to achieve the maximum attainable specific growth rate under critical value. In this method, specific growth rate was maintained at the maximum value of 0.55 h-1 at the beginning of feeding to 0.4 h-1 at the induction time. Recombinant human GCSF (rh-GCSF) was produced as inclusion body. At first, inclusion bodies were released by cell disruption and then washed, solubilized and refolded. Finally, the rh-GCSF was purified by cation exchange chromatography.
Results:
Obviouly, higher specific growth rate decreases process time and consequently increases productivity. The final concentration of biomass and GCSF was achieved 126 g DCW.l-1 and 32.1 g.l-1. Also, the final specific yield (YP/X) and total productivity of rh-GCSF were obtained 254 mg.g-1 DCW and 1.83 g.l-1.h-1, respectively. According to the available data, this is one of the highest YP/X and productivity that has been reported for any human protein which is expressed in E. coli. Recovery yield of purification process was %40 and purity of recombinant protein was over than 99%. The circular dichroism spectra of purified rh-GCSF, Neupogen® and PD-Grastim showed that all proteins have a similar secondary structure.
Conclusion:
Modified exponential feeding strategy for fed-batch cultivation of recombinant E. coli, results in minimum fed-batch duration and maximum productivity.
Key Words: Escherichia coli, Granulocyte colony-stimulating factor (GCSF), Process development
INTRODUCTION
Human granulocyte colony-stimulating factor (GCSF) is a single chain polypeptide composed of 174 residues, (MW = 18.8 kDa). GCSF is a hemopoietic growth factor that stimulates proliferation, differentiation, and functional activation of blood cells. Active GCSF contains a free cysteine at position 17 and two intramolecular disulfide bonds formed between positions 36/42 and 64/74 [1-3].
It is well known that E. coli is a useful host for production of recombinant proteins [4-9], since it has simple nutrient requirement, well known molecular genetics and cellular physiology, and high growth rate on inexpensive substrate [4, 5, 9]. In the case of intracellular recombinant protein expression, productivity is proportional with the final cell density and the specific yield (i.e. the amount of product formed per time unit). Therefore, fed-batch cultivation, which is an important method to achieve high cell-density culture, improves productivity of target products. Suitable feeding strategies in fed-batch cultivation regulate available nutrient concentration and consequently affect specific growth rate, maximum cell concentration, the specific yield of recombinant protein, and formation of by-products [6, 10-12].
Exponential feeding is one of the most widely used approaches that allow implementation of the process and manipulation of specific growth rate [6, 12-14] by control of limiting substrate. In the exponential feeding method, cells grow under constant specific growth rate by increasing feeding rate corresponding to cell concentration and inhibit acetate formation by maintaining specific growth rate below the critical value. Therefore, keeping μ at a maximum attainable level and its control under a critical value before induction provide the nutrients at suitable concentr-ation ranges, which is very important for achieving high cell density and productivity [15,16].
Overexpression of heterologous proteins in E. coli cytoplasm often results in the formation of insoluble aggregates, so called inclusion bodies. Production of recombinant protein as inclusion body has a drawback and some benefits. Inclusion body contains high degree purity of target protein, and inactive proteins can be protected from proteolysis [17]. Also, it can be recovered from cell lysate (mechanically disrupted cell) by simple centrifugation [18]. The main challenge in recombinant protein production as inclusion body is the isolation of active proteins from inclusion bodies. This process includes inclusion body solubilization in high concentration denaturant agents (such as urea or guanidine hydrochloride) and protein refolding for remove of denaturant in the presence of oxidizing agent [19-21]. Generally, inclusion bodies are solubilized at extreme pH that is special for each protein. In the case of recombinant protein contain disulfide bond, appropriate redox condition is needed for protein refolding [17].
A few researches have shown that the recombinant human GCSF (rh-GCSF) expression level in E. coli is at moderate to high level [20,13], but the yield of final product is poor. Hence, for the first time in this study, we tried to obtain higher yield and productivity by keeping specific growth rate at a maximum attainable level during the exponential feeding of fed-batch cultivation. We also investigated the effect of feeding strategy on by-products and medium ingredient concentration, plasmid stability, and total process time in the fed-batch process during high cell-density culture of recombinant E. coli BL21 (DE3) [pET23a-hgcsf]. Then we tried to develop an efficient process for purification of rh-GCSF. Purified rh-GCSF was characterized with circular dichroism and size exclusion chromatography rather than standard samples, such as Neupogen® (Roche, Germany) and PD-Grastim (Pooyesh Darou, Iran).
MATERIALS AND METHODS
Microorganism and vector system. The host cell, E. coli BL21 (DE3) (Novagen, United States), which contained pET23a inducible expression vector (Novagen, United States) carring the rh-GCSF gene [21] at NotI and NdeI sites. Transformed cells using the calcium chloride procedure were cultured on Luria-Bertani (LB) agar plates containing 100 mg/l ampicillin.
Media and solutions. Transformed E. coli was cultivated on LB agar medium and M9 modified medium, which were used as seed culture and fermentation medium. M9 modified medium contained 10 g glucose, 15 g K2HPO4, 7.5 g KH2PO4, 2 g citric acid, 2.5 g (NH4)2SO4, 2 g MgSO4.7H2O, and 1 ml trace element solution per liter. The trace element solution consisted of 2.8 g FeSO4.7H2O, 2 g MnCl2.4H2O, 2.8 g CoSO4.7H2O, 1.5 g CaCl2.2H2O, 0.2 g CuCl2.2H2O and 0.3 g ZnSO4.7H2O per liter in 1 M HCl, and each medium contained 100 mg/l ampicillin. Fed-batch cultivation was carried out in a 2 L bench-top bioreactor (Inforse AG, Switzerland) with the working volume of 1 L, including two six-blade Rushton impellers with a speed range of 50-1,200 rpm.
Analytical procedure. Cell growth was monitored by measuring culture turbidity at 600 nm and dry cell weight (DCW). For determination of DCW, pellet from 5 ml broth culture was dried at 105°C until constant weight [22]. Glucose, ammonia, phosphate, and acetate were analyzed enzymatically by using the appropriate kits (Chemenzyme, Iran and Boehringer Mannheim/R-Biopharm, Germany). The expression of rh-GCSF was analyzed by Coomassie brilliant blue-stained SDS-PAGE with 12.5% polyacrylamide [23] and quantified by a gel densitometer. Total soluble protein was analyzed by Bradford's method [24]. After SDS-PAGE, the gel was transferred to and blotted on the PVDF membrane in order to recognize rh-GCSF [23, 25]. The plasmid stability was determined by plating samples from fermentation broth on LB agar plates with and without ampicillin. Then the fraction of plasmid-containing cells on LB with ampicillin to those on LB without the antibiotic were calculated as plasmid stability [22].
Fed-batch cultivation . A batch culture was initially established by the addition of 100 ml of an overnight-incubated seed culture grown at 32oC and 100 rpm (OD600 = 1.4-1.6). pH was maintained at seven by the addition of 25% (w/v) NH4OH or 3M H3PO4 solution. Dissolved oxygen was controlled at 30-40% (v/v) of air saturation by controlling both inlet air (which was enriched with pure oxygen) and agitation rate. Foam was controlled by the addition of silicon-anti-foaming reagent. After depletion of initial glucose in the medium, as indicated by a rapid increase in the dissolved oxygen concentration, the feeding was initiated. Feeding rate was increased step by step based on the exponential feeding strategy with maximum attainable specific growth rate during fed-batch cultivation. The exponential feeding was determined by the following equation (equation 1) [26] :
| (1) |
Where V0 is volume of the medium in the bioreactor (l), X0 is biomass concentration at the start of feeding g(DCW) l-1, t is the time (h), μ is the specific growth rate (h-1), S0 is the glucose concentration (g l-1) which is 400 g l-1 in the feeding solution, F(t) is feeding rate (l h-1), M(t) is mass feeding rate (g h-1), YX/S is the yield of biomass as a result of substrate (g DCW g-1 glucose), t0 (h) is the starting time for each feeding step, and m is the specific maintenance coefficient (g g-1 h-1). Feeding rate was corrected by the turbidity of taken samples every 10 minutes.
The coefficient yield (YX/S) and maintenance coefficient (m) were set at 0.5 and 0.025 g g-1 h-1, respectively. For development of a simple feeding strategy with the highest attainable specific growth rate during the entire process, a maximum oxygen transfer capacity was applied to the bioreactor, and glucose concentration was maintained below 2 g l-1 by a gradual increase in feeding at each step.
Cells were induced by the addition of 2 mM IPTG in all experiments. The required nitrogen source (ammonium) was supplied by the addition of 25% (w/v) NH4OH, which was also used for maintaining pH at 7. The temperature of the process was maintained at 37ºC, and the acetate and glucose concentrations were controlled manually at 10-min intervals.
Purification of recombinant human -granulocyte colony-stimulating factor. The fermented broth was centrifuged at 8,000 ×g at 4°C for 30 min, and the obtained pellet was washed twice with 50 mM phosphate buffer (pH 7.4). The wet cells (50 g per 200 ml lysis buffer) were suspended in lysis buffer, containing 100 mM Tris-HCl, 1 mM EDTA and 1 mM phenylmethylsulfonyl fluoride. Afterward, the cells were broken by passing the suspension through a homogenizer three times at 800 bar (Niro Soavi, North America). The cell homogenate was centrifuged, supernatant was discarded, and inclusion bodies were recovered.
Next, inclusion body concentration was measured using Bradford's method [24]. Then it (1 g inclusion body per 5 ml) was resuspended in first washing buffer (2.5 g l-1 Triton X-100, 50 mM Tris-HCl, 5 mM EDTA, 1 mM phenylmethylsulfonyl fluoride [pH 8], and 0.01 μg/ml DNase1) incubated for 40 min and recovered by centrifugation at 8,000 ×g at 25°C for 30 min. Second washing step, the inclusion body pellet, was resuspended in second washing buffer (2 M urea) and incubated for 40 min and then recovered at 8,000 ×g at 25°C for 30 min. Then, 350 mg of washed inclusion bodies was dissolved in 10 ml inclusion body solubilization buffer (30 mM Tris-HCl [pH 12], 1 mM EDTA, 8 M urea, and 100 mM reduced glutathione. The solution was incubated at 25-28oC for 45 min and spun down to remove insoluble cell debris. The rh-GCSF was refolded by adding protein solution to refolding buffer (3 mg protein per ml refolding buffer with stirring), containing 30 mM Tris-HCl (pH 5), 3 M urea, 20 mM glutathione, 2 mM oxidized glutathione, and 1 mM EDTA). The pH of refolded protein solution was adjusted to 5 with 2 M acetic acid. Subsequently, refolded protein solution was applied in cation exchanger, Tricorn mono S 10/100 GL column (GE, USA), which was previously equilibrated with three bed volume of buffer A (20 mM Na-acetate, pH 5.0) at 4 ml/min. A 50-ml linear gradient to 100% buffer B (1 M NaCl in buffer A) was applied at 2 ml/min. The fractions containing the desired rh-GCSF were pooled and concentrated using Amicon Ultra (Millipore, USA) with a molecular mass cut-off of 5 kDa by centrifugation at 4,500 ×g at 4 oC for 60 min.
Concentrated protein solution was applied to a Superdex 75 (16/60) column (GE Healthcare, USA), which had equilibrated with GFC buffer (20 mM sodium acetate, pH 5.0). Isocratic elution was performed with buffer A at 0.8 ml/min, and 2.4-ml fractions were collected. Fractions containing rh-GCSF were pooled and stored at -80°C, and protein concentration was determined based on the calculated extinction coefficient of 15820 M-1cm-1 at 280 nm for rh-GCSF.
Circular dichroism measurement. The purified rh-GCSF alongside innovator product (Neupogen®) was analyzed with 10-µM protein in 10 mM citrate buffer (20.5 ml citric acid and 29.5 ml sodium citrate, pH 5) at 22ºC by Jasco J-715 spectropolarimeter using 2 mm path length cylindrical cell [27].
Analysis of monomer and aggregates. Size exclusion chromatography was carried out by using TSK-GEL G3000SWXL (300 mm × 7.8 mm, Tosoh, Japan) column chromatography system with photodiode array detector. The mobile phase consisted of K2HPO4-Na2HPO4 1 mM in water with pH of 6.2. Flow rate was maintained at 0.6 ml/min, and analysis was carried out at the wavelength of 280 nm [28].
Bioactivity assay. In this study, in vitro biological activity assay of rh-GCSF was evaluated by proliferation of HL-60 treated with DMSO. At first, 100 μl of HL-60 cell suspension (2 × 10⁵ cell/ml) was added into a 96-well microplate. Then DMSO and RA
(1.3% and 0.1 µM, respectively) were added to the each well and incubated at 37oC for 2 days in 5% CO2. Different dilutions of rh-GCSF were added to each well and incubated for two days at the same conditions. The reversal rate of the cells from the differentiative to the proliferative phase was determined by MTT assay. Finally, cell proliferation was measured by reductase mitochondrial enzyme through the reduction of MTT to Formazan [3].
RESULTS
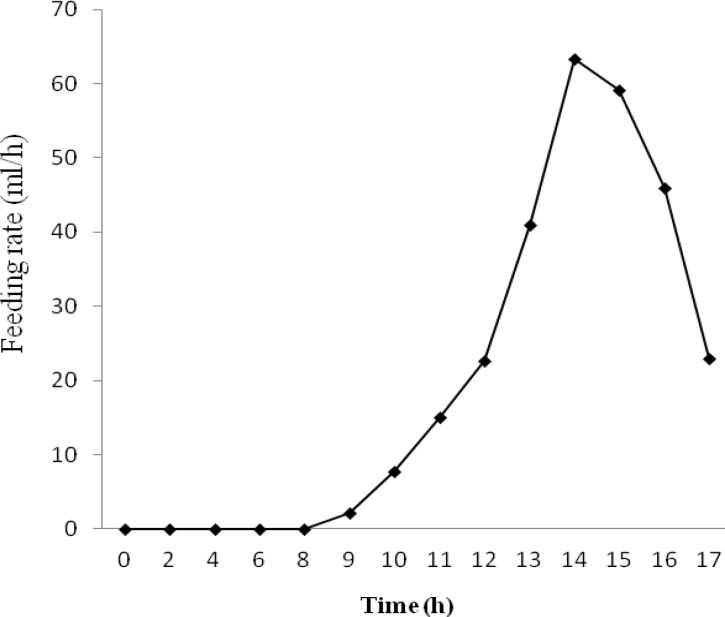
Due to metabolic burden of recombinant protein overexpression on E. coli as well as decrease in specific growth rate during induction [29], experiments were designed to obtain a feeding rate, which would lead to the higher attainable specific growth rate and consequently, higher cell concentration before induction. In this study, feeding rate was increased stepwise by maintaining the glucose concentration within a permissible range and using the maximum oxygen transfer capacity of the bioreactor. Figure 1 shows feeding rate variation during fed-batch cultivation of E. coli BL21(DE3) [pET23a-gcsf]. Maximum oxygen transfer rate was achieved by increasing the impeller rotation speed from 400 rpm to 1,200 rpm during the process.
Fig. 1.
Feeding rate variation during fed-batch cultivation of E. coli BL21(DE3) [pET23a-gcsf].
The exact equation for time variation in the specific growth rate was correlated by using experimental data obtained from various fed-batch cultures of E. coli BL21 (DE3) [pET23a-hgcsf] under the glucose non-limited conditions (equation 2):
| (2) |
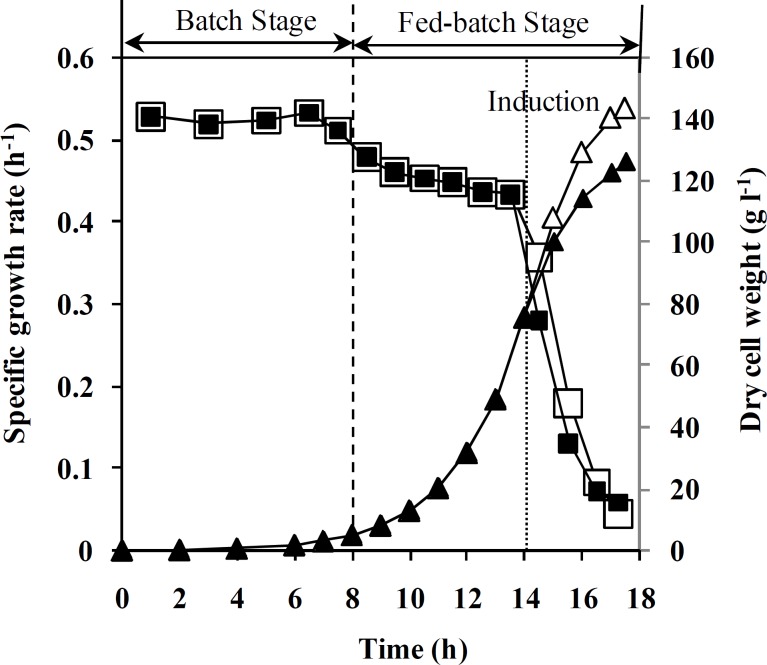
t0 is time at the start of feeding, t is the time of process, and R2 is coefficient of determination for equation 2. Equations 1 and 2 were used to determine the feeding rate in the fed-batch process. Figure 2 shows the results of using this feeding strategy on fed-batch cultures of un-induced recombinant E. coli BL21 (DE3) [pET23a-hgcsf].
Fig. 2.
Effect of feeding strategy on dry cell weight and specific growth rate during fed batch cultivation. Specific growth rate (h-1) in un-induced (□) and induced processes ( ) as well as dry cell weight (g.l-1) in un-induced (Δ) and induced processes (▲).
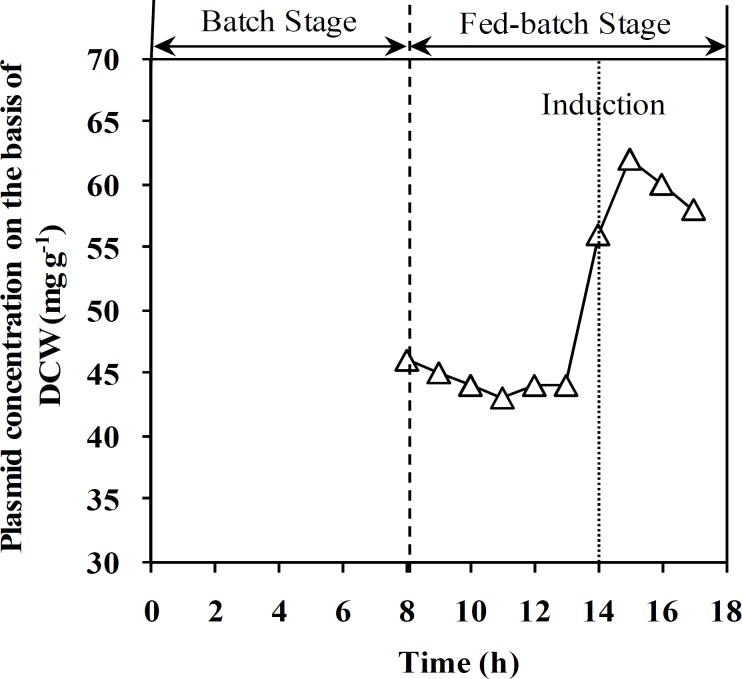
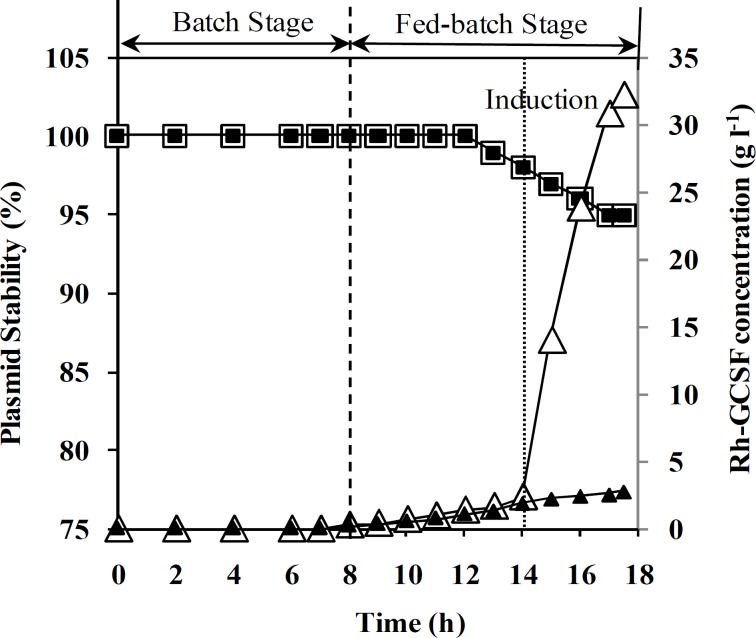
Figure 2 shows DCW and specific growth rate change during both un-induced and induced fed-batch culture of recombinant E. coli. Final cell concentration of un-induced fed-batch culture after 17.5 ± 0.5 was 145 ± 5 g (DCW) l-1. Based on the results, cell density in both fed-batch culture reached 75 g (DCW)l-1 during the first 14 h, while specific growth rate was decreased from 0.55 to 0.43 h-1. During feeding stage of fed-batch cultivation, the specific growth rate was decreased from 0.55 to 0.04 h-1. Moreover, decrease in specific growth rate of induced fed-batch culture was more than un-induced one. Maximum cell density and rh-GCSF concentration in induced process were 125 ± 5 g(DCW) l-1 and 32 ± 1 g(GCSF) l-1, respectively. In addition, the final specific yield (YP/X) and productivity of rh-GCSF in induced fed-batch culture were 250 ± 10 mg(GCSF) g-1 (DCW) and 1.83 ± 0.05 g (GCSF) l-1 h-1, respectively. Plasmid concentration in pre-induction stage of fed-batch culture was maintained constant and increased after induction (Fig. 3). As illustrated in Figure 4, plasmid stability was higher than 95% entire process. A slight decrease in plasmid stability after induction was related to metabolic burden of recombinant protein over-expression on host cells.
Fig. 3.
Effect of feeding strategy on plasmid concentration on the basis of CDW during fed-batch process
Fig. 4.
Effect of feeding strategy on plasmid stability and rh-GCSF concentration during fed batch cultivation. Plasmid stability (%) in un-induced (□) and induced processes ( ) as well as rh-GCSF concentration (g.l-1) in induced (Δ) and un-induced processes (▲).
Rh-GCSF concentration is also illustrated in Figure 4.
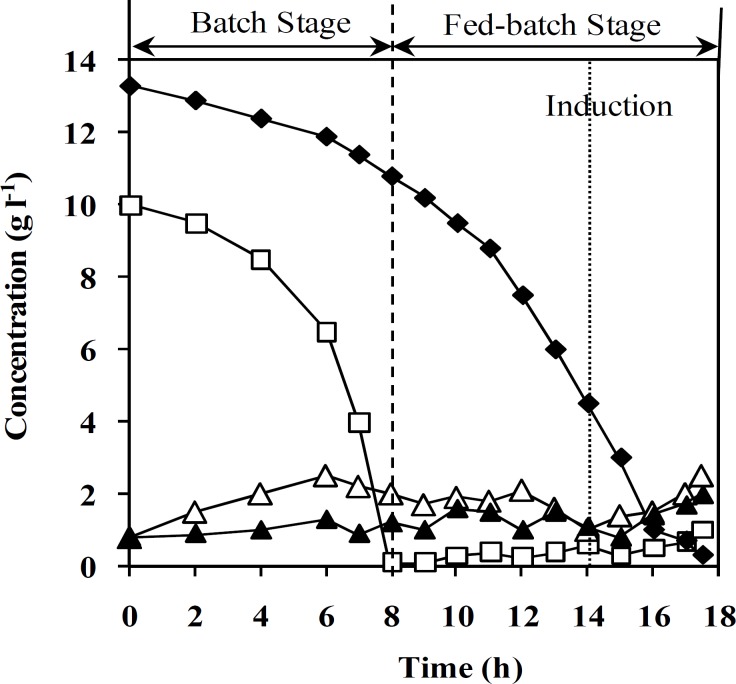
Acetate, glucose, ammonium, and phosphate concentration were monitored during fed-batch cultivation of recombinant E. coli (Fig. 5). The concentration of all mentioned components was less than the inhibitory level. It is obvious that specific growth rate change before induction is negligible, while it declines sharply after induction.
Fig. 5.
Effect of feeding strategy on concentration of the main medium components (g l-1). Concentration of phosphate ( ), glucose (□), acetate (Δ), and ammonium (▲), in induced recombinant E. coli BL21 (DE3) [pET23a-hgcsf].
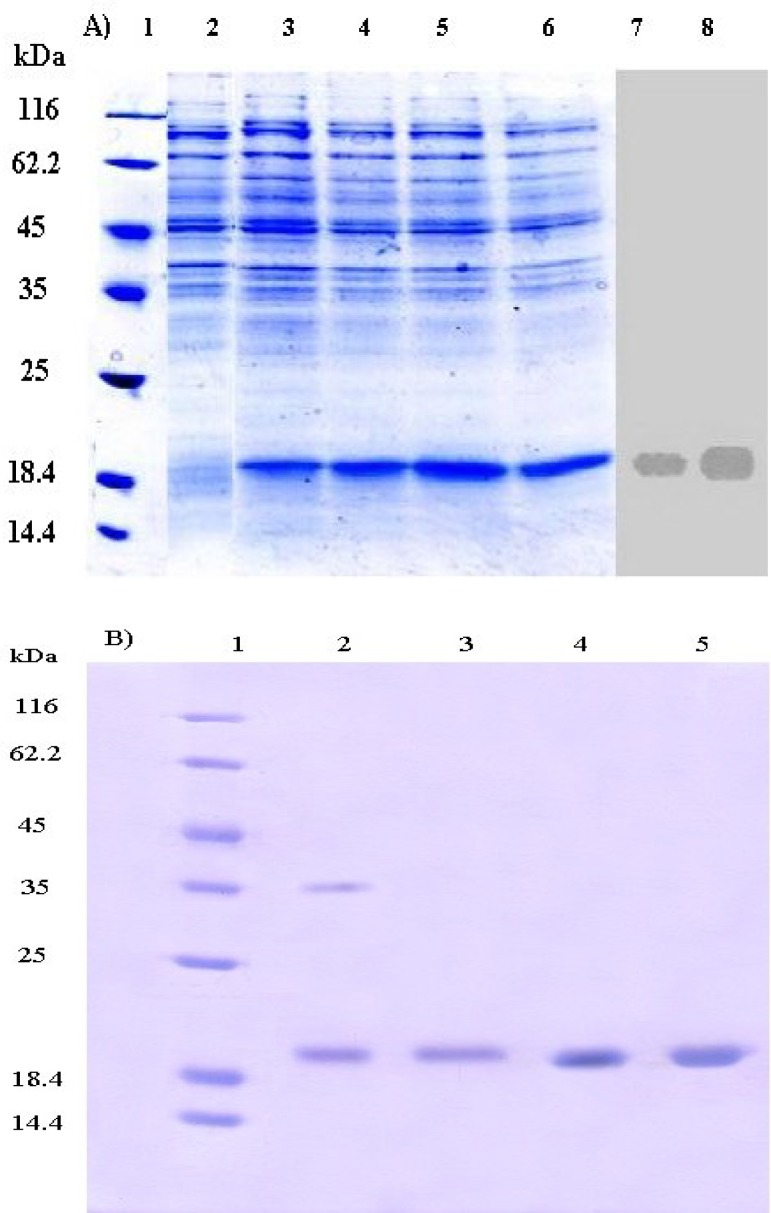
The expression of rh-GCSF before and after induction in fed-batch culture of E. coli was confirmed by SDS-PAGE and blotted GCSF onto PVDF membrane (Fig. 6). Operating on maximum achievable specific growth rate and suitable fermentation condition resulted in an appropriate expression level of GCSF.
Fig. 6.
SDS-PAGE analysis and Western blott of equivalent gel of the total cell lysate of E. coli BL21 (DE3) [pET23a-hgcsf]. (A) The end of the optimized fermentation. Lanes 1-6, Coomassie-stained SDS-PAGE; Laned 7 and 8, Western blott of equivalent gel using antibody to detect the rh-GCSF; lanes 1, molecular weight markers (kDa); lane 2, total cell lysate at the induction time (t = 0 h); lane 3, total cell lysate at t = 1 h; lane 4, total cell lysate at t = 2 h; lane 5, total cell lysate at t = 3 h; lane 6, total cell lysate at t = 3.5 h. 1: The purity profile of rh-GCSF expressed in E. coli. (B) SDS-PAGE (15%) analysis of purified rh-GCSF showing a single protein band. Lane 1, Molecular weight marker (#SM0431, Fermentas), lane 2, refolded rh-GCSF; lane 3, purified rh-GCSF; lane 4, reference standard (Neupogen®); lane 5, reference Standard (PD-Grastim).
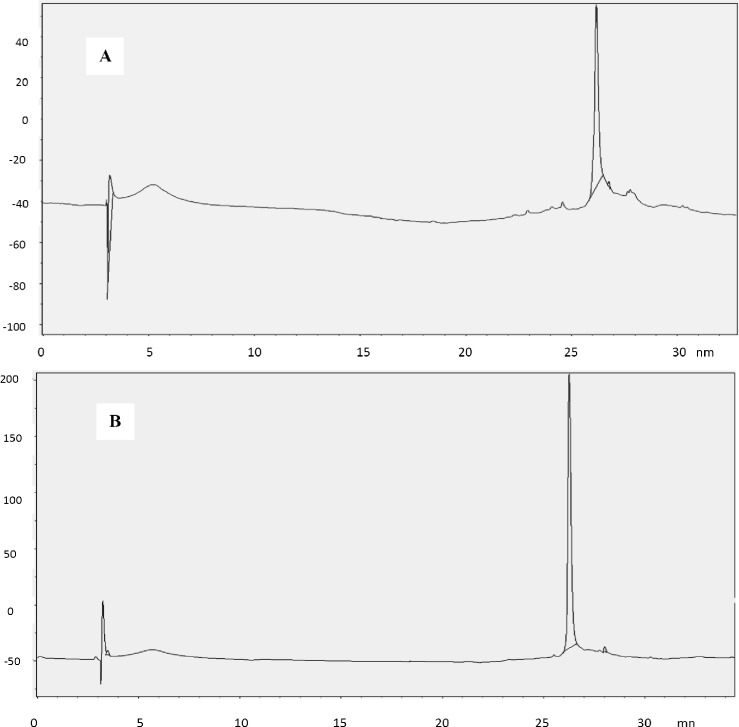
Purity of final product was more than 99% (Fig. 6B), which was validated by comparison with Neupogen® (Roche, Germany) and PD-Grastim (Pooyesh Darou, Iran) as reference standards. In addition, two-step washing procedure was sufficient to eliminate proteins and DNA of host cell (data not shown). Obtaining inspection chromatogram of TSK-GEL column for rh-GCSF and Neupogen confirmed molecular weight of rh-GCSF.
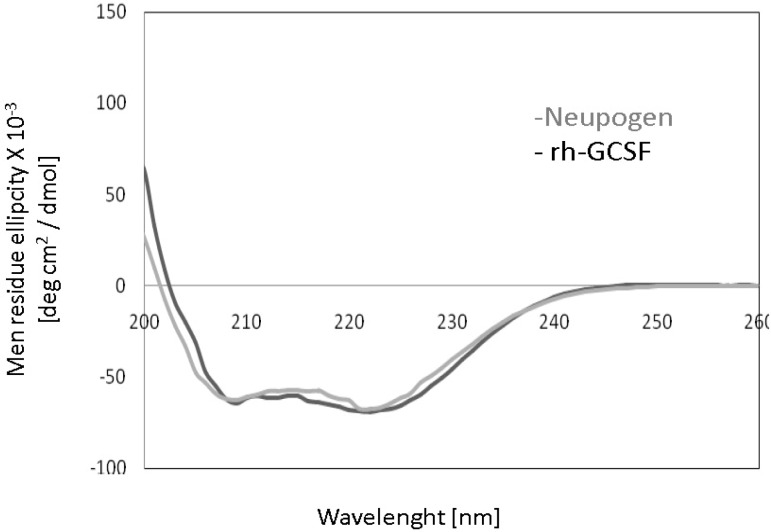
The Bradford's assay [24] and gel densitometry analysis (Fig. 6B) showed that protein purification yield was 400 mg protein per 1 g inclusion body (40%). Based on the above results, it can be found out that the purified protein (purity > 99%) in this article is comparable with reference standards of Neupogen® (Roche, Germany) and PD-Grastim (Pooyesh Darou, Iran). In comparison with other studies, the obtained amount of recombinant protein in this article is one of the highest productivity that has been recently reported [28, 30-32]. Rh-GCSF expression and purification yield were presented in the Table 1. The circular dichroism spectra showed that the rh-GCSF was on par with the reference standard of Neupogen® (Fig. 7). The circular dichroism spectrum of rh-GCSF in sodium citrate buffer (pH 5) was consistent with the previously reported structure (PDB ID code 1RHG), indicating an alpha-helix content of 66-68% [3]. The circular dichroism spectrum of Neupogen® showed 67-70% alpha-helix content. This result indicates that the secondary structure of purified rh-GCSF is similar spectra of purified rh-GCSF and PD-Grastim (Fig. 8) showed that both proteins have a similar curve; to Neupogen®. The size exclusion chromatography therefore, it is obvious that protein purification successfully performed and purified protein has had no dimer contamination. The increase in the growth of HL-60 cells by rh-GCSF was similar to Neupogen®. Therefore, it can be concluded that the specific activity of rh-GCSF is identical with the innovator product.
Table 1.
Protein expression and purification yield
| Dry cell weight | Rh-GCSF concentration | Rh-GCSF yield | |
|---|---|---|---|
| None-induced fed-batch | 142 (g/lit) | --- | --- |
| Induced fed-batch | 127 (g/lit) | 32 (g/l) | 1.83 (mg.l-1.h-1) |
| Purification | --- | 400 (mg/g IB) | 40% |
IB, inclusion body
Fig. 7.
Circular dichroism spectra of rh-GCSF, and Neupogen. Circular dichroism spectra of rh-GCSF (black) and Neupogen (gray) are shown. The mean residue ellipticity of the proteins (10 mM) were measured at 22°C in 10 mM citrate buffer at pH 5.
Fig. 8.
Size exclusion chromatography (SEC) spectra of rh-GCSF, and Neupogen. SEC spectra of rh-GCSF (A) and Neupogen (B) are shown. The SEC has done with TSK-GEL G3000SWXL (300 mm × 7.8 mm) column. Moving phase contain 1mM K2HPO4- Na2HPO4 in water at pH 6.2.
DISCUSSION
According to the data presented in Figure 2, specific growth rates ranging from 0.55-0.4 h-1 were applied before induction of rh-GCSF. Implementation of the fed-batch process in higher specific growth rate before induction led to higher biomass production and consequently, higher productivity of GCSF, which was in agreement with the data presented by other researchers [14, 16, 28, 33].
Figure 2 illustrates that during feeding, the specific growth rate was decreased, which may be because of (1) inhibitory effect of acetate accumulation, (2) oxygen transfer limitation due to high cell density and accumulation of antifoam at the end of the fermentation process [12, 34], (3) stress response related to induction of recosmbinant protein overexpression in E. coli and environmental stresses such as very high mixing rate [8]. This Figure shows a sharp decrease in specific growth rate after induction because of the increasing metabolic burden of cells by recombinant gene overexpression [12, 34]
The results of plasmid content (Fig. 3) showed that in the employed fed-batch technique, high cell density has no negative effect on plasmid content. Furthermore, Plasmid stability is one of the most important issues affecting the productivity of recombinant protein production in E. coli fed-batch cultivation [31, 32]. Although it has been difficult to find real trends in relationship between plasmid stability and specific growth rate in most cases, change in this parameter seems to be a function of the specific growth rate in the fed-batch. It has found that plasmid stability is reduced by decreasing growth rate, primarily because growth rate of plasmid-containing cells is less than the plasmid-free cells. [13, 31, 32]. Therefore, it can be expected that plasmid stability increases by increasing the specific growth rate (Fig. 4).
At high cell density, acetate formation and accumulation are main challenges during recombinant protein production [10, 28] that can be minimized by controlling the specific growth rate below a certain value (depending on strain) [12]. In this study, by exponential feeding strategy, specific growth rate was controlled below critical value; therefore, acetate concentration was controlled under inhibitory level (less than 5 g l-1 for acetate) [35] (Fig. 5). By this feeding strategy, glucose concentration was also maintained simultaneously at a suitable concentration range without any starvation and accumulation of glucose (Fig. 5). Dissolved oxygen concentration was maintained higher than least quantity that was reported throughout fed-batch mode (more than 6%, v/v air saturation) [36].
In this study, human recombinant protein expression was carried out in developed fed-batch culture of E. coli (data not shown). Therefore, in comparison with other studies, the cultivation time was decreased, while cell density and rh-GCSF concentration were increased significantly [6, 13, 25, 30, 31]. Overall, the product-ivity of GCSF was higher than that reported by other researchers [34].
Figure 6A shows the SDS-PAGE of total cell proteins and Western blot of equivalent gel after induction at a cell density of 75 g l-1 DCW with 2 mM IPTG as inducer. Fraction of rh-GCSF remarkably increases by passing time after induction, and percentage of expressed recombinant protein to total protein at the end of the process is 45.
This process has the following advantages resulting in the higher percentage of recombinant protein expression to total protein: (1) reduction of process time, (2) decrease of by-products accumulation, especially acetate, (3) increase of plasmid stability, (4) suitable concentration range of nutrients, such as glucose, ammonium and phosphate during fed-batch cultivation [7, 13, 14, 26, 37].
Applying modified exponential feeding strategy for fed-batch culture of recombinant E. coli resulted in an increase in attainable specific growth rate, reduce of process time, and maximum productivity. Therefore, this strategy can successfully be applied to enhance the production of any recombinant proteins in E. coli or other expression systems.
Based on the above results, it can be found that rh-GCSF protein isolated in this study is highly pure and comparable with the innovator products, Neupogen® and PD-Grastim. These properties serve as a basis for comparison of process reproducibility, creating the range of conditions to stabilize the protein during production and storage as well as for identifying characteristics valuable for monitoring stability during long-term storage.
In the present study, we developed an efficient procedure for production and purification of rh-GCSF in E. coli by using a new developed method. According to the available data, result of this article is one of the highest YP/X and productivity that has been reported for any human recombinant protein expressed in E. coli [27, 28, 30, 34, 38].
References
- 1.Tian H, Liu G, Gao XD, Yao WB. Optimization of auto-induction medium for G-CSF production by Escherichia coli using artificial neural network coupled with genetic engineering. World J Microbiol Biotechnol. 2012 Nov;29(3):505–13. doi: 10.1007/s11274-012-1204-1. [DOI] [PubMed] [Google Scholar]
- 2.Sharifi Tabar M, Habashi AK, Rajab Memari H. Human granulocyte-colony stimulating factor (rh-GCSF) expression in plastids Lactuca saive. IBJ. 2013 Jul;17(3):158–64. doi: 10.6091/ibj.1180.2013. [DOI] [PMC free article] [PubMed] [Google Scholar]
- 3.Ko JH, Kim KH, Pang MG, Koo JS, Fang N, et al. Production of biologically active human granulocyte colony stimulating factor in the milk of transgenic goat production of biologically active human granulocyte colony stimulating factor in the milk of transgenic goat. Transgenic Res. 2000 May;9(3):215–22. doi: 10.1023/a:1008972010351. [DOI] [PubMed] [Google Scholar]
- 4.Orawan K, Sunutcha S. Strategies for production of active eukaryotic proteins in bacterial expression system. Asian Pac J Trop Biomed. 2012 Feb;2(2):159–62. doi: 10.1016/S2221-1691(11)60213-X. [DOI] [PMC free article] [PubMed] [Google Scholar]
- 5.Zhao Y, He W, Liu WF, Liu CC, Feng LK, Sun L, et al. Two distinct states of Escherichia coli cells that overexpress the recombinant heterogeneous β-galactosidase. J Biol Chem. 2012 doi: 10.1074/jbc.M111.327668. doi/10.1074/jbc.M111.327668. [DOI] [PMC free article] [PubMed] [Google Scholar]
- 6.Choi JH, Keum KC, Lee SY. Production of recombinant proteins by high cell density culture of Escherichia coli. Chem EngSci. 2006 Feb;61(3):876–85. [Google Scholar]
- 7.Jana S, Deb JK. Strategies for efficient production of heterologous proteins in Escherichia coli. ApplMicrobiolBiotechnol. 2005 May;67(3):289–98. doi: 10.1007/s00253-004-1814-0. [DOI] [PubMed] [Google Scholar]
- 8.Shiloach J, Kaufman J, Guillard AS, Fass R. Effect of glucose supply strategy on acetate accumulation growth and recombinant E coli BL21 (lDE3) and E coli JM109. BiotechnolBioeng. 1996 Feb;49(4):421–8. doi: 10.1002/(SICI)1097-0290(19960220)49:4<421::AID-BIT9>3.0.CO;2-R. [DOI] [PubMed] [Google Scholar]
- 9.Heyland J, Blank LM, Schmid A. Quantification of metabolic limitations during recombinant protein production in Escherichia coli. J Biotechnol. 2011 Sep;155(2):178–84. doi: 10.1016/j.jbiotec.2011.06.016. [DOI] [PubMed] [Google Scholar]
- 10.Babaeipour V, Shojaosadati SA, Khalilzadeh R, Maghsoudi N, Tabandeh F. A proposed feeding strategy for overproduction of recombinant proteins by E. coli BiotechnolApplBiochem. 2008 Feb;49(Pt 2):141–7. doi: 10.1042/BA20070089. [DOI] [PubMed] [Google Scholar]
- 11.Korz DJ, Rinas U, Hellmuth K, Sanders EA, Deckwer WD. Simple fedbatch technique for high cell density cultivation of Escherihcia coli. J Biotechnol. 1995 Feb;39(1):59–65. doi: 10.1016/0168-1656(94)00143-z. [DOI] [PubMed] [Google Scholar]
- 12.Lee SY. High cell-density culture of Escherichia coli. TrendsBiotechnol. 1996 Mar;14(3):98–105. doi: 10.1016/0167-7799(96)80930-9. [DOI] [PubMed] [Google Scholar]
- 13.Gregory ME, Turner C. Open-loop control of specific growth rate in fed-batch cultures of recombinant E coli. BiotechnolTech. 1993 Des;7(12):889–94. [Google Scholar]
- 14.Sanden AM, Prytz I, Tubulekas I, Forberg C, Le H, Hektor A, et al. Limiting factors in Escherichia coli fed-batch production of recombinant proteins. BiotechnolBioeng. 2003 Jan;81(2):158–166. doi: 10.1002/bit.10457. [DOI] [PubMed] [Google Scholar]
- 15.Hoffmann F, Heuvel JVD, Zidek N, Rinas U. Minimizing inclusion body formation during recombinant protein production in Escherichia coli atbench and pilot plant scale. EnzymeMicrobTechnol. 2004 Mar;34(3-4):235–41. [Google Scholar]
- 16.Oh JS, Kim BG, Park TH. Importance of specific growth rate for subtilisin expression in fed-batch cultivation of Bacillus subtilis spoIIG mutant. EnzymeMicrobTechnol. 2002 May;30(6):747–51. [Google Scholar]
- 17.Vallejo LF, Ursula R. Strategies for the recovery of active proteins through refolding of bacterial inclusion body proteins. Microb Cell Fact. 2004;3 doi: 10.1186/1475-2859-3-11. [DOI] [PMC free article] [PubMed] [Google Scholar]
- 18.Batas B, Schiraldi C, Chaudhuri JB. Inclusion body purification and protein refolding using microfiltration and size exclusion chromatography. J Biotechnol. 1999 Feb;68(2-3):149–58. doi: 10.1016/s0168-1656(98)00197-7. [DOI] [PubMed] [Google Scholar]
- 19.Basu S, Dunn A, Ward A. G-CSF: Function and modes of action (Review) IntJ Mol Med. 2002 Jul;10(1):3–10. [PubMed] [Google Scholar]
- 20.Enfors SO, Jahic M, Rozkov A, Xu B, Hecker M, Jürgen B, et al. Physiological responses to mixing in large scale bioreactors. J Biotechnol. 2001 Feb;13:175–85. doi: 10.1016/s0168-1656(00)00365-5. [DOI] [PubMed] [Google Scholar]
- 21.Fallah MJ, Akbari B, Saeedinia AR, Karimi M, Vaez M, Zeinoddini M, et al. Overexpression of Recombinant Human Granulocyte Colony-Stimulating Factor in E coli. IJMS. 2003 Sep;28(3):131–4. [Google Scholar]
- 22.Panda AK, Khan RH, Rao KBCA, Totey SM. Kinetic of inclusion body production in batch and high cell density fed-batch culture of Escherichia coli expressing ovine growth hormone. J Biotechnol. 1999 Oct;75(2-3):161–72. doi: 10.1016/s0168-1656(99)00157-1. [DOI] [PubMed] [Google Scholar]
- 23.Burnette WN. “Western Blotting”: Electrophoretic transfer of proteins from sodium dodecyl sulfate-polyacrylamide gels to unmodified nitrocellulose and radiographic detection with antibody and radioiodinated protein A. AnalBiochem. 1981 Apr;112(2):195–203. doi: 10.1016/0003-2697(81)90281-5. [DOI] [PubMed] [Google Scholar]
- 24.Bradford MM. A rapid and sensitive method for the quantitation of microgram quantities of protein utilizing the principle protein dye-binding. AnalBiochem. 1976 May;72:248–54. doi: 10.1016/0003-2697(76)90527-3. [DOI] [PubMed] [Google Scholar]
- 25.Gershoni JM, Palade GE. Protein blotting: Principles and applications. AnalBiochem. 1983 May;131(1):1–15. doi: 10.1016/0003-2697(83)90128-8. [DOI] [PubMed] [Google Scholar]
- 26.Curless CE, Pope J, Tsai L. Effect of pre-induction specific growth rate on recombinant alpha consensus interferon synthesis in Escherichia coli. BiotechnolProg. 1990 Mar-Apr;6(2):149–52. doi: 10.1021/bp00002a009. [DOI] [PubMed] [Google Scholar]
- 27.Rao Dasari VK, Are D, Joginapally VR, Mangamoori LN, Adibhatla KSBR. Optimization of the downstream process for high recovery of rhG-CSF from inclusion bodies expressed in Escherichia coli. Process Biochem. 2008 May;43(5):566–75. [Google Scholar]
- 28.Codevilla CF, Brum L, Oliveira PR, Dolman C, Rafferty B, Dalmora LS. Validation of an SEC-HPLC method for the analysis of rhG-CSF in pharmaceutical formulations. J Liq Chromatogr RT. 2004;27(17):2689–98. [Google Scholar]
- 29.Khalilzadeh R, Shojaosadati SA, Bahrami A, Maghsoudi N. Over-expression of recombinant human interferon-gamma in high cell density fermentation of Escherichia coli. BiotechnolLett. 2003 Dec;25:1989–92. doi: 10.1023/b:bile.0000004390.98648.25. [DOI] [PubMed] [Google Scholar]
- 30.Yang SY, Bae CS, Lee J. Production of recombinant human granulocyte-colony-stimulating factor in high cell density yeast cultures. Biotechnol Lett. 1997 Jul;19(7):655–9. [Google Scholar]
- 31.Rao DVK, Narasu ML, Rao AKSB. A purification method for improving the process yield and quality of recombinant human granulocyte colony-stimulating factor expressed in Escherichia coli and its characterization. Biotechnol Appl Biochem. 2008;50:77–87. doi: 10.1042/BA20070130. [DOI] [PubMed] [Google Scholar]
- 32.Vanz ALS, Renard G, Palma MS, Chies JM, Dalmora SL, Basso LA, et al. Human granulocyte colony stimulating factor (hG-CSF): cloning, overexpression, purification and characterization. Microb Cell Fact. 2008 Jan;7(13) doi: 10.1186/1475-2859-7-13. [DOI] [PMC free article] [PubMed] [Google Scholar]
- 33.Koom TY, Park TH. Increased production of recombinant protein by Escherichia coli deficient in acetic acid formation. J Microbiol Biotechnol. 1999;9:789–93. [Google Scholar]
- 34.Filomena S, Joao AQ, Fernanda C. Domingues, Evaluating metabolic stress and plasmid stability in plasmid DNA production by Escherichia coli. Biotech Adv. 2012 Jan;30:691–708. doi: 10.1016/j.biotechadv.2011.12.005. [DOI] [PubMed] [Google Scholar]
- 35.Kim BS, Lee SC, Lee SY, Chang YK, Chang HN. High cell density fed-batch cultivation of Escherichia coli using exponential feeding combined with pH-stat. Bioprocess Biosyst Eng. 2004 Feb;26(3):147–50. doi: 10.1007/s00449-003-0347-8. [DOI] [PubMed] [Google Scholar]
- 36.Kleman GL, Stroh WR. Developments in high cell density and high productivity microbial fermentation. CurrOpinBiotechnol. 1994 Apr;5(2):180–6. doi: 10.1016/s0958-1669(05)80033-3. [DOI] [PubMed] [Google Scholar]
- 37.Yim SC, Jeong KJ, Chang HN, Lee SY. High-level secretory production of human G-CSF by fed-batch culture of recombinant Escherichia coli. BioprocBiosystEng. 2001 Nov;24:249–54. [Google Scholar]
- 38.Lee J, Lee SY, Park S. Fed-batch culture of Escherichia coli W by exponential feeding of sucrose as a carbon source. BiotechnolTech. 1997 Jan;11(1):59–62. [Google Scholar]


