

Abstract
It has been 50 years since the first newborn screening (NBS) test for galactosemia was conducted in Oregon, and almost 10 years since the last US state added galactosemia to their NBS panel. During that time an estimated >2,500 babies with classic galactosemia have been identified by NBS. Most of these infants were spared the trauma of acute disease by early diagnosis and intervention, and many are alive today because of NBS. Newborn screening for galactosemia is a success story, but not yet a story with a completely happy ending. NBS, follow-up testing, and intervention for galactosemia continue to present challenges that highlight gaps in our knowledge. Here we compare galactosemia screening and follow-up data from 39 NBS programs gathered from the states directly or from public sources. On some matters the programs agreed: for example, those providing relevant data all identify classic galactosemia in close to 1/50,000 newborns and recommend immediate and lifelong dietary restriction of galactose for those infants. On other matters the programs disagree. For example, Duarte galactosemia (DG) detection rates vary dramatically among states, largely reflecting differences in screening approach. For infants diagnosed with DG, >80% of the programs surveyed recommend complete or partial dietary galactose restriction for the first year of life, or give mixed recommendations; <20% recommend no intervention. This disparity presents an ongoing dilemma for families and healthcare providers that could and should be resolved.
Electronic supplementary material
The online version of this chapter (doi:10.1007/8904_2014_302) contains supplementary material, which is available to authorized users.
Introduction
Classic galactosemia is a potentially life-threatening autosomal recessive inborn error of metabolism that affects between 1/30,000-1/60,000 live births in the USA and worldwide (reviewed in (Fridovich-Keil and Walter 2008)). Most affected infants are born looking healthy but experience a rapid and devastating decline following exposure to breast milk or milk formula, which contain large quantities of galactose. Acute symptoms can progress in a matter of days from jaundice, vomiting, and diarrhea to failure to thrive, hepatomegaly, and E. coli sepsis. Without treatment, affected infants often die in the neonatal period (reviewed in (Fridovich-Keil and Walter 2008)).
With the advent of population newborn screening (NBS) for galactosemia in the early 1960s it became possible to identify affected newborns before they became critically ill, sometimes even before they were symptomatic. Unlike most newborn screens that quantify small molecules, NBS for galactosemia is based on a coupled assay quantifying the activity of an enzyme: galactose-1P uridylyltransferase (GALT) (Beutler and Baluda 1966). Many NBS labs also quantify “total galactose” (galactose + galactose-1P), which can be elevated in affected infants, especially if they have consumed milk.
Once identified by a positive NBS result, infants suspected of having galactosemia may be shifted from milk to a low-galactose soy or elemental formula until follow-up testing can be completed. For those infants ultimately diagnosed with classic galactosemia, the recommended intervention is continued and lifelong dietary restriction of galactose. For those infants who receive a normal follow-up testing result, the galactose restriction is lifted. However, interpreting NBS and follow-up testing results in the case of some infants can be difficult, because galactosemia is not a single or discrete condition; it is a family of disorders resulting from partial to profound loss of activity of any of the three enzymes of the Leloir pathway (Fig. 1). The biochemical NBS presentation and follow-up testing results of these different types of galactosemia can overlap, complicating diagnosis. Additionally, the clinical implications of forms other than classic galactosemia are often poorly understood, resulting in a lack of evidence-based standards of care once a diagnosis is reached. Identification of these individuals and recommendations for follow-up care vary by state and by practice of the individual infant’s healthcare provider.
Fig. 1.
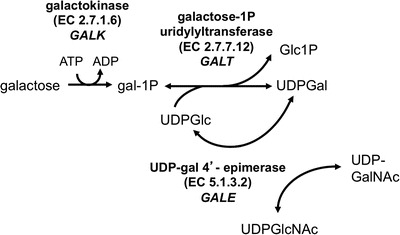
The Leloir Pathway of galactose metabolism. Classic galactosemia results from profound loss of galactose-1P uridylyltransferase (GALT); Duarte galactosemia results from partial loss of GALT. Profound loss of GALK leads to galactokinase deficiency galactosemia, and partial loss of GALE results in generalized, intermediate, or peripheral epimerase deficiency galactosemia depending on the degree of impairment and the tissues impacted
Classic and Duarte Galactosemia
Newborn screening for galactosemia was originally designed to detect classic galactosemia, the rare and potentially lethal condition resulting from profound to complete loss of activity of galactose-1P uridylyltransferase (GALT), the middle enzyme in the Leloir pathway (Fig. 1). Patients with classic galactosemia carry functionally severe (G) mutations in each of their GALT alleles, so that classic galactosemia is sometimes referred to as “GG” galactosemia. These mutations may be the same (molecular homozygote) or different (compound heterozygote). Blood spots from affected newborns show very low to absent GALT activity (Beutler and Baluda 1966) and elevated total galactose (Table 1), especially if the infant consumed milk before the NBS blood spot was collected. However, not all mutations in GALT are functional nulls; many are “hypomorphs,” mutations that leave some residual activity intact (e.g., (Riehman et al. 2001)). Indeed, one extremely mild variant called the Duarte (D or D2) allele is associated with about half of the normal level of GALT activity (Carney et al. 2009; Elsas et al. 2001; Greber et al. 1995; Levy et al. 1978; Mellman et al. 1968; Podskarbi et al. 1996; Tighe et al. 2004; Trbusek et al. 2001; Tyfield 2000). Worldwide, D2 alleles are found at an allele frequency of >11% in Europeans, less than 3% in Asians, and almost zero in Africans (http://hapmap.ncbi.nlm.nih.gov/).
Table 1.
Newborn screening results anticipated for different diagnostic categories of galactosemia
| Condition (gene) | Estimated prevalence (US) | NBS Results | Follow-up biochemical test results |
|---|---|---|---|
| Classic galactosemia (GALT) | ~1/50,000 live births (Suzuki et al. 2001) | GALT activity low to absent gal+gal-1P elevated |
Hemolysate GALT activity very low to absent Hemolysate gal-1P elevated (diet-dependent) Urinary galactitol may be elevated if the infant is consuming milk |
| Duarte variant galactosemia (GALT) | ~1/4,000 live births (Ficicioglu et al. 2008) | GALT activity low gal+gal-1P elevated |
Hemolysate GALT activity low Hemolysate gal-1P elevated (diet-dependent) Urinary galactitol may be elevated if the infant is consuming milk |
| Epimerase-deficiency galactosemia (GALE) | ~1/7,000 Afr-Amer ~1/70,000 Cauc (Alano et al. 1997) |
GALT activity normal gal+gal-1P elevateda |
Hemolysate GALE activity low in RBC Hemolysate GALT activity normal Hemolysate gal-1P elevated (diet-dependent) Urinary galactitol may be elevated if the infant is consuming milk |
| Kinase-deficiency galactosemia (GALK) | <1/100,000 live births in the US (reviewed in (Fridovich-Keil and Walter 2008)) | GALT activity normal gal+gal-1P elevateda |
Hemolysate GALK activity low to absent in RBC Hemolysate GALT activity normal Hemolysate galactose elevated (diet-dependent) but gal-1P NOT elevated Urinary galactitol may be elevated if the infant is consuming milk |
aOther conditions, independent of galactosemia, which compromise liver function or circulation can also lead to this NBS result
Duarte galactosemia (DG) results from compound heterozygosity for one functionally severe (G) GALT mutation together with a D2 allele. As explained previously (Ficicioglu et al. 2008), while classic galactosemia occurs with a prevalence of 1/40,000 to 1/60,000 infants, DG is identified in approximately 1/4,000 Caucasian infants, making DG approximately 10 times as common as classic galactosemia among US newborns. Fernhoff (2010) also confirmed this ratio, noting that of 405,000 newborns screened in a 3-year period in the state of Georgia, eight were identified with classic galactosemia and 83 were identified with DG.
The NBS results for DG infants can overlap those of classic galactosemics (Table 1). Follow-up testing results for most infants with Duarte galactosemia demonstrate close to 25% residual GALT activity, which is well above the level typically seen in classic galactosemia. However, this residual activity may be lost from the sample by exposure of the dried blood spot to heat or humidity during storage or transport before testing (Dobrowolski et al. 2003).
Epimerase- and Kinase-Deficiency Galactosemia
Abnormal NBS results can also occur in infants with epimerase-deficiency galactosemia (Fridovich-Keil et al. 2011), which results from partial impairment of UDP-galactose 4′ epimerase (GALE), or kinase-deficiency galactosemia, which results from profound loss of galactokinase (GALK) (Fig. 1, Table 1). GALE deficiency presents as a continuum disorder, both clinically and biochemically (Openo et al. 2006). The vast majority of patients identified with GALE deficiency in the USA are clinically mild to asymptomatic and demonstrate peripheral or intermediate GALE deficiency, with profound enzyme impairment restricted to the circulating red and white blood cells (reviewed in (Fridovich-Keil and Walter 2008)). Peripheral and intermediate GALE deficiencies together have been estimated to impact approximately 1/7,000 African-American and 1/70,000 Caucasian US newborns (Alano et al. 1997). Cases of generalized GALE deficiency, with profound enzyme impairment evident in all tissues tested, are extremely rare and present clinically with acute symptoms similar to those seen in classic galactosemia (Walter et al. 1999).
GALK-deficiency is considered clinically mild with the exception of neonatal cataracts that can be prevented by immediate dietary restriction of galactose. GALK deficiency is diagnosed in (<1/100,000) US newborns but may be more common in some populations (e.g., the Romani) (Hennermann et al. 2011; Janzen et al. 2011; Kalaydjieva et al. 1999; Sangiuolo et al. 2004).
Strengths and Challenges of NBS for Galactosemia
As a screening tool for classic galactosemia, current NBS protocols are highly effective. Principal challenges stem from high false positive rates, defined here as the number of infants identified by NBS each year who require follow-up testing but ultimately are determined not to have classic or Duarte galactosemia. A small number of these infants may turn out to have variant forms of galactosemia (e.g., kinase or epimerase-deficiency) and some are carriers (GN or DN) or Duarte homozygotes (DD); others may have no recognized cause for GALT deficiency. In the majority of cases, high false positive rates necessitate clinic visits for what can be large numbers of ostensibly healthy infants each year, and for many of these infants the positive galactosemia NBS result imposes what can be an extended interruption of breastfeeding while the family awaits the follow-up test result.
Challenges associated with NBS and follow-up testing for galactosemia also stem from differences of opinion among healthcare professionals and policymakers regarding which forms of galactosemia newborn screening should be tailored to identify; most notably with regard to DG. Of course, the answer to this question also feeds back to the false positive rate, because testing schemes designed to identify infants with 25% residual GALT activity may have a higher likelihood of also picking up galactosemia carriers (GN), who represent almost 1% of the US population. False positives due to other causes may also increase when the NBS GALT cutoff level is raised.
Here we describe the results of a comparative review of state NBS programs in the US queried with regard to their historical and current approaches to galactosemia newborn screening and follow-up testing. The findings of this study document the successes and lessons learned from NBS for galactosemia in the past 50 years, but also highlight areas where there is room for improvement (Wilcken 2013) in the years to come.
Methods
Though most of the data collected for this study were either publicly available or did not involve any Protected Health Information because they concerned populations and not individuals, those aspects of the study that required a HIPAA waiver were conducted with approval of the Emory Institutional Review Board (Emory IRB# 00024933) and also the Georgia Department of Public Health Institutional Review Board (Georgia DPH IRB#130306), PI: JL Fridovich-Keil.
Publicly Available Data
Information concerning when each state initiated NBS testing for galactosemia and the total numbers of newborns screened per state were collected from publicly available sources (e.g., the Centers for Disease Control and Prevention’s National Vital Statistics Reports (http://www.cdc.gov/nchs/products/nvsr.htm) and the National Newborn Screening Information System (http://nnsis.uthscsa.edu).
Data from Newborn Screening Programs and Follow-up Centers
We attempted to reach all 51 NBS programs in the USA (all 50 states plus Washington DC) by email and/or telephone using names and contact information listed at the National Newborn Screening Information System (http://nnsis.uthscsa.edu). We asked each program for information concerning their approach to galactosemia screening and follow-up testing for as many years back as the data were available. We also asked for information concerning total numbers of newborns screened, total positive NBS test results for galactosemia reported each year, and how those total numbers translated into cases of classic or Duarte galactosemia, or false positives. Where possible, we also asked for information concerning detection rates by gender and racial group.
Some programs responded and generously shared their aggregate data with us, though not every respondent program was able to share data relevant to every question posed. Some programs responded, but explained that they were short-staffed and simply could not spare the time to assemble the requested information. Finally, some programs never responded despite repeated contact attempts. The data presented here concerning detection rates for different diagnostic categories of galactosemia were derived from those programs that provided data to us, in some cases supplemented by data we found published online (e.g., for Arizona, Arkansas, Indiana, New Jersey). Whenever possible, detection rates were calculated using the actual number of newborns screened in a given state and year, but when those numbers were not available, we substituted available data giving the total number of births, rather than the total number of screens. In these instances, the detection rates we calculated should be considered slight underestimates assuming there were at least some newborns in those states who were not screened. Other inaccuracies in our estimates may stem from instances where an infant was born in one state but for some reason transferred to and screened in another state. The 39 states from which we either received NBS data or for which we were able to find publicly available NBS data are listed in Supplementary Table 1.
GALT Activity, gal-1P Values, and GALT Genotypes Determined on Follow-up Testing by the Emory Genetics Lab
Samples from infants less than 1 month old that were sent to the Emory Genetics Lab (EGL, http://genetics.emory.edu/egl/) between 2008 and 2012 for galactosemia testing were accessed from the EGL MEDGIS (Medical Genetics Information System) via a HIPAA waiver granted by the Emory University Institutional Review Board (Emory IRB# 00024933). Data used for the preparation of Figs. 3, 4, and 5, and Supplementary Table 5 were limited to samples from infants <1 month old who had GALT activity measured, and in most cases also gal-1P level, and GALT genotyping performed. Of note, these samples derived from many states, not just Georgia. GALT genotyping at EGL during the time period 2008–2012 was conducted by testing DNA samples for the presence or absence of a panel of specific known mutations or variations, including: S135L (c.404C>T), T138M (c.413C>T), Q188R (c.563A>G), L195P (c.584T>C), Y209C (c.626A>G), L218L (c.652C>T), K285N (c.855G>T), N314D (c.940A>G), c.-119_-116del, IVS2-2A>G, and the 5.5 kb deletion (c.[-1041_751del;820+50_*790delinsGAATAGACCCCA]) (Coffee et al. 2006). Samples from patients with biochemical findings consistent with the presence of a G allele that did not test positive for a recognized deleterious GALT mutation from this panel were said to carry an “unknown” G mutation.
Fig. 3.
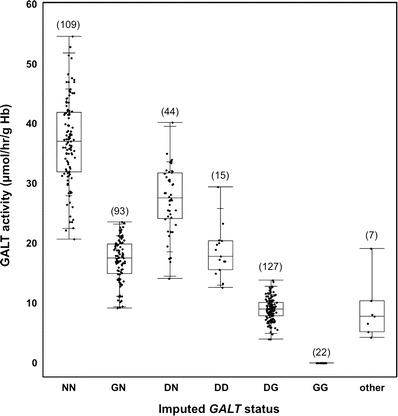
GALT activity levels detected in hemolysates from infants in different diagnostic categories for galactosemia. GALT activity levels determined as part of follow-up testing at the Emory Genetics Lab (EGL) were ascertained via a HIPAA waiver and presented as box-and-whisker plots by diagnostic group. The upper, middle, and lower boundaries of each box indicate the 25th, 50th, and 75th percentiles of the data set, respectively; the whiskers indicate the full range of the data, and the cross hatches in the upper and lower whiskers indicate the 90th and 10th percentiles of the data set, respectively. The number of points in each data set is indicated in parentheses above the box
Fig. 4.
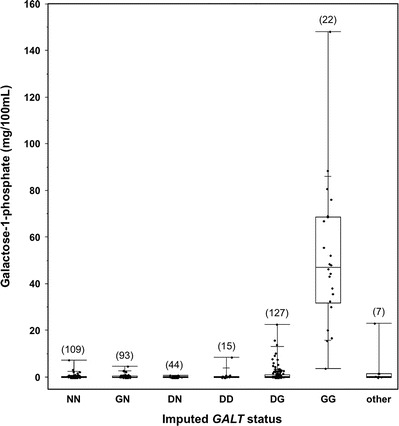
Gal-1P levels detected in hemolysates from infants in different diagnostic categories for galactosemia. Gal-1P levels determined as part of follow-up testing at the Emory Genetics Lab (EGL) were ascertained via a HIPAA waiver and presented as box-and-whisker plots by diagnostic group. The lower, middle, and upper boundaries of each box indicate the 25th, 50th, and 75th percentiles of the data set, respectively; the whiskers indicate the full range of the data, and the cross hatches in the upper and lower whiskers indicate the 90th and 10th percentiles of the data set, respectively. The number of points in each data set is indicated in parentheses above the box
Fig. 5.
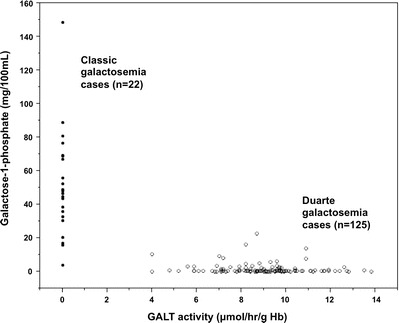
Relationship between Gal-1P and GALT activity levels detected on follow-up testing of hemolysates from infants with classic or Duarte galactosemia. GALT activity and Gal-1P levels determined as part of follow-up testing at the Emory Genetics Lab (EGL) were ascertained via a HIPAA waiver and presented as “scatter plots.” The highest gal-1P levels were all found in infants with undetectable GALT activity, but there was also considerable scatter in both diagnostic groups
Data Analysis and Presentation
In some tables actual numbers of cases identified with classic or Duarte galactosemia are presented (Table 3 and Supplementary Table 3), while in other tables (Supplementary Table 4) detection rates per 100,000 newborns screened are presented.
Table 3.
Lowering the NBS GALT cutoff level in Utah lowered the false positive rate and lowered the number of infants detected with Duarte galactosemia, but not the number of infants detected with classic galactosemia
| Year | Total resident births | Cases of classic galactosemia detected | Cases of Duarte galactosemia detected | False positivesa detected | NBS GALT cutoff (U/gHb) |
|---|---|---|---|---|---|
| 2011 | 51,223 | 1 | 1 | 4 | 3.0 |
| 2010 | 52,164 | 1 | 5 | 7 | 3.0 |
| 2009 | 53,849 | 1 | 21 | 44 | 3.5 |
| 2008 | 55,605 | 1 | 16 | 72 | 3.5 |
| 2007 | 55,063 | 2 | 12 | 49 | 3.5 |
| 2006 | 53,448 | 0 | 16 | 48 | 3.5 |
| 2005 | 51,517 | 3 | 26 | 58 | 3.5 |
Note: These are raw numbers and not scaled per 100,000 births
aFalse positives were defined as total NBS cases reported as abnormal for galactosemia minus the numbers of cases diagnosed with classic or Duarte galactosemia. False positives may include carriers and other genotypes that have lowered GALT activity but are not considered clinically affected
The data graphed in Supplementary Fig. 1a were calculated for each year between 1963 and 2004 by multiplying the average number of annual births for each state screening for galactosemia at that time and calculating what percentage of the total US births were in that group. These values are estimates as we did not have state newborn population numbers for all states reaching back to 1963 and so calculated proportions using birth numbers from the available years.
The data illustrated in Fig. 2 are presented as “box and whisker” plots in which the top and bottom of each box indicate the 75th and 25th percentiles, respectively, the midline in each box presents the median (50th percentile), and the whiskers indicate the full range of the data points. The number of years of data included in the analysis for each box and whisker plot is indicated in parentheses above the box. Box and whisker plots are also presented in Figs. 4 and 5, with added hatch marks on the top and bottom whiskers indicating the 90th and 10th percentiles, respectively.
Fig. 2.
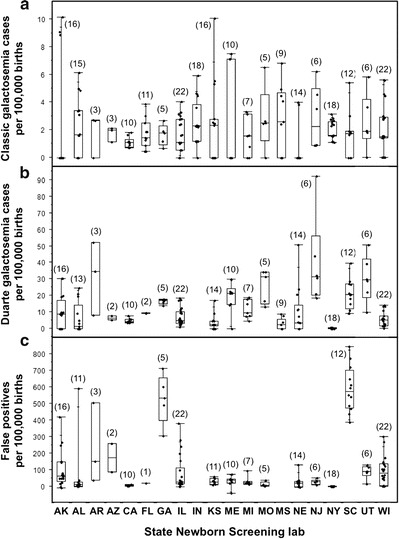
Classic, Duarte, and false positive rates from galactosemia newborn screening in respondent states. (a) Detection rates for classic galactosemia per 100,000 newborns screened. (b) Detection rates for Duarte galactosemia per 100,000 newborns screened. We were not able to calculate a DG detection rate for Indiana. (c) False positive rates defined as the total number of positive galactosemia screening results minus the numbers of cases diagnosed with classic, variant, or Duarte galactosemia. We were not able to calculate false positive rates for Indiana or Mississippi. The number of years of data included in the analysis for each box and whisker plot is indicated in parentheses above the box. For each plot the lower, middle, and upper boundaries of the box represent the 25th, 50th, and 75th percentiles for the data set, respectively, and the whiskers indicate the full range of the data. The 25th, 50th, and 75th percentile limits for each population plotted in Fig. 2 are also presented in Supplementary Table 2
Results
Toward Universal Newborn Screening for Galactosemia in the USA
To determine what fraction of newborns in the USA were screened for galactosemia in the early years of NBS, we gathered and analyzed historical data from the National Newborn Screening Information System (http://nnsis.uthscsa.edu). From 1963, when the first NBS for galactosemia was conducted, until 2004, when the last state added galactosemia to their NBS panel, there was a slow, steady rise in both percentage of US newborns screened (Supplementary Fig. 1a) and the number of programs doing the screening (Supplementary Fig. 1b). By 2004, essentially all infants born in the USA were screened for galactosemia through the combined efforts of 51 NBS programs. Thanks to these programs and their associated follow-up testing centers, each year an estimated >80 newborns affected with classic galactosemia were identified and diagnosed, and for most of these infants the potentially lethal sequelae of their disease were prevented by early intervention.
Detection Methods and Rates
To compare the detection methods used for galactosemia newborn screening, we compiled responses from 19 state programs (Table 2). We also compared NBS detection rates for classic and Duarte galactosemia and false positive rates reported for these and other programs for which the data were available (Fig. 2). Of note, while not all data were available from every program, enough programs provided information about both their detection methods and detection rates to reveal patterns.
Table 2.
Newborn screening testing strategies of respondent state labs
| State | Testing method | GALT cutoff (trigger for further action) | Total galactose cutoff (trigger for further action) |
|---|---|---|---|
| Alabama (AL) | Perkin Elmer | <2.7 U/dL | Not tested |
| Colorado (CO) | Perkin Elmer | <2.5 U/dL | Not tested |
| Delaware (DE) | Perkin Elmer | <2.4 U/gHb | >10 mg/dL |
| Florida (FL) | Perkin Elmer | <3.5 U/dL | Not tested |
| Georgia (GA) | Astoria Pacific | <60 μM NADPHa | >11 mg/dL; only tested if GALT low |
| Illinois (IL) | Not specified | Partial/no activity | >6.5 mg/dL |
| Kansas (KS) | Qualitative | Partial/no activity | Not specified |
| Louisiana (LA) | Perkin Elmer | <4.3 U/dL | Not tested |
| Michigan (MI) | Perkin Elmer | ≤3.1 U/gHb (changed to ≤3.6 U/gHb in 2012) | Only tested if GALT low; not used to define a sample as abnormal |
| Mississippi (MS) | Astoria Pacific | <40 μM NADPHa | >15.0 mg/dL |
| Missouri (MO) | Perkin Elmer | <3.0 U/gHb | Not tested |
| Nebraska (NE) | Astoria Pacific | <40 μM NADPHa | >15 mg/dL |
| New York (NY) | Qualitative | Partial/no activity | Not specified; tested only in samples with reduced or absent GALT |
| Ohio (OH) | Astoria Pacific | ≤1.7 U/gHb (confirmatory testing if ≤2 U/gHb) | ≥10 mg/dL; Only tested if GALT ≤2 U/gHb) |
| South Carolina (SC) | Astoria Pacific | <60 μM NADPHa | All samples tested; cutoff not specified |
| Tennessee (TN) | Astoria Pacific | <40 μM NADPHa | >15 mg/dL |
| Utah (UT) | Perkin Elmer | <3.0 U/gHb | Not tested |
| West Virginia (WV) | Astoria Pacific | <50 μM NADPHa | >10 mg/dL |
| Wisconsin (WI) | Perkin Elmer | <3.0 U/gHb | > 6.0 mg/dL |
Note: Testing strategies used by specific labs may change over time; these are the responses received at the time requested (2011–2012)
aGALT activity was measured using a coupled assay that produced NADPH so that μM NADPH produced in a given period of time corresponded to a given level of GALT activity in the sample (Freer et al. 2010))
The screening approaches for all respondent programs included an assay for GALT activity (Table 2) though the cutoffs applied to distinguish normal from abnormal results varied. Some states also measured total galactose (galactose + galactose-1-phosphate); however, some measured total galactose in all samples (e.g., SC) while others measured total galactose only in samples already flagged by a borderline, low, or absent GALT activity level (e.g., GA, MI, NY, OH). Further, not every state that measured total galactose used that information in the decision of whether or not to flag a sample as abnormal for galactosemia, and some states also had a special approach to NBS if the baby had been transfused prior to sample collection.
Prevalence and Detection of Classic Galactosemia
When comparing detection rates among respondent NBS programs for classic galactosemia, it was clear that all identified affected infants at close to the anticipated 2/100,000 births (Fig. 2a, Supplementary Table 2) (Suzuki et al. 2001). The variance and scatter evident among states, and within states over time, presumably reflect statistics of small numbers, especially for the less populous states (e.g., AK, KS, NE). Differences in screening approach, the definition of each diagnostic category, and ancestry of the populations screened might also have contributed to the differences observed.
Comparing Table 2 with Fig. 2a, it is worth noting that programs that used both GALT activity and total galactose level in their definition of an abnormal NBS result (GA, IL, KS, MS, NE, NY, SC, and WI) showed the same median detection rate for classic galactosemia (1.67 per 100,000 newborns screened) as states that based their definition solely on GALT activity (e.g., AL, FL, MI, MO, and UT). Further, states that had a higher GALT cutoff level (e.g., FL) did not show a higher detection rate for classic galactosemia than states with a lower cutoff level (e.g. AL). These results suggest that there are very few, if any, infants with classic galactosemia who slip through the US newborn screening net undetected regardless of where in the country they are born.
Prevalence and Detection of Duarte Galactosemia
In contrast to classic galactosemia, median detection rates for Duarte galactosemia (DG) varied from essentially zero (e.g., NY) to more than 1/3,500 (30/100,000) newborns screened (e.g., AR and NJ, Fig. 2b, Supplementary Table 2) suggesting that many DG infants go undetected by NBS in some states. For example, Georgia detected close to 20 DG cases per 100,000 newborns screened, while Mississippi detected a median of fewer than 5. This difference likely reflects, at least in part, the differing GALT cutoff levels used by the two states: in Georgia a sample showing <60 μM (NADPH) (Freer et al. 2010) GALT activity was defined as abnormal, whereas in Mississippi a sample needed to show <40 μM (NADPH) GALT activity to be declared abnormal (Table 2).
Comparing Table 2 with Fig. 2b, it is interesting to note that programs that used both GALT activity and total galactose level in their definition of an abnormal NBS result (GA, IL, KS, MS, NE, NY, SC, and WI) collectively showed a lower median detection rate for Duarte galactosemia (4.37 per 100,000 newborns screened) than states that used only GALT activity (9.7 per 100,000 newborns screened; AL, FL, MI, MO, and UT). Whether or not this difference is meaningful, including total galactose in the definition of an NBS positive result clearly did not increase the detection rate for DG, and may have decreased it.
False Positives
The number of false positives, defined here as the total number of NBS galactosemia positives minus the numbers of infants diagnosed with classic or Duarte galactosemia, also differed strikingly from state to state, and in some states from year to year (Fig. 2c, Supplementary Table 2). Some of these “false positive” infants likely were carriers (GN or DN) or Duarte homozygotes (DD) or had a variant form of galactosemia (e.g., kinase or epimerase-deficiency); however, in many cases these infants had no recognized cause for GALT deficiency.
Notably, false positive rates did not always go hand-in-hand with DG detection rates. For example, New Jersey reported a high DG detection rate but a moderate to low false positive rate (Fig. 2b, c), while both Georgia and South Carolina reported moderate DG detection rates but strikingly high false positive rates. The way states defined a positive result may also have contributed to these differences.
Comparing Table 2 with Fig. 2c, it is interesting to note that programs that used both GALT activity and total galactose level in their definition of an abnormal galactosemia NBS result (GA, IL, KS, NE, NY, SC, and WI) collectively showed a higher median false positive rate for galactosemia NBS (30.26 per 100,000 newborns screened) than did states that used only GALT activity (20.47 per 100,000 newborns screened; AL, FL, MI, MO, and UT). This difference might reflect the prevalence of infants with any of the multitude of causes of elevated total galactose in a newborn other than classic or Duarte galactosemia (Ono et al. 1999; Ono et al. 2000; Raffel et al. 1993). It is also important to note that for the purposes of this study we classified states according to their current NBS approach at the time we collected the data. At least some of the states that currently do versus do not test total galactose as part of their galactosemia NBS protocol may have changed their approach during the time frame of the data shared with us.
Impact of the GALT Cutoff Level
Perhaps the clearest illustration of the relationship among NBS GALT cutoff level, DG detection rate, and false positive rate can be seen from the longitudinal records of a single NBS program compared across a time period when the cutoff level was changed. The Utah NBS program underwent such a change in 2010 and was kind enough to share their detection rate data with us. As presented in Table 3, the number of infants with classic galactosemia detected each year in Utah remained essentially unchanged, between 0 and 3, regardless of whether the NBS GALT cutoff level was 3.5 U/gHb (2005–2009) or 3.0 U/gHb (2010–2011). However, the number of infants detected with Duarte galactosemia changed dramatically, from 12 to 26 per year when the cutoff was 3.5 U/gHb down to 1–5 per year when the cutoff was 3.0 U/gHb. The number of false positives identified annually during this time period changed even more dramatically, from 44 to 72 when the GALT cutoff was 3.5 U/gHb down to 4–7 when the GALT cutoff was 3.0 U/gHb. This was the desired result, since Utah does not recommend dietary intervention for infants with Duarte galactosemia. Streamlining the NBS approach to prevent their detection, and therefore lower the false positive rate, made sense in Utah. A similar experience was reported for newborn screening in Sweden (Ohlsson et al. 2012).
Roles of Gender and Race in Galactosemia NBS Detection
Classic and Duarte galactosemia both result from mutations in the GALT gene encoded on chromosome 9 (Leslie et al. 1992) explaining why these conditions are inherited as autosomal recessive traits. Nonetheless, even autosomal or complex traits can show gender bias in expressivity or prevalence in a population (Gethins 2012; Mohamad and Apffelstaedt 2008).
To test whether either classic or Duarte galactosemia showed any gender bias in detection by NBS we assessed available historical data from eight programs: AL, IL, MI, MO, MS, NY, SC, and WI (Supplementary Table 3). The detection rates from some programs showed an apparent bias; for example, Alabama detected twice the number of DG girls (34) as boys (17) from 2006 to 2011. However, when the totals from all eight states were combined it was clear there was no overall gender bias. Of note, while these numbers are informative for gender ratio in the patient population, they should not be used to estimate the relative proportion of newborns diagnosed with classic vs. Duarte galactosemia because they include data from states (e.g., NY) that do not screen for DG.
In contrast to gender, assessing prevalence by race did show some clear differences. For example, while the eight state programs listed in Supplementary Table 4 detected classic galactosemia in an average of 1.7 ± 0.67 per 100,000 “White” or “Caucasian” newborns screened and 1.99 ± 1.55 per 100,000 “Black” or “African-American” newborns screened, the average detection rate among infants identified as “Asian/Pacific Islander” was only 0.18 ± 0.36 per 100,000. Although most respondent states providing data with regard to race did not list “Hispanic” among their categories, New York did, revealing a detection rate of 2.4 per 100,000 newborns screened for this group.
In most states, detection rates for Duarte galactosemia exceeded detection rates for classic galactosemia, and again, there was some apparent influence of race. For example, Duarte galactosemia was detected at an average rate of 14.5 ± 10.65 per 100,000 white newborns screened (excluding NY, which detected almost no DG infants), but the average detection rate was only 3.84 ± 4.82 per 100,000 African-American newborns screened (again excluding NY). The scatter in these numbers was substantial, but in every state the prevalence of Duarte galactosemia detected in white infants exceeded that in African-American infants. This pattern is notably different from the indistinguishable detection rates for classic galactosemia observed for these groups and likely reflects the lower D2 allele frequency among populations of African ancestry (http://hapmap.ncbi.nlm.nih.gov/). As with classic galactosemia, Duarte galactosemia was also strikingly rare among infants categorized as Asian/Pacific Islander in all but three states. For reasons that remain unclear, DG was detected at a high rate among Asian/Pacific Islanders in Missouri, and to a lesser extent in Illinois and Michigan.
Biochemical Complexity
The level of GALT enzyme activity detected in hemolysate is an essential component of follow-up testing for classic or Duarte galactosemia in all states. To explore the range of GALT activity levels detected in hemolysate samples from infants in different diagnostic categories, we reviewed GALT activity data from 2008 to 2012 reported by the Emory Genetics Lab (EGL), which performs follow-up testing for Georgia newborn screening as well as samples from many other sources. In a collection of 417 GALT activity test results identified via a HIPAA waiver, the 22 designated as classic galactosemic (GG) demonstrated no GALT activity (Fig. 3, median 0 μmol/h/g Hb), and all others demonstrated at least some GALT activity. The samples designated normal (NN; two normal GALT alleles) had the highest median activity (37 μmol/h/g Hb), followed by DN (one Duarte allele and one normal allele, 27.6 μmol/h/g Hb), then DD (two Duarte alleles, 17.8 μmol/h/g Hb), GN (one classic allele and one normal, 17.5 μmol/h/g Hb), then DG (one Duarte allele and one classic, 9 μmol/h/g Hb), and finally “other” (two unknown alleles; 7.8 μmol/h/g Hb). Notably, there was substantial overlap in the GALT activity levels observed for individual samples in many of the diagnostic categories (Fig. 3), illustrating the difficulty of making a definitive diagnosis based on GALT activity alone.
Because of this complexity, many programs in the USA also measure hemolysate galactose-1-phosphate (gal-1P) as a secondary indicator of diagnostic status. Figure 4 presents the gal-1P values reported by EGL for 413 samples in the indicated diagnostic categories. As illustrated, while there was some overlap of gal-1P values in almost all categories, the majority of samples in all groups, except GG, had low to undetectable gal-1P, while the majority of samples in the GG category had elevated gal-1P. Many samples from infants with DG also had elevated gal-1P, but the median DG gal-1P level (0.4 mg/100 mL) was substantially lower than the median GG gal-1P level (47.3 mg/100 mL).
To further explore the possible relationship between GALT activity and gal-1P values in hemolysate samples from infants with classic and Duarte galactosemia we plotted one as a function of the other. As illustrated (Fig. 5), while higher gal-1P values were found in samples with undetectable GALT activity and lower gal-1P values were found in samples with high GALT activity, there was also scatter along both axes.
GALT Genotyping Helps to Resolve Some But Not All Diagnostic Mysteries
To explore the impact of genotyping on NBS follow-up testing, we tabulated the results of GALT genotyping conducted at the Emory Genetics Lab from 2008 to 2012 on samples from infants who were less than 1 month old and diagnosed as having classic (GG, 22 infants) or Duarte galactosemia (DG, 127 infants), or who were determined to be galactosemia carriers (GN, 93 infants). Of note, these samples were not all derived from infants born in the same state so they cannot be used to assess the relative prevalence of GG, DG, or GN in a population. As explained in Methods, each sample was tested for the presence or absence of a panel of recognized causal mutations and other variants. Except for the addition of direct testing for the c.-119_-116del non-coding change associated with D2, the panel of mutations screened remained constant during this time frame. Patient GALT alleles that did not carry any of the recognized mutations in the panel but that could be inferred from biochemical results to be functionally impaired were designated “unknown.”
Genotyping results for 22 neonates with classic galactosemia (Supplementary Table 5, upper section) revealed two recognized GALT mutations in 16, effectively confirming the diagnosis for these infants. Three other infants each had one GALT allele inferred as “unknown,” and another three had both GALT alleles inferred as “unknown.” For these six infants, genotyping did not confirm the diagnosis of classic galactosemia. In terms of specific GALT alleles in this group, 26/44 (59%) identified were Q188R, 5/44 (11%) were S135L, and 8/44 (18%) were unknown. A handful of other known mutations accounted for the remaining 12%.
Genotyping results for 127 neonates with Duarte galactosemia (Supplementary Table 5, middle section) showed that the D2 allele was present in all, and individual recognized G mutations were also identified in 102, confirming the diagnosis in 80% of the infants. Of note, in one DG infant the presumed G mutation presented on a D2 background; the variants characteristic of D2 were homozygous in that sample. This observation stands as a clear reminder that the presence of D2 markers on a GALT allele does not indicate absence of a G mutation. In terms of specific G alleles identified in the DG infants, 83/127 (65%) were Q188R, 5/127 (4%) were S135L, and 25/127 (20%) were unknown. A handful of other known mutations accounted for the remaining 11%. It is interesting to note that while Q188R was as well represented in this group as among the classic galactosemics, S135L was not. This presumably reflects the African origins of the S135L mutation (Suzuki et al. 2001). Because D2 is particularly rare in African populations (http://hapmap.ncbi.nlm.nih.gov/) ascertaining infants with Duarte galactosemia presumably skewed the G allele frequencies away from S135L.
Finally, GALT genotyping results for 93 neonates determined to be GN carriers (Supplementary Table 5, lower section) uncovered single recognized G mutations in 79, confirming those diagnoses but leaving 14 (15%) as “unknown.” Absent molecular confirmation it might be difficult to distinguish a “high activity” GN from a “low activity” NN (see Fig. 3). In terms of specific G mutations identified among carriers, 47/93 were Q188R (51%) and 19 were S135L (20%), reminiscent of the allele frequencies seen among GGs.
Recommendations for Intervention
All NBS program and follow-up care providers consulted for this study agreed that immediate and lifelong dietary restriction of galactose is required for patients with classic galactosemia, but the recommendations were mixed for Duarte galactosemia. Of the 28 states that responded to our inquiries on this point, five (18%) said they do not recommend any intervention for infants with Duarte galactosemia. Six (21%) said they do not intervene if the infant is to be breastfed, but if the infant is to drink formula they recommend soy. The rationale for this approach is the belief that the benefits of breastfeeding outweigh the potential risks of milk, but the potential benefits of milk-based formula over soy formula do not. Ten states (36%) said different specialists in their state give different recommendations for intervention in DG, and seven (25%) said they recommend at least partial milk restriction for the first year of life for all DG infants in their state (Supplementary Table 6). Combined, 82% of states said that at least some of the DG infants diagnosed in their state experience at least partial galactose restriction in the first year of life.
Discussion
We initiated this study with two goals in mind: (1) to compare ongoing practices across the USA with regard to newborn screening and follow-up testing for galactosemia to see how uniform or disparate those practices were, and if possible to see if some practices were more effective or more efficient than others and (2) to characterize the landscape of opinion and practice about screening, diagnosis, and intervention for Duarte galactosemia.
From Screen to Diagnosis
Our study revealed a broad range of practices with regard to newborn screening and follow-up testing for galactosemia that, despite their differences, were all clearly effective at identifying newborns with classic galactosemia (Table 2 and Fig. 2a). The programs differed in their response to finding a result outside their normal range, some erring on the side of certainty, and others erring on the side of speed. Most programs sought to balance both goals by having “panic” thresholds: GALT or total galactose values that would trigger an immediate call to the referring pediatrician or metabolic clinic, and “borderline” cutoffs that would trigger either a re-screen or a follow-up test, but not necessarily an immediate call to a clinician (Berry 2012). The median detection rate for classic galactosemia among states that did not use total galactose in their definition of an abnormal NBS result was indistinguishable from the median detection rate in states that did use total galactose (1.674 vs. 1.666 per 100,000 newborns screened, respectively). If the singular goal of galactosemia NBS is detecting classic galactosemia, these data imply that including total galactose in addition to GALT activity to flag a sample as abnormal does not add value. Of course, if the goal of NBS includes detecting epimerase (GALE) or kinase (GALK)-deficiency galactosemia (reviewed in (Fridovich-Keil and Walter 2008)), testing for elevated total galactose in all samples is essential.
Follow-up testing for infants who received a positive NBS result for galactosemia involved a quantitative red blood cell GALT enzyme assay in all respondent programs in our study, and for many also a quantitative measurement of red blood cell gal-1P. It is important to note that while there was a relationship apparent among GALT activity, gal-1P, and diagnostic category assigned for infants referred for follow-up testing for galactosemia, in the data available to us there was still substantial overlap among diagnostic categories (Figs. 3, 4, and 5). Some follow-up testing programs also included GALT genotyping as part of their diagnostic panel for galactosemia, which clarified the diagnosis in some but not all cases.
The broad range of GALT activities observed upon follow-up testing within all diagnostic categories, except classic galactosemia, likely reflects the combined effects of biological variation and testing differences. This includes the reality that not all samples were tested immediately, and conditions during transport and sample storage may have varied widely. As a testament to these complicating factors, even repeat GALT activity tests from the same child assayed in the same program showed considerable variability (Table 4).
Table 4.
Replicate GALT activity assays performed at the Emory Genetics Laboratory between 2005 and 2011
| Patient | GALT activity (μmol/h/g Hb) | Years elapsed between 1st and 2nd measurement | |
|---|---|---|---|
| 1st measurement | 2nd measurement | ||
| 1 | 17.9 | 11.0 | 1.4 |
| 2 | 9.2 | 7.9 | 1.0 |
| 3 | 8.0 | 8.8 | 0.7 |
| 4 | 5.8 | 6.2 | 0.4 |
| 5 | 7.3 | 5.8 | 0.3 |
| 6 | 4.4 | 7.1 | 0.1 |
| 7 | 10.1 | 13.8 | 0.1 |
| 8 | 8.7 | 5.7 | 0.1 |
| 9 | 7.3 | 4.9 | 0.0 |
| 10 | 8.4 | 8.4 | 0.0 |
Hemolysate galactose-1P levels measured on follow-up testing (Fig. 4) were low in infants from all diagnostic categories except Duarte and classic galactosemia, where they ranged from low to quite high, especially in classic galactosemia. As has been well documented previously (reviewed in (Fridovich-Keil and Walter 2008)), dietary galactose exposure is a major determinant of gal-1P level for this group, likely explaining a substantial portion of the spread observed (Figs. 4 and 5) and also illustrating the limited utility of gal-1P measurement as a diagnostic tool when reliable dietary information may not be available.
What to Do About Duarte galactosemia?
One of the most difficult and contentious issues currently facing galactosemia newborn screening is what to do about Duarte galactosemia (Fernhoff 2010). Prior reports state that Duarte galactosemia is identified at least 10 times as frequently as classic galactosemia in some US populations (Ficicioglu et al. 2008), and the data reported here corroborate that prevalence (Fig. 2 and Supplementary Table 2). However, there is still no consensus on whether children with Duarte galactosemia are at increased risk for long-term developmental disabilities (Fernhoff 2010).
A study by Ficicioglu and colleagues testing developmental outcomes in 28 children with DG, including both children who had and children who had not consumed lactose in early childhood, found no evidence of developmental delay in either group (Ficicioglu et al. 2008), but the mean age in both groups was less than 4 years. In contrast, Powell and colleagues noted that children with DG were significantly overrepresented in a cohort of students receiving special educational resources in elementary school (Powell et al. 2009). Whether these apparently contradictory results reflect artifacts or statistics of small numbers in one or both studies, or whether they indicate that DG children are at increased risk of some developmental difficulties in mid- but not early childhood remains unclear. There is also no consensus on whether dietary restriction of galactose in the first year of life, the intervention recommended by some care providers, offers any long-term outcome benefit for children with DG.
As a result of this uncertainty some states seek to identify infants with Duarte galactosemia by NBS while others do not (van Calcar and Bernstein 2011) (Fig. 2b). Considering the prevalence of DG (estimated at close to 1/4,000 Caucasian newborns screened (Ficicioglu et al. 2008)), this uncertainty affects a large number of infants and families, and diagnosis and follow-up care for these infants adds considerably to the combined cost of NBS. Interrupting breastfeeding of infants who may not be at increased risk of negative consequences from milk exposure is also problematic and raises an ethical dilemma for both caregivers and families. Designing the NBS screen to detect infants with DG also raises the false positive rate, at least in some states (Table 3), which again adds to both the financial burden and the human cost.
A large case–control study comparing diet and long-term developmental outcomes between school age DG children with and without dietary galactose restriction in the first year of life could help resolve this uncertainty. Such a study would address whether children with DG as a group are more likely than controls to experience developmental disabilities and could also reveal whether dietary restriction of galactose in the first year of life results in more favorable long-term outcomes. Resolving this issue would empower NBS programs, healthcare providers, and the families they serve to make evidence-based decisions that would maximize public health interests and also ensure DG children the best possible long-term outcomes.
The Challenge of False Positives
False positives are a reality of any large screening protocol, and considering the potentially lethal consequence of a false negative in classic galactosemia, there is no question that NBS screening protocols should err on the side of false positives. However, false positives for galactosemia carry a significant human cost beyond the worry they cause new parents, because these infants are advised to switch from breastfeeding to soy or elemental formula until follow-up testing can be completed, which may take two to three weeks or more (Gurian et al. 2006). While studies have yet to report the success rates of mothers who attempt to resume breastfeeding following an NBS false-positive-imposed breastfeeding interruption, it is reasonable to assume these women may face a substantial challenge. As presented in Fig. 2c and Supplementary Table 2, median false positive rates among states that shared their NBS data with us varied from 1 to 2 to >500 per 100,000 newborns screened.
Tailoring NBS protocols for galactosemia to maximize identification of infants who will benefit from diagnosis and early intervention and minimize identification of infants who would be better left alone is therefore an issue of substantial urgency, especially in the current climate of limited healthcare dollars. Recognizing the shared successes of galactosemia NBS across the USA is clearly warranted, and learning from the combined experiences of these programs offers a first step toward raising the bar even higher.
Electronic Supplementary Material
Supplemental Figure 1 1-31-14 (ZIP 77 kb)
Tables REVISED 1-31-14 Clean Copy (DOCX 36.5 kb)
Acknowledgments
This project would have been impossible without the help of many, many people who donated their time and shared information about their program’s newborn screening and follow-up testing experiences for galactosemia. We especially thank: Alicia Roberts and Danita Rollin (Alabama); Thalia Wood (Alaska); Hao Tang (California); Dan Wright and Erica Wright (Colorado); Patricia Scott and Louis Bartoshesky (Delaware); Lois Taylor, Bonifacio Dy, Charlie Williams, Penny Edwards, Lindsay Raub, and Helen McCune (Florida); Arthur Hagar, Angela Wittenauer, Luke Fiedorowicz, Kelli Rayford, and Johanna Pringle (Georgia); Tracey Kreipe (Illinois); Bryan Hainline (Indiana); Judy Miller (Iowa); Jamey Kendall and Julie Wellner (Kansas); Terry Crockett (Louisiana), Elizabeth Plummer and Eleanor Mulcahy (Maine); Carol Greene (Maryland); Karen Andruszewski, Harry Hawkins, Peggy Rush, and William Young (Michigan); Philis Hoggatt, Robert Wise, and Suzie Boyer (Mississippi); Jami Kiesling and Darla Aiken (Missouri); Sib Clack and Samuel Yang (Montana); Julie Luedtke and William Rizzo (Nebraska); Debbie Rodriguez and Joan Pellegrino (New York); Surekha Pendyal and Lara Percenti (North Carolina); Rosemary Hage (Ohio); David Koeller (Oregon, Alaska, Hawaii, Idaho, Nevada, and New Mexico); Kathy Tomashitis (South Carolina); Chris McKeever (Tennessee); Stephanie Sanborn, Caroline Homer, and Lindsay Toole (Texas); Kim Hart (Utah); Cindy Ingham and Leah Burke (Vermont); Kristel Fijolek (West Virginia); and Gary Hoffman (Wisconsin). We are also especially indebted to Dr. Brad Therrell of the National Newborn Screening Information System (http://nnsis.uthscsa.edu) for his encouragement and support of this project, and to the University of Texas Health Sciences Center for providing initial funding for this work (Award# 0000017221, PI: Fridovich-Keil).
Compliance with Ethical Guidelines
Conflict of Interest
All the authors of this chapter declare that there are no conflicts of interest.
Informed Consent
“All procedures followed were in accordance with the ethical standards of the responsible committee on human experimentation (institutional and national) and with the Helsinki Declaration of 1975, as revised in 2000 (5).”
No data from specific individuals are included in this study and so no one signed an informed consent form to participate.
Please note that this study was approved by both the Emory University Institutional Review Board (IRB# 00024933, PI: Fridovich-Keil) and the Georgia Department of Public Health Institutional Review Board (GA PDH IRB# 130306, PI: Fridovich-Keil). Data accessed from the Emory Genetics Lab MEDGIS database were ascertained through a HIPAA waiver granted by the Emory IRB (under IRB# 00024933).
Animal Rights
“This article does not contain any studies with animal subjects performed by any of the authors.”
Contributions of Each Author
Brook Pyhtila conducted most of the data gathering, performed some of the data analysis, and participated in writing and editing the manuscript.
Kelly Shaw performed some of the data gathering, performed some of the data analysis, and participated in editing the manuscript.
Samantha Neumann performed some of the data gathering and participated in editing the manuscript.
Judith Fridovich-Keil originated the project, oversaw the data gathering and analysis, wrote and edited most of the manuscript, and coordinated the contributions of the other authors.
1-Sentence Synopsis
Newborn screening for galactosemia in the USA is a success story, but significant challenges remain.
Footnotes
Competing interests: None declared
An erratum to this chapter is available at 10.1007/8904_2014_369
Errata to this chapter can be found at http://dx.doi.org/10.1007/978-3-662-43751-3_37010.1007/8904_2014_369
Contributor Information
Judith L. Fridovich-Keil, Email: jfridov@emory.edu
Collaborators: Johannes Zschocke and K Michael Gibson
References
- Alano A, Almashanu S, Maceratesi P, Reichardt J, Panny S, Cowan TM. UDP-galactose-4-epimerase deficiency among African-Americans: evidence for multiple alleles. J Investig Med. 1997;45:191A. [Google Scholar]
- Berry G. Galactosemia: when is it a newborn screening emergency? Mol Genet Metab. 2012;106:7–11. doi: 10.1016/j.ymgme.2012.03.007. [DOI] [PubMed] [Google Scholar]
- Beutler E, Baluda M. A simple spot screening test for galactosemia. J Lab Clin Med. 1966;68:137–141. [PubMed] [Google Scholar]
- Carney A, Sanders R, Garza K, et al. Origins, distribution and expression of the Duarte-2 (D2) allele of galactose-1-phosphate uridylyltransferase. Hum Mol Genet. 2009;18:1624–1632. doi: 10.1093/hmg/ddp080. [DOI] [PMC free article] [PubMed] [Google Scholar]
- Coffee B, Hjelm L, DeLorenzo A, Courtney E, Yu C, Muralidharan K. Characterization of an unusual deletion of the galactose-1-phosphate uridyl transferase (GALT) gene. Genet Med. 2006;8:635–640. doi: 10.1097/01.gim.0000237720.78475.fb. [DOI] [PubMed] [Google Scholar]
- Dobrowolski S, Banas R, Suzow J, Berkley M, Naylor E. Analysis of common mutations in the galactose-1-phosphate uridyl transferase gene: new assays to increase the sensitivity and specificity of newborn screening for galactosemia. J Mol Diagn. 2003;5:42–47. doi: 10.1016/S1525-1578(10)60450-3. [DOI] [PMC free article] [PubMed] [Google Scholar]
- Elsas LJ, Lai K, Saunders CJ, Langley SD. Functional analysis of the human galactose-1-phosphate uridyltransferase promoter in Duarte and LA variant galactosemia. Mol Genet Metab. 2001;72:297–305. doi: 10.1006/mgme.2001.3157. [DOI] [PubMed] [Google Scholar]
- Fernhoff PM. Duarte galactosemia: how sweet is it? Clin Chem. 2010;56:1045–1046. doi: 10.1373/clinchem.2010.147371. [DOI] [PubMed] [Google Scholar]
- Ficicioglu C, Thomas N, Yager C, et al. Duarte (DG) galactosemia: a pilot study of biochemical and neurodevelopmental assessment in children detected by newborn screening. Mol Genet Metab. 2008;95:206–212. doi: 10.1016/j.ymgme.2008.09.005. [DOI] [PubMed] [Google Scholar]
- Freer D, Ficicioglu C, Finegold D. Newborn screening for galactosemia: a review of 5 years of data and audit of a revised reporting approach. Clin Chem. 2010;56:437–444. doi: 10.1373/clinchem.2009.135947. [DOI] [PubMed] [Google Scholar]
- Fridovich-Keil JL, Walter JH (2008) Galactosemia. In: Valle D, Beaudet A, Vogelstein B, Kinzler K, Antonarakis S, Ballabio A (eds) The online metabolic & molecular bases of inherited disease. McGraw Hill, http://www.ommbid.com/
- Fridovich-Keil JL, Bean L, He M, Schroer R (2011) Epimerase deficiency galactosemia. In: Pagon RA, Adam MP, Bird TD, Dolan CR, Fong CT, Stephens K (eds) GeneReviews™ [Internet]. University of Washington, Seattle, 1993–2013, http://www.ncbi.nlm.nih.gov/books/NBK51671/ [PubMed]
- Gethins M. Breast cancer in men. J Natl Cancer Inst. 2012;104:436–438. doi: 10.1093/jnci/djs172. [DOI] [PubMed] [Google Scholar]
- Greber S, Guldberg P, Scheibenreiter S, Strobl W (1995) Mutations in classical and Duarte2 galactosemia. Pediatr Res 38:434 (abstract)
- Gurian E, Kinnamon D, Henry J, SEW (2006) Expanded newborn screening for biochemical disorders: the effect of a false-positive result. Pediatrics 117:1915–1921 [DOI] [PubMed]
- Hennermann J, Schadewaldt P, Vetter B, Shin Y, Mönch E, Klein J. Features and outcome of galactokinase deficiency in children diagnosed by newborn screening. J Inherit Metab Dis. 2011;34:399–407. doi: 10.1007/s10545-010-9270-8. [DOI] [PubMed] [Google Scholar]
- Janzen N, Illsinger S, Meyer U, et al. Early cataract formation due to galactokinase deficiency: impact of newborn screening. Arch Med Res. 2011;42:608–612. doi: 10.1016/j.arcmed.2011.11.004. [DOI] [PubMed] [Google Scholar]
- Kalaydjieva L, Perez-Lezaun A, Angelicheva D, et al. A founder mutation in the GK1 gene is responsible for galactokinase deficiency in Roma (Gypsies) Am J Hum Genet. 1999;65:1299–1307. doi: 10.1086/302611. [DOI] [PMC free article] [PubMed] [Google Scholar]
- Leslie ND, Immerman EB, Flach JE, Florez M, Fridovich-Keil JL, Elsas LJ. The human galactose-1-phosphate uridyl transferase gene. Genomics. 1992;14:474–480. doi: 10.1016/S0888-7543(05)80244-7. [DOI] [PubMed] [Google Scholar]
- Levy H, Sepe S, Walton D, et al. Galactose-1-phosphate uridly transferase deficiency due to Duarte/galactosemia combined variation: clinical and biochemical studies. J Pediatr. 1978;93:390. doi: 10.1016/S0022-3476(78)80425-9. [DOI] [PubMed] [Google Scholar]
- Mellman WJ, Tedesco TA, Feigl P. Estimation of the gene frequency of the Duarte variant of galactose-1-phosphate uridyl transferase. Ann Hum Genet. 1968;32:1–8. doi: 10.1111/j.1469-1809.1968.tb00043.x. [DOI] [Google Scholar]
- Mohamad H, Apffelstaedt J. Counseling for male BRCA mutation carriers – a review. Breast. 2008;17:441–450. doi: 10.1016/j.breast.2008.05.001. [DOI] [PubMed] [Google Scholar]
- Ohlsson A, Guthenberg C, von Döbeln U. Galactosemia screening with low false-positive recall rate: the Swedish experience. JIMD Rep. 2012;2:113–117. doi: 10.1007/8904_2011_59. [DOI] [PMC free article] [PubMed] [Google Scholar]
- Ono H, Mawatari H, Mizoguchi N, Eguchi T, Sakura N, Hamakawa M. Transient galactosemia detected by neonatal mass screening. Pediatr Int. 1999;41:281–284. doi: 10.1046/j.1442-200x.1999.01070.x. [DOI] [PubMed] [Google Scholar]
- Ono H, Mawatari H, Mizoguchi N, Eguchi T, Sakura N, Hamakawa M. Delay of liver maturation as a cause of transient neonatal galactosemia. Pediatr Int. 2000;42:61–63. doi: 10.1046/j.1442-200x.2000.01181.x. [DOI] [PubMed] [Google Scholar]
- Openo K, Schulz J, Vargas C, et al. Epimerase-deficiency galactosemia is not a binary condition. Am J Hum Genet. 2006;78:89–102. doi: 10.1086/498985. [DOI] [PMC free article] [PubMed] [Google Scholar]
- Podskarbi T, Kohlmetz T, Gathof BS, et al. Molecular characterization of Duarte-1 and Duarte-2 variants of galactose-1-phosphate uridyltransferase. J Inher Metab Dis. 1996;19:638–644. doi: 10.1007/BF01799840. [DOI] [PubMed] [Google Scholar]
- Powell KK, Van Naarden BK, Singh RH, Shapira SK, Olney RS, Yeargin-Allsopp M. Long-term speech and language developmental issues among children with Duarte galactosemia. Genet Med. 2009;11:874–879. doi: 10.1097/GIM.0b013e3181c0c38d. [DOI] [PubMed] [Google Scholar]
- Raffel LJ, Cowan TM, Blitzer MG. Transient neonatal galactosemia identified by newborn screening. J Inher Metab Disorders. 1993;16:894–895. doi: 10.1007/BF00714286. [DOI] [PubMed] [Google Scholar]
- Riehman K, Crews C, Fridovich-Keil JL. Relationship between genotype, activity, and galactose sensitivity in yeast expressing patient alleles of human galactose-1-phosphate uridylyltransferase. J Biol Chem. 2001;276:10634–10640. doi: 10.1074/jbc.M009583200. [DOI] [PubMed] [Google Scholar]
- Sangiuolo F, Magnani M, Stambolian D, Novelli G. Biochemical characterization of two GALK1 mutations in patients with galactokinase deficiency. Hum Mutat. 2004;23:396–396. doi: 10.1002/humu.9223. [DOI] [PubMed] [Google Scholar]
- Suzuki M, West C, Beutler E. Large-scale molecular screening for galactosemia alleles in a pan-ethnic population. Hum Genet. 2001;109:210–215. doi: 10.1007/s004390100552. [DOI] [PubMed] [Google Scholar]
- Tighe O, Flanagan JM, Kernan F, et al. Frequency distribution of the Los Angeles and Duarte galactose-1-phosphate uridyltransferase variant alleles in the Irish population. Mol Genet Metab. 2004;82:345–347. doi: 10.1016/j.ymgme.2004.06.005. [DOI] [PubMed] [Google Scholar]
- Trbusek M, Francova H, Kozak L. Galactosemia: deletion in the 5′ upstream region of the GALT gene reduces promoter efficiency. Hum Genet. 2001;109:117–120. doi: 10.1007/s004390100540. [DOI] [PubMed] [Google Scholar]
- Tyfield LA. Galactosaemia and allelic variation at the galactose-1-phosphate uridyltransferase gene: a complex relationship between genotype and phenotype. Eur J Pediatr. 2000;159(Suppl 3):S204–S207. doi: 10.1007/PL00014404. [DOI] [PubMed] [Google Scholar]
- van Calcar S, Bernstein L (2011) Nutrition management of classical and Duarte galactosemia: results from an international survey (Abstract). J Inherit Metab Dis 102:262 (Abstract P489)
- Walter JH, Roberts REP, Besley GTN, et al. Generalised uridine diphosphate galactose-4-epimerase deficiency. Arch Dis Child. 1999;80:374–376. doi: 10.1136/adc.80.4.374. [DOI] [PMC free article] [PubMed] [Google Scholar]
- Wilcken B. Newborn screening: gaps in the evidence. Science. 2013;342:197–198. doi: 10.1126/science.1243944. [DOI] [PubMed] [Google Scholar]
Associated Data
This section collects any data citations, data availability statements, or supplementary materials included in this article.
Supplementary Materials
Supplemental Figure 1 1-31-14 (ZIP 77 kb)
Tables REVISED 1-31-14 Clean Copy (DOCX 36.5 kb)