

Abstract
The metabolism of endothelial cells (ECs) during vessel sprouting remains poorly studied. Here, we report that endothelial loss of CPT1a, a rate-limiting enzyme of fatty acid oxidation (FAO), caused vascular sprouting defects due to impaired proliferation, not migration of ECs. Reduction of FAO in ECs did not cause energy depletion or disturb redox homeostasis, but impaired de novo nucleotide synthesis for DNA replication. Isotope labeling studies in control ECs showed that fatty acid carbons substantially replenished the Krebs cycle, and were incorporated into aspartate (a nucleotide precursor), uridine monophosphate (a precursor of pyrimidine nucleoside triphosphates) and DNA. CPT1a silencing reduced these processes and depleted EC stores of aspartate and deoxyribonucleoside triphosphates. Acetate (metabolized to acetyl-CoA, thereby substituting for the depleted FAO-derived acetyl-CoA) or a nucleoside mix rescued the phenotype of CPT1a-silenced ECs. Finally, CPT1 blockade inhibited pathological ocular angiogenesis, suggesting a novel strategy for blocking angiogenesis.
Angiogenesis relies on the proliferation and migration of endothelial cells (ECs)1. The importance of EC proliferation for expansive growth of the vascular network has long been recognized2. While numerous molecules regulating vessel sprouting have been identified3, little is known about the role of metabolism. We recently reported that ECs generate 85% of their ATP for vessel sprouting via glycolysis4. Fatty acid oxidation (FAO) has been linked in various cell types to ATP production and to ROS scavenging during cellular stress, but apart from a few earlier in vitro reports5, the role and importance of FAO in ECs during angiogenesis in vivo is undefined.
By shuttling long chain fatty acids into mitochondria, carnitine palmitoyltransferase 1 (CPT1) constitutes a rate-limiting step of FAO. Oxidation of palmitate generates acetyl-CoA, which fuels the TCA cycle. Apart from generating ATP, the TCA cycle also provides precursors for macromolecule synthesis, necessary for proliferation. However, fatty acids have not yet been shown to function as carbon sources for biosynthetic processes. In this study, we elucidated the role of FAO in ECs during angiogenesis, and studied how FAO determines EC behavior.
FAO stimulates vessel sprouting via EC proliferation
To study the role of mitochondrial FAO in vessel sprouting, we silenced CPT1a, the most abundant CPT1 isoform in human umbilical venous ECs (HUVECs), which lowered levels of CPT1a mRNA and protein and reduced FAO flux (Extended Data Fig. 1a-f). In contrast, silencing of CPT1c, expressed at lower levels (Extended Data Fig. 1a), did not affect FAO (Extended Data Fig. 1g). As similar data were obtained in other EC subtypes (Extended Data Fig. 1d,h), we used HUVECs (denoted as “ECs”) for our study.
Using EC spheroids, CPT1a silencing (CPT1aKD) decreased vessel sprout length and numbers (Fig. 1a-c; Extended Data Fig. 1i). This defect was due to decreased EC proliferation since CPT1aKD reduced proliferation and had only minimally additive effects in mitomycin C-treated mitotically inactivated ECs (Fig. 1c-f; Extended Data Fig. 1i,j). By contrast, CPT1aKD did not affect EC migration or motility (Fig. 1g-i; Extended Data Fig. 1k). Similar results were obtained when silencing long-chain acyl-CoA dehydrogenase (ACADVL), another FAO gene (Extended Data Fig. 1l-o). Additional evidence for a role of FAO in vessel sprouting was provided by overexpression of CPT1a (CPT1aOE), which yielded opposite results to those obtained by CPT1aKD (Extended Data Fig. 1p-t). Thus, CPT1a-driven FAO regulates EC proliferation during vessel sprouting.
Figure 1. FAO stimulates vessel sprouting via EC proliferation.

a,b, Representative images of control (ctrl) and CPT1aKD EC spheroids. c, Total sprout length in control and CPT1aKD EC spheroids treated with mitomycin C (MitoC) when indicated (n=3). d, [3H]-thymidine incorporation in DNA in control and CPT1aKD ECs (n=5). e,f, Representative images of MitoC-treated control and CPT1aKD EC spheroids. g, Number of MitoC-treated control and CPT1aKD ECs that traversed a Boyden chamber (n=4; p=NS). h, Scratch wound assay using MitoC-treated control and CPT1aKD ECs (n=4; p=NS). i, Lamellipodial area in control and CPT1aKD ECs (n=4; p=NS). Data are mean ± s.e.m. of n independent experiments. Statistical test: mixed models (c,d,g-i). NS, not significant. *p<0.05, ***p<0.001, ****p<0.0001.
To study the effects of endothelial CPT1a-deficiency on vessel formation in vivo, we used Cpt1alox/lox mice intercrossed with VE-Cadherin(PAC)-CreERT2 (CPT1aΔEC) mice (Extended Data Fig. 1u). Isolectin-B4 staining of retinal vessels of transgenic pups at P5 revealed that EC loss of CPT1a diminished the number of vascular branch points, and reduced radial expansion of the vascular plexus (Fig. 2a-e). This was not caused by increased vessel regression (Fig. 2f-h), but by reduced EC proliferation (Fig. 2i-k). Furthermore, CPT1aΔEC mice had normal numbers of filopodia (Fig. 2l-n) and vessel maturation (Fig. 2o-p; Extended Data Fig. 1v). Thus, impaired angiogenesis in CPT1aΔEC mice was due to EC proliferation defects.
Figure 2. CPT1a gene deletion in ECs causes vascular defects in vivo.

a,b, Representative images of retinal vessels of wild-type (a) and CPT1aΔEC (b) mice. c,d, Branch point quantification in WT and CPT1aΔEC mice in the front (c) and rear (d) of the retinal vasculature (5 litters, n=11 pups for WT and CPT1aΔEC). e, Retinal vascular outgrowth in WT and CPT1aΔEC mice (6 litters, n=13 pups for WT and 18 for CPT1aΔEC). f,g, Representative images of the retina stained for isolectin-B4 (green) and collagen IV (red) in WT (f) and CPT1aΔEC mice (g). h, Quantification of isolectin-B4− collagen IV+ empty sleeves in WT and CPT1aΔEC pups (4 litters, n=8 pups for WT and 14 for CPT1aΔEC; p=NS). i,j, Representative images of retina stained for EdU (red) and isolectin-B4 (green) in WT (i) and CPT1aΔEC (j) mice. k, Quantification of EdU+ ECs in WT and CPT1aΔEC mice (3 litters, n=9 pups for WT and 6 for CPT1aΔEC). l, Quantification of filopodia in WT and CPT1aΔEC mice (6 litters, n=20 pups for WT and 16 for CPT1aΔEC; p=NS). m,n, Representative images of filopodia in WT (m) and CPT1aΔEC (n) mice. o,p, Representative images of the retinal vasculature of WT (o) and CPT1aΔEC mice (p) stained for isolectin-B4 (blue) and the pericyte marker NG2 (pink). Data are mean ± s.e.m. of n individual mice. Statistical test: mixed models (c-e,h,k,l). NS, not significant. *p < 0.05, **p<0.01, ***p<0.001.
CPT1aKD does not cause ATP or redox imbalance
To explore via which mechanism FAO regulates EC proliferation, we studied if CPT1aKD impaired EC proliferation by causing energy stress due to ATP depletion. However, CPT1aKD did not lower ATP levels, nor did it affect the energy charge or ADP/ATP ratio (Fig. 3a,b; Extended Data Fig. 2a). This was not surprising, as FAO generated only 5% of the total amount of ATP in ECs4. Oxygen consumption (OCR) coupled to ATP synthesis was modestly reduced (Fig. 3c), but could not explain the sprouting defect, as blocking mitochondrial ATP production with oligomycin failed to affect sprouting of control and CPT1aKD ECs, suggesting that CPT1aKD impaired sprouting independently of mitochondrial ATP production (Fig. 3d; Extended Data Fig. 2b). Additional experiments confirmed that CPT1aKD ECs were not in energy stress (Extended Data Fig. 2c,d).
Figure 3. CPT1a silencing does not cause ATP depletion or redox imbalance.

a, Intracellular ATP levels in control and CPT1aKD ECs (n=4). b, Energy charge measurement in control and CPT1aKD ECs (n=3; p=NS). c, ATP coupled oxygen consumption rate (OCRATP) in control and CPT1aKD ECs (n=3). d, Total sprout length upon oligomycin (oligo) treatment in control and CPT1aKD EC spheroids (n=3). e, Intracellular ROS measurement in control and CPT1aKD ECs (n=6). f, Oxidized glutathione levels as percent of total glutathione, in control and CPT1aKD EC (n=3; p=NS). g, Total sprout length upon NAC treatment in control and CPT1aKD EC spheroids (n=3). Data are mean ± s.e.m of n independent experiments. Statistical test: mixed models (a-g). NS, not significant. *p<0.05, ***p<0.001, ****p<0.0001.
We also explored whether CPT1aKD impaired vessel sprouting by altering redox balance. CPT1aKD increased ROS levels by only 20%, an increase reported to enhance EC proliferation6, without affecting the percentage of oxidized glutathione or disturbing redox homeostasis (Fig. 3e,f). Also, lowering ROS levels by using N-acetyl-cysteine (NAC) did not restore vessel sprouting upon CPT1a silencing (Fig. 3g; Extended Data Fig. 2e). Finally, CPT1aKD did not compromise EC survival and did not increase levels of oxidative DNA damage markers (Extended Data Fig. 2f-j). Thus, CPT1aKD did not impair vessel sprouting by inducing toxic ROS levels.
FAO is used for de novo synthesis of nucleotides
We thus considered a novel role for FAO in EC proliferation and explored whether FAO regulated the production of biomass building blocks. Supplementing EC monolayers with [U-13C]-palmitate or an algal [U-13C]-fatty acid mix revealed that carbons from fatty acids provided a significant fraction of the total carbon fueling the TCA cycle intermediates and TCA cycle-derived amino acids, in fact comparably to the contribution of carbons from [U-13C]-glutamine and [U-13C]-glucose (Fig. 4a-c)7. This was unexpected as many cancer cell types rely almost exclusively on glucose and glutamine to fuel the TCA cycle8. CPT1aKD also lowered the cellular pool size of citrate, aspartate and glutamate (Fig. 4d).
Figure 4. CPT1a silencing reduces TCA replenishment and FAO is used for nucleotide synthesis.

a, Total contribution of [U-13C]-palmitate (palm), [U-13C]-glucose (glyc), and [U-13C]-glutamine (glut) to citrate (n=3). b,c, Total contribution of [U-13C]-palmitate (b) or [U-13C]-algal fatty acid (FA) mix (c) to citrate (cit), α-ketoglutarate (αKG), fumarate (fum), malate (mal), aspartate (asp), proline (prol), glutamate (glut) or asparagine (asn) in control and CPT1aKD ECs (n=7 for TCA intermediates and n=3-5 for amino acids in b; n=3 in c). d, Intracellular content of citrate (cit), glutamate (glut), aspartate (asp), glutamine (gln), isoleucine (ile), methionine (met), tyrosine (tyr), asparagine (asn), alanine (ala), glycine (gly), serine (ser), proline (pro), valine (val), leucine (leu) and phenylalanine (phe) in control and CPT1aKD ECs (n=8 for cit and asp, n=6 for glut, n=4 for asn and ser, n=5 for ala, gly, gln, pro, val, leu, ile, met, phe and tyr). e, De novo protein synthesis in control and CPT1aKD ECs (n=3; p=NS). f, [3H]-thymidine incorporation upon cycloheximide (CHX) treatment in control and CPT1aKD ECs (n=3). g, [U-14C]-palmitate incorporation into RNA in control and CPT1aKD ECs (n=5). h, De novo RNA synthesis in control and CPT1aKD ECs (n=3; p=NS). i, Intracellular levels of the rNTPs in control and CPT1aKD ECs (n=4; p=NS). AU: arbitrary units. j, [U-14C]-palmitate incorporation into DNA in control and CPT1aKD ECs (n=5). k,l, % M1 and M2 labeling from [U-13C]-palmitate in UMP (k) and UTP (l) in control and CPT1aKD ECs (n=5). m, Reduction of intracellular dNTP levels in CPT1aKD versus control ECs (n=5 for dATP and dCTP, n=4 for dTTP and dGTP). n,o, Total sprout length upon 5-fluorouracil (5FU) (n) or methotrexate (MTX) (o) treatment in control and CPT1aKD ECs (n=4). Data are mean ± s.e.m of n independent experiments. Statistical test: mixed models (a-o). NS, not significant. *p<0.05, **p<0.01, ***p<0.001, ****p<0.0001.
Since TCA intermediates are used for the synthesis of biomass precursors, and inhibition of FAO limited the supply of these TCA intermediates, we explored if CPT1aKD impaired protein and/or nucleotide synthesis. CPT1aKD did however not impair de novo protein synthesis (Fig. 4e) and did not consistently alter intracellular amino acid levels (Fig. 4d). Also, CPT1aKD still lowered EC proliferation when protein synthesis was reduced by cycloheximide (Fig. 4f), suggesting that a decrease of de novo protein synthesis did not prevent CPT1a silencing to establish its proliferation defect.
Given that aspartate is a precursor of nucleotides and its levels were reduced upon CPT1aKD, we explored if fatty acid-derived carbons were used for de novo ribonucleotide synthesis. Indeed, label from [U-14C]-palmitate was incorporated into RNA in control ECs, and this process was decreased upon CPT1aKD (Fig. 4g). However, despite this, CPT1aKD ECs did not have reduced RNA levels and pools of ribonucleotides (rNTPs) (Fig. 4h,i), presumably because of compensatory production by salvage pathways. Thus, insufficient RNA synthesis did not cause the proliferation defect of CPT1aKD ECs.
We therefore assessed if impaired de novo deoxyribonucleotide synthesis caused the proliferation defect of CPT1aKD ECs. Indeed, label from [U-14C]-palmitate was incorporated into DNA, and this was reduced upon CPT1a silencing (Fig. 4j). As CPT1aKD also decreased de novo DNA synthesis (Fig. 1d), we hypothesized that FAO blockade reduced aspartate levels and thereby compromised de novo deoxyribonucleotide biosynthesis. Indeed, labeled carbons from [U-13C]-palmitate were incorporated in the pyrimidine precursors uridine monophosphate (UMP) and uridine-5′-triphosphate (UTP), and this incorporation was reduced upon CPT1a silencing (Fig. 4k,l; Extended Data Fig. 3a). Moreover, quantification of deoxyribonucleotide (dNTP) levels confirmed that CPT1aKD lowered the intracellular levels of all pyrimidine (dCTP, dTTP) and purine deoxyribonucleotides (dATP, dGTP) needed for DNA replication (Fig. 4m). Thus, in contrast to the retained rNTP levels, CPT1aKD depleted the pool of dNTPs.
To functionally confirm that the effect of CPT1aKD depends on reduced de novo nucleotide synthesis, we inhibited de novo synthesis of nucleotides by methotrexate (MTX) and 5-fluorouracil (5FU), which reduced vessel sprouting in control but no longer in CPT1aKD cells (Fig. 4n,o; Extended Data Fig. 3b,c). Thus, CPT1aKD reduced sprouting mainly via inhibition of de novo deoxyribonucleotide synthesis.
To confirm the role of fatty acid derived carbons for nucleotide synthesis, we supplemented CPT1aKD cells with acetate (which is converted to acetyl-CoA). Treatment of CPT1aKD ECs with acetate completely restored the levels of aspartate and dNTPs (Fig. 5a,b). Furthermore, CPT1aKD and control cells incorporated comparable amounts of [U-13C]-acetate into UMP and UTP (Fig. 5c,d). Functionally, acetate rescued the sprouting defect of CPT1aKD ECs (Fig. 5e; Extended Data Fig. 3d-g). Also, blockade of the ATP synthase did not prevent this rescue, indicating that acetate was not used for the production of ATP but instead for the synthesis of biomass (Extended Data Fig. 3h,i).
Figure 5. Acetate or nucleosides rescue the CPT1aKD sprouting defect.

a, Intracellular aspartate levels upon acetate supplementation in control and CPT1aKD ECs (n=3). AU: arbitrary units. b, Intracellular levels of the indicated dNTPs upon acetate supplementation in control and CPT1aKD ECs (n=3). c,d, % M1 and M2 labeling from [U-13C]-acetate in UMP (c) and UTP (d) in control and CPT1aKD ECs (n=5; p=NS). e, Total sprout length upon acetate supplementation in control and CPT1aKD EC spheroids (n=3). f, Total sprout length upon nucleoside mix supplementation in control and CPT1aKD EC spheroids (n=4). g, Total contribution of [U-13C]-glucose and [U-13C]-glutamine to citrate in control and CPT1aKD ECs (n=3). h, % M+2 labeled citrate from [U-13C]-glucose in control and CPT1aKD ECs (n=3). i,j, % M+3 labeled malate (i) and aspartate (j) from [U-13C]-glucose in control and CPT1aKD ECs (n=3). Data are mean ± s.e.m of n independent experiments. Statistical test: mixed models (a-j). NS, not significant. ***p<0.001, ****p<0.0001.
Supplementation of a mix of nucleosides or dNTPs also fully rescued the sprouting defect of CPT1aKD vessels, indicating that FAO blockade impaired nucleotide synthesis (Fig. 5f; Extended Data Fig. 3j,k). Notably, acetate or the nucleoside mix were unable to rescue the CPT1aKD sprouting defect upon mitotic inactivation of CPT1aKD ECs, indicating that their effect relied on stimulating EC proliferation (Extended Data Fig. 3l; not shown). Thus, CPT1a-driven FAO is critical for de novo deoxyribonucleotide synthesis to ensure EC proliferation during sprouting.
Glucose partly compensates for FAO loss
Nucleotides can also be synthesized from glucose and glutamine9, so we asked if ECs would compensate for the loss of FAO using these nutrients. CPT1aKD increased the oxidation of glucose but not of glutamine (Extended Data Fig. 3m,n), and increased [U-13C]-glucose incorporation into citrate and aspartate, whereas [U-13C]-glutamine incorporation into citrate and asparate was not/neglegibly altered (Fig. 5g; Extended Data Fig. 3o). The activity of pyruvate dehydrogenase and pyruvate carboxylase was increased in CPT1aKD ECs (Fig. 5h-j), which can contribute to the increase in glucose oxidation. Nonetheless, this compensation was insufficient to rescue the proliferation defect of CPT1aKD ECs, indicating that fatty acids are irreplaceable for DNA replication in ECs.
Do other cells use fatty acids for DNA synthesis?
To assess the broader relevance of FAO’s role in deoxyribonucleotide synthesis, we studied [U-13C]-palmitate contribution to citrate in a panel of normal and malignant proliferating cells. Fibroblasts (and to a certain extent pericytes) but no other primary cells incorporated substantial amounts of fatty acid-derived carbon into citrate (Fig. 6a). Except for the breast cancer (T47D, MCF7) and a lung cancer (A549) cell line (known to rely on FAO for ATP and NADPH production10), fatty acids contributed minimally to citrate production (Fig. 6a). Remarkably, even when these cancer cells incorporated fatty acid-derived carbons into citrate, they incorporated them to a much lesser extent into DNA (Fig. 6b), implying that fatty acid-derived carbons entering the TCA cycle were used for other purposes than deoxyribonucleotide synthesis. In fact, only fibroblasts incorporated similar amounts of fatty acid-derived carbons into DNA than ECs (Fig. 6b).
Figure 6. Most other cell types do not use FA carbons for dNTP synthesis and inhibition of CPT1a impairs angiogenesis.

a, Total contribution of [U-13C]-palmitate to citrate in various primary cells and cancer cell lines, expressed relative to the value in ECs (n=9 for ECs, n=8 for pericytes (per), n=6 for T cells, B16, A549 and 143B, n=5 for PancO2, n=4 for DU145, T47D and MDA, n=3 for fibroblasts (fib), ES cells, HCT, CT2A, U87 and MCF7). b, Contribution of [U-14C]-palmitate to DNA, expressed relative to the value in ECs (n=14 for ECs, n=6 for pericytes (per), n=5 for B16, Panco2 and A549, n=4 for fibroblasts (fib), T47D, 143B and T cells, n=3 for HCT, MDA, DU145, U87, CT2A, MCF7 and ES cells). c,d, Representative images of retinal flat-mounts of ROP mice treated with vehicle (c) or etomoxir (eto) (d). e, Vascular tuft area in control and etomoxir-treated pups (n=13 for WT and 9 for etomoxir). f, Mechanistic model. Top – control ECs: Uptake of palmitate and FAO in ECs are not essential for the production of ATP and NADPH (indicated in the shaded box), but fatty acid-derived carbons are incorporated in amino acids, and in precursors of rNTPs and dNTPs; how critically these pathways regulate EC proliferation cannot be assessed in control cells (denoted by question mark). Bottom – CPT1aKD ECs: Silencing of CPT1a reveals however that decreasing FAO depletes dNTP pools, without affecting rNTP and protein synthesis, implying that fatty acids are irreplaceable for DNA synthesis; since de novo synthesis of dNTPs is critical for DNA replication, CPT1a silencing impairs EC proliferation. Data are mean ± s.e.m of n independent experiments (a,b) or the total number of mice (of 4 litters) (e). Statistical test: two-sided t-test (a,b); mixed models (e). NS, not significant. *p<0.05, **p<0.01, ***p<0.001, ****p<0.0001.
Inhibition of CPT1a impairs angiogenesis
Pharmacological agents with FAO-blocking activity are being used clinically11. To explore if pharmacological blockade of CPT1 reduced pathological angiogenesis, we used etomoxir, an irreversible inhibitor of mitochondrial long-chain FAO. Etomoxir reduced FAO and EC proliferation, but not migration in vitro (Extended Data Fig. 4a-c). In vivo, etomoxir induced similar retinal vascular defects as CPT1a deficiency in ECs (Extended Data Fig. 4d-g) and reduced pathological angiogenesis in a model of retinopathy of prematurity (ROP) (Fig. 6c-e). The mechanistic model of our findings is represented in Fig. 6f.
Discussion
The novelty of this study relates to several observations. First, FAO is critical for vessel sprouting in vivo, more importantly than expected based on earlier reports5. Second, FAO affects proliferation, not migration of ECs, which caused vessel sprouting defects. Unlike PFKFB3-driven glycolysis, which affects EC proliferation and migration4, FAO selectively regulates EC proliferation, indicating that distinct metabolic pathways control distinct EC functions during vessel sprouting. Third, we discovered an unknown role of fatty acid-derived carbons in de novo nucleotide synthesis for DNA replication in ECs. Our results indicate that FAO promotes de novo deoxyribonucleotide synthesis by providing carbons for the production of aspartate and glutamate. The fact that aspartate is a direct carbon donor for the synthesis of the pyrimidine nucleobase (Extended Data Fig. 3a) and that the pool of aspartate was reduced in CPT1aKD ECs explain why pyrimidine dNTP levels were reduced. But aspartate and glutamate also serve as nitrogen source for the production of the nucleobase of pyrimidines and purines. This explains why the synthesis of purine dNTPs was also impaired upon FAO blockade. Interestingly, of other primary and malignant cell types tested, only ECs and fibroblasts used substantial amounts of fatty acid carbons for DNA synthesis, even though certain cancer cell lines incorporated fatty acid-derived carbons in the TCA cycle.
Fatty acids were irreplaceable for DNA synthesis, but not for protein and RNA synthesis. A possibility is that CPT1aKD ECs maintained RNA levels by producing rNTPs via nucleotide salvage. Indeed, quiescent / hypo-proliferative cell types (CPT1aKD ECs are hypo-proliferative) rely primarily on nucleotide salvage rather than on de novo nucleotide synthesis to synthesize RNA12. By contrast, proliferating cells switch on de novo synthesis of dNTPs to duplicate their DNA genome13. Support for the notion that ECs use nucleotide salvage primarily for RNA synthesis is provided by evidence that incorporation of carbons from hypoxanthine (a nucleotide salvage intermediate) was higher in RNA than DNA (Extended Data Fig. 3p). This may explain why FAO blockade affected levels of dNTPs but not/less of rNTP levels. A recent study on the role of pyruvate kinase (PK) isoenzymes documented that PKM1 expression reduced incorporation of 13C-label from [U-13C]-glucose in UMP and decreased dNTP levels and cell proliferation, yet did not alter rNTP levels14, illustrating that the production of rNTPs and dNTPs is regulated differently.
Fourth, we identified that fatty acid-derived carbons entering the TCA cycle are used for biomass production. This was unexpected since evidence in rapidly proliferating cancer cells indicated that glucose and glutamine are utilized as primary carbon source for de novo deoxyribonucleotide synthesis8,14. The utilization of fatty acids for biomass production is however not unprofitable. Indeed, given that fatty acids are a much richer carbon source than glucose or glutamine, use of fatty acids is an efficient mechanism to generate nucleotides. Finally, pharmacological CPT1 blockade reduced pathological angiogenesis, which may hint to an underappreciated therapeutic potential of lowering FAO for the inhibition of pathological angiogenesis.
Experimental Methods
Chemicals and reagents
Collagen type 1 (rat tail) was from Millipore or from PureCol® (bovine) (Advanced Biomatrix, USA). The CPT1a inhibitor (+)-etomoxir sodium salt hydrate was purchased from CNIO Carlos III Therapies. Mitomycin C (MitoC), sodium palmitate, dimethyl sulfoxide (DMSO), NAC, sodium acetate, oligomycin, cycloheximide, cytidine, adenine, guanosine, methotrexate, carnitine, dNTP mix and tamoxifen were from Sigma-Aldrich (Bornem, Belgium). 5-fluorouracil (TEVA Pharma Belgium) was obtained from the pharmacy of the university hospital Leuven. Nucleoside mix was from Millipore (Belgium)15. Hoechst 33342 and L-homopropargylglycine (HPG) were from Molecular Probes and L-glutamine and penicillin/streptomycin were from Gibco® (Invitrogen, Life Technologies, Ghent, Belgium). Uniformly labeled [U-13C]-potassium palmitate, [U-13C]-acetate, [U-13C]-glucose, [U-13C]-glutamine and [U-13C]-algal fatty acid mix were obtained from Cambridge isotope laboratories, Inc. [U-14C]-palmitate, [9,10-3H]-palmitate, [6-14C]-D-glucose, [8-14C]-hypoxanthine and [3H]-thymidine were from Perkin Elmer.
Cell culture
Primary Cells: Human umbilical vein endothelial cells (HUVECs) were freshly isolated from different donors as described16 (with approval of medical ethical committee KULeuven/UZLeuven and informed consent obtained from all subjects), regularly tested for mycoplasma and used between passage 1 and 5. HUVECs were cultured in M199 medium (1 mg/ml D-glucose) from Gibco® (Invitrogen, Life Technologies, Ghent, Belgium) supplemented with 20% fetal bovine serum (FBS) Biochrom GmbH (Germany), 2 mM L-glutamine, 30 μg/l endothelial cell growth factor supplements (EGCS), 10 units/ml heparin (Sigma), 100 IU/ml penicillin and 100 μg/ml streptomycin or in endothelial basal medium (EBM-2) supplemented with endothelial growth medium SingleQuots (Promocell, Germany). In all experiments, HUVECs were always used as single-donor cultures. Human aortic ECs (HAECs) and adult human dermal blood microvascular ECs (HMVEC-dBlAd) were either from Clonetics, Lonza (Braine-l’Alleud, Belgium) or isolated from umbilical cords for arterial ECs or from placenta for microvascular ECs, and were cultured in the recommended medium supplemented with SingleQuots (EGM-2 or EGM-2 MV; Clonetics, Lonza, Braine-l’Alleud, Belgium). Human pericytes were isolated from human placenta using gentleMACS tissue dissociator (Miltenyi Biotec) and incubation with collagenase 0.2% (GIBCO) and Dnase 80 U/ml (Life technologies) for 30 min at 37°C followed by Percoll gradient 5 (GE Healthcare) centrifugation, or from human adipose tissue using collagenase 0.2% in 0.9% NaCl and 2 mM CaCl2 for 1 hr 37°C. Thereafter, the cell suspension was immunomagnetically sorted by using CD31 and CD146 antibodies conjugated with microbeads (Miltenyi Biotec). CD146+/CD31− sorted cells were seeded in αMEM plus 10% FBS and 5 nM PDGFBB. Human T cells: Peripheral blood mononuclear cells (PBMCs) were isolated from whole blood by Ficoll-Paque Plus (Amersham Biosciences) density gradient centrifugation. PBMCs were collected, washed with cold PBS and subsequently used for naive T-cell isolation. Naive T-cells were isolated with a pan T-cell isolation kit (MACS Myltenyi Biotec). After isolation, naïve T-cells were seeded in plates coated with anti-CD3 antibody 5ug/ml, anti-CD28 (0.5 ug/ml) and IL-2 (10 ng/ml) were added to the medium. All cell preparations were used in experiments as single donor cultures. Murine fibroblasts were freshly isolated from lungs of FVB mice and cultured and used between passage 1 and 5. Briefly, dissected lungs were chopped and digested in a solution of 2 mg/ml collagenase (Sigma blend L, Sigma-Aldrich) in RPMI media from Gibco® (Invitrogen, Life Technologies, Ghent, Belgium) containing 2.5% fetal bovine serum (FBS), 10mM HEPES, 2mM glutamine, 100 IU/ml penicillin and 100 μg/ml streptomycin (5 ml/ lung) for 1 hour at 37°C. Organoids were pelleted at 1,100 rpm, washed four times with digestion solution and then plated into standard tissue culture flasks in DMEM/F12 medium from Gibco® (Invitrogen, Life Technologies, Ghent, Belgium) containing 5% fetal bovine serum (FBS), 2mM glutamine, 100 IU/ml penicillin and 100 μg/ml streptomycin. The day after isolation, the medium was refreshed. Cells were then routinely maintained in 5% CO2 and 95% air at 37°C and the medium was replaced every second day. ES cells: G4 ES cells were routinely passaged every 2-3 days onto freshly prepared Mitomycin C arrested feeder layers, and were refed daily with fresh ES cell culture medium consisting of 500 ml Knockout DMEM medium (Life Technologies), supplemented with 2 mM L-glutamine (Life Technologies), 90ml fetal bovine serum (Biochrom BmgH), MEM nonessential amino acids 100× (GIBCO/Invitrogen), 0.01 mM β-mercaptoethanol (Sigma-Aldrich), 1 mM sodium pyruvate (GIBCO/Invitrogen), penicillin /streptomycin 100× (Life Technologies), and 2000 U/ml Leukemia Inhibitory Factor (Merck Millipore). Prior to testing whether ES cells use fatty acids for DNA synthesis they were replated at least 3 times on gelatinized dishes without any feeders. Doing so, all feeder cells were selectively removed from the culture dishes, resulting in 100% pure undifferentiated ES cell cultures. tumor cell lines: Murine melanoma B16 clone F10.9 (obtained from American Type Culture Collection, ATCC; LGC Standards, Molsheim Cedex, France) and PancO2 murine pancreatic carcinoma cells (provided by B. Wiedenmann, Charité, Berlin, Germany) were cultured in RPMI containing 10% FBS. MCF7 (human breast cancer), HCT116 (human colon carcinoma), MDA-MB-468 (human breast carcinoma cells), T47D (human ductal breast epithelial tumor cells), DU145 (human prostate cancer cells), 143B (human osteosarcoma cells), A549 (human lung carcinoma cells) were cultured in DMEM containing 10% FBS, 2 mM glutamine, 100 IU/ml penicillin and 100 mg/ml streptomycin. CT2A murine glioblastoma cells and U87 human glioblastoma cells were cultured in DMEM containing 10% FBS and 2 mM glutamine (Invitrogen, Life Technologies, Ghent, Belgium) supplemented with conditioned medium obtained from CT2A or U87 cells.
Knock-down and overexpression strategies
RNA interference: CPT1a silencing was achieved using a validated pool of siRNA duplexes directed against human CPT1a (Trifekta Kit, IDT) and lipofectamine RNAi Max transfection reagent (Invitrogen, Belgium) according to the manufacturer’s instructions. A scrambled siRNA was used as negative control. Lentiviral transductions: For overexpression of murine CPT1a, the cDNA was cloned in the pRRLsinPPT.CMV.MCS MM W prevector17. Of note, this increased FAO in some but not in all EC isolations, suggesting that in such cases CPT1a abundance was not limiting the maximal capacity of FAO. However, whenever FAO was enhanced, sprout numbers and length of EC spheroids were increased. To generate shRNA vectors against CPT1a, CPT1c, or ACADVL, oligonucleotides were cloned into the pLKO-shRNA2 vector (No. PT4052-5; Clontech, Westburg BV, Leusden, the Netherlands) (oligonucleotide sequences are available upon request). A nonsense scrambled shRNA sequence was used as a negative control. Production of lentiviruses by transfection into 293T cells was performed as described18. For transductions, a multiplicity of infection (MOI) of 20 was used in all shCPT1a experiments. For transductions with shACADVL and shCPT1c and for FUCCI and CPT1a overexpression, a MOI of 10 was used. Cells were transduced overnight and re-fed with fresh medium the next day. Transduced cells were used in functional assays at least 3 to 4 days post-transduction. Of note: similar data were obtained using siRNA and 2 non overlapping shRNAs directed against CPT1a.
In vitro assays
Proliferation was quantified by incubating cells for 2-24 hours with 1 μCi/ml [3H]-thymidine. Thereafter, cells were fixed with 100% ethanol for 15 min at 4°C, precipitated with 10% trichloroacetic acid and lysed with 0.1 N NaOH. The amount of [3H]-thymidine incorporated into DNA was measured by scintillation counting. Scratch wound migration assay: a scratch wound was applied on confluent EC monolayers (pretreated with MitoC where indicated) using a 200 μl tip, 24 hours after seeding (100,000 cells per well in 24-well plates). After scratch wounding and photography (T0), the cultures were further incubated in fully supplemented EBM2 medium for 6-8 hours (until near closure was reached in the control condition), and photographed again (Tx). Migration distance (gap area at T0 minus gap area at Tx) was measured with NIH Image J software package and is expressed in arbitrary units. Modified boyden chamber migration assays were performed using MitoC-treated (24 hour treatment with 2 μg/ml MitoC) ECs. Therefore, 50,000 cells were seeded in fully supplemented EBM2 medium on 0.1% gelatin coated transwells. Upon adherence, the transwells were washed and refed with medium containing only 0.1% FBS and transferred to bottom wells containing medium with 0.1% FBS (baseline) or 5% FBS (migration stimulus). Transwells were incubated for 16 hours and processed and analyzed for migrated cells as described19. Lamellipodia formation assay: The number and area of lamellipodia were measured on still photos of time-lapse recordings of sparsely seeded ECs, using the Axiovision morphometric analysis software (Carl Zeiss, Munich, Germany) with in-house developed macros. Lamellipodia area is expressed in percent of total cell area. Directionality of migration was assessed by analysis of the total length of the migration track of a cell. The directionality value was then calculated by dividing the distance between the start and end location of the cell by the total track length; a higher directionality value denotes higher migration directionality. Experiments were performed with or without genetic shRNA CPT1a silencing. Spheroid capillary sprouting assay: ECs were incubated overnight in hanging drops in EGM-2 medium containing methylcellulose (20 volume% of a 1.2% solution of methylcellulose 4000 cP) (Sigma-Aldrich, Bornem, Belgium) to form spheroids. For mitotic inactivation, MitoC (2 μg/ml) was added to this medium. Spheroids were then embedded in collagen gel as described20 and cultured for 20 hours to induce sprouting. Compounds were added at the following concentrations during the collagen gel culture step, using corresponding vehicle concentrations as control: 20 mM sodium acetate, 5× nucleoside mix, 10 mM NAC, 1.2 μM oligomycin, 20 μg/mL cycloheximide, 50 μg/mL 5FU or 20 μM MTX. Cultures were fixed with 4% PFA at room temperature and imaged under bright field using a Motic AE 31 microscope (Motic Electric Group Co Ltd., Xiamen, China; or Leica DMI6000 microscope (Leica Microsystems, Mannheim, Germany). Analysis of the number of sprouts per spheroid and the total sprout length (cumulative length of primary sprouts and branches per spheroid) was done on phase contrast images using the NIH Image J software package. To assess the number of viable versus dead cells, unfixed spheroids were stained with 500 μl of 1/500 dilution of TO-PRO3 (Invitrogen, Life Technologies, Ghent, Belgium) solution at 37 degrees for 10 min, washed with PBS and imaged by confocal microscopy Zeiss LSM 510 Meta NLO or Zeiss LSM 780 confocal microscope (objectives: ×10 with NA 0.3, ×20 with NA 0.4) (Carl Zeiss, Munich, Germany)21. atp measurement: Analysis of total ATP levels was performed using a commercially available kit (ATPlite™, PerkinElmer). apoptosis: Analysis of apoptosis was done by fluorescent staining for cleaved caspase 3 (Cell signaling Technology, Bioke, Leiden, the Netherlands) in PFA fixed monolayers.
RNA analysis
RNA expression analysis was performed by Taqman quantitative RT-PCR as described22 using in house-designed primers and probes or premade primer sets (Applied Biosystems, Carlsbad, CA and IDT, Belgium). Sequences or premade primer set ID numbers are available upon request. For comparison of gene expression between conditions, expression (normalized to HPRT endogenous control) is expressed relative to control condition. For comparison between different genes, absolute expression levels were determined based on respective cDNA standard curves, and levels are expressed as copies mRNA/103 copies HPRT mRNA.
Immunoblot analysis
Protein extraction and immunoblot analysis were performed using a modified Laemmli sample buffer (125 mM Tris-HCl, pH 6.8 buffer containing 2% SDS and 10% glycerol)22 or cell lysis buffer (Cell Signaling Technology) in the presence of protease and phosphatase inhibitors (Roche, Vilvoorde, Belgium). Lysates were separated by SDS-PAGE under reducing conditions, transferred to a nitrocellulose or PVDF membrane, and analyzed by immunoblotting. Primary antibodies used were rabbit anti-CPT1a (No. 12252), rabbit anti-Lamin A/C (No. 2032), rabbit anti-β-actin (No. 4970), anti-total AMPKα (No. 2532), rabbit anti-phospho-AMPKα Thr172 (No. 2531), anti-p21 (No. 2947), anti-phospho-ATM (No. 5883), anti-total ATM (No. 2873) (Cell Signaling Technology, Bioké, Leiden, the Netherlands), and anti-total p53 (FL 393, Santa Cruz Biotechnology, the Netherlands). Autophagy was analyzed via western blot determination of LC3 II/I ratio (No. 3868, Cell Signaling Technology) to reveal the on-state of autophagy (autophagic flux). Equal loading was verified by Ponceau Red staining and Lamin A/C or ß-actin as loading controls. Appropriate secondary antibodies were from Dako (Enschede, the Netherlands). Signal was detected using the ECL system (Amersham Biosciences, GE Healthcare, Diegem, Belgium) according to the manufacturer’s instructions. Densitometric quantifications of bands were done with NIH Image J software.
Flow cytometry
Protein/RNA synthesis: Protein synthesis was determined by incubation of cells with a methionine analogue (HPG, Invitrogen) for 24 h in full medium. RNA synthesis was determined by incubation of cells with a uridine analogue (5′-ethynyl uridine, EU, molecular probes). Cells were trypsinized, PFA fixed and incorporated HPG or 5′-ethynyl uridine was detected by a Click-IT reaction with Alexa fluor 647 according to the manufacturer’s instructions. Alexa fluor 647 was excited with a 604 nm red laser and emission was recorded at 660 nm using a BD FACS Canto flow cytometer (Becton Dickinson Benelux NV, Erembodegem, Belgium). Intracellular ROS analysis: Intracellular ROS levels were measured using the CM-DCF dye according to the manufacturer’s instructions (Invitrogen, Belgium). For flow cytometry analysis the BD FACS Verse flow cytometer was used. Cell count: for assessment of cell number, cells were seeded in a 24-well plate and trypsinized after 48 h growth. Cells were resuspended in 150 μl of PBS and 100 μl of cell suspension was counted at a flow rate of 1 μl per second. Data were analyzed using FlowJo analysis software.
Metabolism assays
Fatty acid oxidation: ECs were incubated in fully supplemented EBM2 medium with 100 μM unlabeled palmitate and 50 μM carnitine. Cells were incubated for 2 hours in growth medium containing 2 μCi/ml [9,10-3H]-palmitate23,24. Thereafter, supernatant was transferred into glass vials sealed with rubber stoppers. 3H2O was captured in hanging wells containing a Whatman paper soaked with H2O over a period of 48 hours at 37°C to reach saturation25. Radioactivity was determined by liquid scintillation counting. Glycolysis: Glycolysis was measured analogously to fatty acid oxidation (cf supra) using 80 mCi/mmol [5-3H]-D-glucose (Perkin Elmer)23. 14C-glucose oxidation: Cells were incubated for 6 hours in growth medium containing 100 μCi/mmol [6-14C]-D-glucose. Thereafter, 250 μl of 2 M perchloric acid was added to each well to stop cellular metabolism and wells were immediately covered with a 1× hyamine hydroxide-saturated Whatman paper. Overnight absorption of 14CO2 released during oxidation of glucose into the paper was performed at room temperature, and radioactivity in the paper was determined by liquid scintillation counting. 14C-glutamine oxidation: was performed similarly as glucose oxidation, except that we used 0.5 μCi/ml [U-14C]-glutamine as tracer. Palmitate or hypoxanthine mediated RNA and DNA synthesis: was measured by the incorporation of 14C into RNA or DNA using 100 μCi/mmol [U-14C]-palmitate or [8-14C]-hypoxanthine and was corrected for the total amount of RNA or DNA per sample. Total RNA and DNA were isolated using commercially available column-based DNA and RNA extraction kits (Qiagen) or using Trizol as an alternative extraction method for RNA or DNA. ATP coupled oxygen consumption: Cells were seeded at 40,000 cells per well on Seahorse XF24 tissue culture plates (Seahorse Bioscience Europe, Copenhagen, Denmark). The measurement of oxygen consumption was performed at 10 min intervals (2 min mixing, 2 min recovery, 6 min measuring) for 3 hours using the Seahorse XF24 analyzer. For ATP coupled oxygen consumption, measurements were performed before and after oligomycin (1.2 μM) treatment. Energy balance assessment: 1.5 × 10⁶ cells were harvested in ice cold 0.4 M perchloric acid supplemented with 0.5 mM EDTA. pH was adjusted by adding 100 μl of 2 M K2CO3. 100 μl of the mixture was injected onto an Agilent 1260 HPLC equipped with a C18-Symmetry column (150 × 4.6 mm; 5 μm) (Waters), thermostated at 22.5 °C. Flow rate was kept constant at 1 ml/min. A linear gradient using solvent A (50 mM NaH2PO4, 4 mM tetrabutylammonium, adjusted to pH 5.0 using H2SO4) and solvent B (50 mM NaH2PO4, 4 mM tetrabutylammonium, 30% CH3CN, adjusted to pH 5.0 using H2SO4) was accomplished as follows: 95% A for 2 min, from 2 to 25 min linear increase to 100% B, from 25 to 27 min isocratic at 100% B, from 27 to 29 min linear gradient to 95% A and finally from 29 to 35 min at 95% A. Detection of ATP, ADP and AMP occurred at 259 nm. GSSG/GSH ratio measurement. Samples were collected in 300 μl 5% TCA (trichloro-acetic acid, Sigma). 50 μl was loaded onto an Ultimate 3000 UPLC (Thermo Scientific, Bremen, Germany) equipped with a Acquity UPLC HSS T3 column (cat # 186003976; 2.1 × 5 mm; 1.8 μm particles; Waters) in line connected to a Q Exactive mass spectrometer (Thermo Fisher Scientific). A linear gradient was carried out using solvent A (0.05% formic acid) and solvent B (60% methanol, 0.05% formic acid). Practically, samples were loaded at 99% solvent A and from 10 to 12 min a ramp to 100% solvent B was carried out. From 15 to 16 min the column returned to 99% solvent A and the run was stopped at 21 min. Elution of GSH and GSSG occurred at 3 and 5.5 min respectively (isocratic separation). Flow rate was constant at 250 μl/min and the column temperature was kept constant at 37°C. The mass spectrometer operated in targeted SIM mode following the ions m/z 311.11456 and 308.59499 (GSH and GSSG respectively) using the ion 445.12003 as lock mass. The mass spectrometer ran in positive polarity, the source voltage was 3.0 kV, and the capillary temperature was set at 350°C. Additional sheath gas flow was put at 35 and auxiliary gas flow rate at 10. Auxiliary gas heater temperature was put at 60°C. AGC target was put at 1e5 ions with a maximum ion injection time of 200 ms) acquired at a resolution of 70 000. For the data analyses we manually integrated the peaks representing GSH and GSSG using the Thermo XCalibur Qual Browser software (Thermo Scientific) and data is represented as area of the respective GSH and GSSG peaks. Determination of 13C-palmitate, glucose and glutamine incorporation in metabolites and total metabolite levels: For 13C-carbon incorporation from palmitate in metabolites, cells were incubated for 48 hours with labeled substrates (confirmation of steady state at that time was confirmed, see Extended Data Fig. 5). For ECs, [U-13C]-palmitate labeling was done in two ways: (1) “100% labeling”, whereby all cold palmitate in M199 culture medium (120 μM) was replaced by 120 μM [U-13C]-palmitate using M199 medium, containing charcoal stripped serum (which does not contain any fatty acids); and (2) “50/50% labeling”, whereby 100 μM [U-13C]-palmitate was added to the EGM2 culture medium containing 100 μM cold palmitate. Both types of labeling yielded similar data and were thus pooled. For comparison with cancer cells, only the 100% labeling strategy was used. Similar labeling methods were used for glucose (5.5 mM) and glutamine (2 mM). Labeling with the algal [U-13C] fatty acid mix was performed by using 100% labeling; this fatty acid mix contained 50 μM palmitate. Metabolites for the subsequent mass spectrometry analysis were prepared by quenching the cells in liquid nitrogen followed by a cold two phase methanol-water-chloroform extraction7,26. Phase separation was achieved by centrifugation at 4°C and the methanol-water phase containing polar metabolites was separated and dried using a vacuum concentrator 24,61. The dried metabolite samples were stored at −80°C7,26. Polar metabolites were derivatized for 90 min at 37°C with 7.5 μl of 20 mg/ml methoxyamine in pyridine and subsequently for 60 min at 60°C with 15 μl of N-(tert-butyldimethylsilyl)-N-methyl-trifluoroacetamide, with 1 % tert-butyldimethylchlorosilane7,26. Isotopomer distributions and metabolite levels were measured with a 7890A GC system (Agilent Technologies) combined with a 5975C Inert MS system (Agilent Technologies). One microliter of sample was injected onto a DB35MS column in splitless mode using an inlet temperature of 270 °C7,26. The carrier gas was helium with a flow rate of 1 ml min−1. Upon injection, the GC oven was held at 100°C for 3 min and then ramped to 300 °C with a gradient of 2.5 °C min−1. The MS system was operated under electron impact ionization at 70 eV and a mass range of 100–650 amu was scanned. Isotopomer distributions were extracted from the raw ion chromatograms using a custom Matlab M-file, which applies consistent integration bounds and baseline correction to each ion27. In addition, we corrected for naturally occurring isotopes using the method of Fernandez et al28. For relative metabolite levels, the total ion count was normalized to the internal standards norvaline and glutarate and to the protein content7,26. To correct for enrichment dilution, we used previously reported methods7,29, i.e. we divided the fractional contribution of a labeled metabolite of interest by the fractional contribution of its precursor (calculated by the formula below).
The total contribution of carbon was calculated using the following equation7,29:
Herewith, “n” is the number of C atoms in the metabolite, “i” represents the different mass isotopomers and “m” refers to the abundance of a certain mass. Glycolytic carbon contribution was calculated based on [U-13C]-glucose labeling and label dilution in pyruvate7. For total metabolite levels, arbitrary units of the metabolite of interest were normalized to the protein content. A time-course experiment of the incorporation of [U-13C]-glucose, [U-13C]-glutamine and [U-13C]-palmitate in TCA intermediates demonstrated that the incorporation values reached a pseudo-isotopic steady state within experimental measurement precision (Extended Data Fig. 5). determination of dNTP levels by RT-PCR: dNTP levels were determined by using a fluorescence-based PCR assay30 using G1 sorted ECs, identified as CherryRed+ Venus− cells upon transduction with a FUCCI construct31. Determination of 13C-palmitate or 13C-acetate incorporation in UMP and UTP: Cells were labeled with [U-13C]-palmitate (100% labeling with 100 μM [U-13C]-palmitate; see above) or [U-13C]-acetate (20 mM supplementation with [U-13C]-acetate) for 48 hours and were then collected in 500 μl ice cold acetonitrile buffer (50% methanol, 30% acetonitrile and 20% water). Samples were spun for 5 min and supernatants were dried down and were then reconstituted in 50 μl of HPLC-grade water, vortexed, centrifuged, and transferred into HPLC vials. LC-MS/MS analysis was done on a Waters Xevo TQ-S mass spectrometry was coupled to an H-Class UPLC system. Metabolites were separated by polarity using Supelco Ascentis Express C18 column (2.7 μm particle size, 5 cm × 2.1 mm). LC parameters are as follows: autosampler temperature, 5 °C; injection volume, 5 μl; column temperature, 50 °C; flow rate over 11 min: t = 0, 0.4 ml/min; t = 2, 0.3 ml/min; t = 3, 0.25 ml/min; t = 5, 0.15 ml/min; t = 9, 0.4 ml/min; t = 11, 0.4 ml/min. The LC solvents were Solvent A: 10 mM tributylamine and 15 mM acetic acid in 97:3 water:methanol (pH 4.95); and Solvent B: methanol. Elution from the column was performed over 11 min with the following gradient: t = 0, 0% B; t = 1, 0% B; t = 2, 20% B; t = 3, 20% B; t = 5, 55% B; t = 8, 95% B; t = 8.5, 95% B, t = 9, 0% B; t = 11, 0% B. Mass spectra were acquired using negative-mode electrospray ionization operating in multiple reaction monitoring (MRM) mode. The capillary voltage was 3000 V, and cone voltage was 50 V. Nitrogen was used as cone gas and desolvation gas, with flow rates of 150 l/h and 600 l/h, respectively. The source temperature was 150 °C, and desolvation temperature was 500 °C. Argon was used as collision gas at a manifold pressure of 4.3 × 10⁻³ mbar. Collision energies and source cone potentials were optimized for each transition using Waters QuanOptimize software. Data were acquired and analyzed using MassLynx 4.1 and QuanLynx software. Isotope labeling data was corrected for the natural abundance of different isotopes using IsoCor32. determination of rNTP levels by LC-MS: rNTP extracted with the same method as described for UTP and UMP. Additionally, 13C-internal standard (generated by based on fully labeled yeast extracts33) were spiked into the extraction solution. rNTP concentrations were determined with the same LC-MS method as described for UTP and UMP. All samples were normalized to the 13C-internal standard and protein content.
Mouse models of ocular angiogenesis
Generation of EC specific CPT1a conditional knock out mice: For generation of the Cpt1alox/lox mice, loxP sites were introduced flanking a segment comprising exon 11 and 12 via homologous recombination in embryonic stem (ES) cells. The targeting vector contained from 5′ to 3′: a 3.5 kb 5′ homology flank, a 2 kb floxed mid flank consisting of the loxP flanked exon 11-12 segment, a FRT flanked neomycine resistance (NEO) cassette, a 2.5 kb 3′ homology flank. Correctly targeted ES clones were identified by appropriate Southern blot and PCR analysis, and subjected to transient transfection with a Flp recombinase expression plasmid to remove the FRT flanked NEO cassette. Correctly excised clones were used for morula aggregation, and resulting chimeric animals were bred for germline transmission, yielding Cpt1awt/lox and eventually Cpt1alox/lox mice. For postnatal EC-specific loss of function studies, VE-Cadherin(PAC)-CreERT2 mice34 (provided by R. Adams) were intercrossed with Cpt1alox/lox mice and named CPT1aΔEC. Correct Cre-mediated excision of the floxed Cpt1a segment in tamoxifen-treated CPT1aΔEC mice was confirmed via PCR analysis of genomic DNA using primers spanning the floxed region, by the appearance of a 300-bp band (Extended Data Fig. 1u). CPT1aΔEC mice were always compared with tamoxifen-treated Cre− Cpt1alox/lox littermates (denoted as WT). Analysis of postnatal retinal angiogenesis: Genetic endothelial cell specific inactivation of CPT1a in neonatal mice was achieved by intraperitoneal injection of 100 mg/kg Tamoxifen solution (Sigma T5648; dissolved in 1:10 EtOH:corn oil) once daily from postnatal day (P) 1 to P4 in CPT1aΔEC mice. Pharmacological blockade of FAO in neonatal C57BL/6 wild type mice (animal facility KULeuven) was achieved by treatment with 30-35 mg/kg etomoxir from P2 to P4. For detection of cell proliferation, EdU (Invitrogen) was injected 2 hours before dissection. At P5, pups were killed and eyes were enucleated, fixed with 4% PFA for 2h at 4°C and prepared for vascular analysis. As all animal treatments were done in baseline conditions, no randomization was required. Retinal whole mounts were prepared for vascular analysis as described4. Only litters for which the WT littermates (for CPT1aΔEC mice) or vehicle treated littermates (for etomoxir treated mice) reached normal outgrowth and body weight at P5 were included for analysis. Radial vascular area, branching points, and number of filopodia were analyzed on isolectin GS-IB4 stained retinas (see below) using the NIH Image J software package and Leica LASAF-MMAF morphometric analysis software (MetaMorph) (Leica Microsystems, Mannheim, Germany) with in-house developed macros. No statistical method was used to predetermine the sample size. Oxygen-induced retinopathy: Oxygen induced retinopathy (ROP) was induced by exposing C57BL/6 pups with their mother to 70% oxygen from P7-P1235. Pups were then returned to normoxia and injected daily with 30 mg/kg etomoxir or vehicle. At P17, pups were euthanized and eyes were enucleated, fixed in 4% PFA and retinal flatmounts were stained for isolectin B4, using previously published methods4. Mosaic images were captured using the inverted Leica DMI6000B epifluorescence microscope (Leica, Manheim, Germany) and analysis of the vascular tuft area was performed using NIH Image J software. For all mouse experiments, data analysis was done by experimentators blinded to the group allocation. All experimental animal procedures were approved by the Institutional Animal Care and Research Advisory Committee of the University of Leuven.
Immunohistochemistry
PFA fixed cell cultures (4% PFA except for CPT1a staining where 2% PFA was used), spheroids (4% PFA) or whole mount retinas (4% PFA) were subjected to immunofluorescence staining using the following isolectin conjugates or primary antibodies: isolectin GS-IB4-Alexa 488, isolectin GS-IB4-Alexa 568, isolectin GS-IB4-Alexa 647 (Molecular Probes), anti-CPT1a (Cell Signaling), anti-NG2 Chondroitin Sulfate Proteoglycan (Chemicon), anti-Tomm20 (Abcam) and anti-collagen IV (Southern Biotech). Alexa-488, -568 or -633 conjugated secondary antibodies were used (Molecular Probes). EdU, EU and HPG staining was performed using a Click-IT assay with Alexa fluor 555 according to manufacturer’s instructions.
Statistics
Data represent mean ± s.e.m. of pooled experiments unless otherwise stated. N values represent the number of independent experiments performed or the number of individual mice phenotyped. For each independent in vitro experiment, at least 3 technical replicates were used, except for the [U-13C]-palmitate incorporation analysis in cell lines (at least 2 technical replicates) (Fig. 6a). Statistical significance between groups was calculated using mixed model statistics (this test does not assume normality or equal variance) with experiment as random factor to correct for variation between umbilical donors (ECs were isolated from human umbilical cords) or mouse litters. SAS statistical software version 9.3 was used for statistical analysis. For comparison of ECs with other cell types, a one-sample t-test was used. Sample size for each experiment was not pre-determined. A p-value <0.05 was considered statistically significant.
Extended Data
Extended Data Figure 1. FAO regulates vessel sprouting.

a, mRNA expression of CPT1 isoforms (n=3). b, CPT1a mRNA levels upon CPT1a silencing (CPT1aKD) (n=11). c, Representative immunoblot of CPT1a for control and CPT1aKD ECs. d, FAO flux upon CPT1a silencing in venous (HUV) and arterial (HA) ECs, or upon small interference RNA transfection in venous ECs (siRNA) (n=6 for HUV shRNA, n=3 for HA shRNA and HUV siRNA). e, Schematic representation of FAO measurement using [9,10-3H]-palmitate (reproduced from Wang et al. with permission24). f, Representative immunoblot for CPT1a upon genetic silencing of CPT1a using siRNA (siCPT1a). g, FAO flux upon silencing of CPT1c (CPT1cKD) (n=3 independent p=NS). h, FAO flux levels in venous (HUV), arterial (HA) and microvascular (HMV) ECs (n=4 for HUV vs HA and n=3 for HUV vs HMV). i, Sprout number in control and CPT1aKD EC spheroids with mitomycin C (MitoC) treatment as indicated (n=3) j, Flow cytometry counting of viable control and CPT1aKD ECs (n=3). k, Analysis of random cell-motility tracks in control and CPT1aKD ECs (n=4; p=NS). l, FAO flux and proliferation upon silencing of ACADVL (ACADVLKD) (n=3 for each). m, Wound closure in control and ACADVLKD ECs (n=3; p=NS). n,o, Quantification of vessel sprouting in control and ACADVLKD EC spheroids with MitoC treatment as indicated, total sprout length (n) and sprout numbers per spheroid (o) (n=5). p, Sprout number in control and CPT1aOE EC spheroids with MitoC treatment as indicated (n=3). q, Total sprout length in control and CPT1aOE EC spheroids treated with MitoC as indicated (n=5). r,s, Representative phase contrast images of control (r) and CPT1aOE (s) EC spheroids. t, Scratch wound assay in control and CPT1aOE ECs treated with MitoC as indicated (n=3; p=NS). u, PCR analysis of genomic DNA from WT and CPT1aΔEC pups, confirming Cre-mediated recombination of the floxed Cpt1a allele as shown by the appearance of a 300 bp band. v, NG2+ area in neonatal vascular plexus of WT and CPT1aΔEC mice (3 litters, n=8 pups for WT and 7 pups for CPT1aΔEC; p=NS). Data are mean ± s.e.m of n independent experiments (a,b,d,g-q,t) or the total number of mice (v). Statistical test: mixed models. NS, not significant. *p<0.05, **p<0.01, ***p<0.001, ****p<0.0001.
Extended data Figure 2. CPT1a silencing does not cause cellular distress.

a, ADP/ATP ratio in control and CPT1aKD ECs (n=3; p=NS). b, Sprout number upon oligomycin treatment (oligo) in control and CPT1aKD EC spheroids (n=3). c, Glycolysis measurement in control and CPT1aKD ECs (n=3; p=NS). d, Representative immunoblot for phosphorylated AMPK (pAMPK) and total AMPK (AMPK) and for LC3b I and II in control and CPT1aKD ECs. The ratio of the densitometrically quantified bands of pAMPK/AMPK and LC3b II/I is shown below the blots (n=3; p=NS). e, Sprout number upon N-acetylcysteine (NAC) treatment in control and CPT1aKD EC spheroids (n=3). f,g, Representative images of EC spheroids upon staining for TO-PRO3 in control (f) and CPT1aKD spheroids (g). h,i, Representative pictures of Hoechst/cleaved caspase 3-stained control (h) and CPT1aKD (i) ECs. j, Representative immunoblots, showing the ratio of phosphorylated (pATM) / total-ATM (ATM), p21 / Lamin and p53 / Lamin in control and CPT1aKD ECs. The ratios of the densitometrically quantified bands are shown below the blots (n=3; p=NS). Data are mean ± s.e.m of n independent experiments (a-e,j). Statistical test: mixed models. NS, not significant. ****p<0.0001.
Extended data Figure 3. FAO is used for de novo nucleotide synthesis.

a, Schematic representation of the different carbon sources used for de novo synthesis of UMP. Note that palmitate contributes 3 carbons to the 9 carbons skeleton of UMP. PRPP: 5-phosphoribosyl-1-pyrophosphate. b, Sprout number upon 5-fluorouracil (5FU) treatment in control and CPT1aKD EC spheroids (n=4). c, Sprout number upon methotrexate (MTX) treatment in control and CPT1aKD EC spheroids (n=4). d, Sprout number upon acetate treatment in control and CPT1aKD EC spheroids (n=3). e-g, Representative images of EC spheroids upon acetate treatment. h,i, Rescue of the sprouting defect of CPT1aKD spheroids by acetate was not affected by oligomycin treatment; panel h: total sprout length; panel i: sprout numbers/spheroid (n=3; p=NS). j,k, Quantification of vessel sprouting using the EC spheroid model, showing that the reduction of total sprout length (j) and number of sprouts per spheroid (k) upon CPT1a silencing (CPT1aKD) was rescued by supplementation with a dNTP mix (n=3). l, Quantification of MitoC treated EC spheroid sprouting upon acetate or nucleoside mix supplementation (n=3; p=NS). m, Glucose oxidation in ECs, measured by 14CO2 formation from [6-14C]-glucose in control and CPT1aKD ECs (n=4). n, Glutamine oxidation in ECs, measured by 14CO2 formation from [U-14C]-glutamine in control and CPT1aKD ECs (n=4; p=NS). o, Total contribution of [U-13C]-glucose and [U-13C]-glutamine to aspartate in control and CPT1aKD ECs (n=3). p, [8-14C] hypoxanthine incorporation in RNA and DNA in control ECs (n=3). Data are mean ± s.e.m of n independent experiments (b-d,h-p). Statistical test: mixed models. NS, not significant. *p<0.05, **p<0.01, ****p<0.0001.
Extended data Figure 4. Etomoxir reduces vessel sprouting.

a, FAO flux upon etomoxir (eto) treatment (n=6). b, [3H]-thymidine incorporation upon etomoxir treatment (n=5). c, Scratch wound assay using MitoC-treated ECs upon etomoxir (eto) treatment (n=4; p=NS). d, Branch point quantification in the retinal vasculature of control (ctrl) and etomoxir-treated (eto) pups (8 litter, n=24 pups for control and 16 for etomoxir treatment). e,f, Representative confocal images of retinal vessels stained for isolectin-B4 in control (e) and etomoxir (f) treated pups. g, Filopodia quantification in the retinal vasculature front of control and etomoxir (eto) treated pups (4 litters, n=11 for WT and 9 for etomoxir; p=NS). Data are mean ± s.e.m of n independent experiments (a-d,g) or the total number of mice (d,g). Statistical test: mixed models. NS, not significant. ****p<0.0001.
Extended data Figure 5. Analysis of steady state.
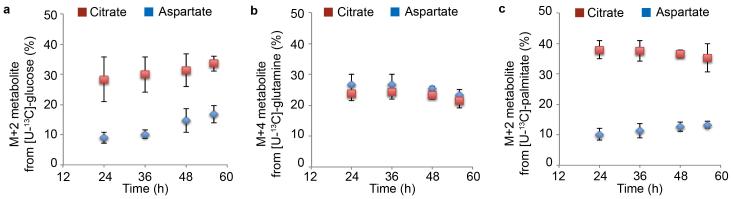
Percentage M+2 or M+4 citrate and aspartate over different timepoints (24, 36, 48 and 52 hours) after labeling with [U-13C]-glucose (a), [U-13C]-glutamine (b), or [U-13C]-palmitate (c). Data are mean ± s.d. of n=3 independent experiments.
shCPT1 RNA sequence 1: GCCATGAAGCTCTTAGACAAA
shCPT1 RNA sequence 2: CGATGTTACGACAGGTGGTTT
shACADVL RNA sequence: GCAGACATCTTCACGGTCTTT
siCPT1a RNA sequence (from IDT trifecta): AGCUCUUAGACAAAUC/AGAGAGAUAGAUUUGU
Acknowledgements
We thank Matthew Vander Heiden and David Tollervey for discussion, Ralf Adams for providing VE-Cadherin(PAC)-CreERT2 mice, and Sonsoles Rodríguez-Arístegui for synthesis of etomoxir. SS is funded by the Institution of Research / Innovation (IWT); RM, BG, ARC and JG by the Research Foundation Flanders (FWO); UB by a Marie Curie-IEF Fellowship; KCSQ by CAPES (Brasil) and GB by KU Leuven. The work of SMF is supported by Marie Curie CIG, FWO-OdysseusII, Concern Foundation, Bayer Healthcare Pharmaceuticals. The work of PC is supported by IUAP7/03, Methusalem funding (Flemish Government), FWO grants, Foundation Leducq Transatlantic Network (ARTEMIS), Foundation against Cancer, European Research Council (ERC) Advanced Research Grant (EU-ERC269073) and AXA Research grant. SYL was supported by the Department of Defense CDMRP Visionary Postdoctoral Award (W81XWH-12-1-0466). Views and opinions of, and endorsements by the authors do not reflect those of the US Army or the Department of Defense. The authors thank the MSU LC-MS Core.
Footnotes
Competing financial interests: PC declares to be named as inventor on patent applications, claiming subject matter related to the results described in this paper.
References
- 1.Potente M, Gerhardt H, Carmeliet P. Basic and therapeutic aspects of angiogenesis. Cell. 2011;146:873–887. doi: 10.1016/j.cell.2011.08.039. [DOI] [PubMed] [Google Scholar]
- 2.Ausprunk DH, Folkman J. Migration and proliferation of endothelial cells in preformed and newly formed blood vessels during tumor angiogenesis. Microvasc Res. 1977;14:53–65. doi: 10.1016/0026-2862(77)90141-8. [DOI] [PubMed] [Google Scholar]
- 3.Welti J, Loges S, Dimmeler S, Carmeliet P. Recent molecular discoveries in angiogenesis and antiangiogenic therapies in cancer. J Clin Invest. 2013;123:3190–3200. doi: 10.1172/JCI70212. [DOI] [PMC free article] [PubMed] [Google Scholar]
- 4.De Bock K, et al. Role of PFKFB3-Driven Glycolysis in Vessel Sprouting. Cell. 2013;154:651–663. doi: 10.1016/j.cell.2013.06.037. [DOI] [PubMed] [Google Scholar]
- 5.De Bock K, Georgiadou M, Carmeliet P. Role of endothelial cell metabolism in vessel sprouting. Cell Metab. 2013;18:634–647. doi: 10.1016/j.cmet.2013.08.001. [DOI] [PubMed] [Google Scholar]
- 6.Colavitti R, et al. Reactive oxygen species as downstream mediators of angiogenic signaling by vascular endothelial growth factor receptor-2/KDR. J Biol Chem. 2002;277:3101–3108. doi: 10.1074/jbc.M107711200. [DOI] [PubMed] [Google Scholar]
- 7.Fendt SM, et al. Reductive glutamine metabolism is a function of the alpha-ketoglutarate to citrate ratio in cells. Nat Commun. 2013;4:2236. doi: 10.1038/ncomms3236. [DOI] [PMC free article] [PubMed] [Google Scholar]
- 8.Vander Heiden MG. Exploiting tumor metabolism: challenges for clinical translation. J Clin Invest. 2013;123:3648–3651. doi: 10.1172/JCI72391. [DOI] [PMC free article] [PubMed] [Google Scholar]
- 9.Thompson CB. Wnt meets Warburg: another piece in the puzzle? EMBO J. 2014;33:1420–1422. doi: 10.15252/embj.201488785. [DOI] [PMC free article] [PubMed] [Google Scholar]
- 10.Carracedo A, Cantley LC, Pandolfi PP. Cancer metabolism: fatty acid oxidation in the limelight. Nat Rev Cancer. 2013;13:227–232. doi: 10.1038/nrc3483. [DOI] [PMC free article] [PubMed] [Google Scholar]
- 11.Henry TD, Satran D, Jolicoeur EM. Treatment of refractory angina in patients not suitable for revascularization. Nat Rev Cardiol. 2014;11:78–95. doi: 10.1038/nrcardio.2013.200. [DOI] [PubMed] [Google Scholar]
- 12.Morris GW, Iams TA, Slepchenko KG, McKee EE. Origin of pyrimidine deoxyribonucleotide pools in perfused rat heart: implications for 3′-azido-3′-deoxythymidine-dependent cardiotoxicity. Biochem J. 2009;422:513–520. doi: 10.1042/BJ20082427. [DOI] [PubMed] [Google Scholar]
- 13.Fairbanks LD, Bofill M, Ruckemann K, Simmonds HA. Importance of ribonucleotide availability to proliferating T-lymphocytes from healthy humans. Disproportionate expansion of pyrimidine pools and contrasting effects of de novo synthesis inhibitors. J Biol Chem. 1995;270:29682–29689. [PubMed] [Google Scholar]
- 14.Lunt SY, et al. Pyruvate kinase isoform expression alters nucleotide synthesis to impact cell proliferation. Mol Cell. 2015;57:95–107. doi: 10.1016/j.molcel.2014.10.027. [DOI] [PMC free article] [PubMed] [Google Scholar]
References unique to the Methods section
- 15.Cheung EC, et al. TIGAR is required for efficient intestinal regeneration and tumorigenesis. Dev Cell. 2013;25:463–477. doi: 10.1016/j.devcel.2013.05.001. [DOI] [PMC free article] [PubMed] [Google Scholar]
- 16.Jaffe EA, Nachman RL, Becker CG, Minick CR. Culture of human endothelial cells derived from umbilical veins. Identification by morphologic and immunologic criteria. J Clin Invest. 1973;52:2745–2756. doi: 10.1172/JCI107470. [DOI] [PMC free article] [PubMed] [Google Scholar]
- 17.Michieli P, et al. Targeting the tumor and its microenvironment by a dual-function decoy Met receptor. Cancer cell. 2004;6:61–73. doi: 10.1016/j.ccr.2004.05.032. [DOI] [PubMed] [Google Scholar]
- 18.Carlotti F, et al. Lentiviral vectors efficiently transduce quiescent mature 3T3-L1 adipocytes. Mol Ther. 2004;9:209–217. doi: 10.1016/j.ymthe.2003.11.021. [DOI] [PubMed] [Google Scholar]
- 19.Geudens I, et al. Role of delta-like-4/Notch in the formation and wiring of the lymphatic network in zebrafish. Arterioscler Thromb Vasc Biol. 2010;30:1695–1702. doi: 10.1161/ATVBAHA.110.203034. [DOI] [PMC free article] [PubMed] [Google Scholar]
- 20.Korff T, Krauss T, Augustin HG. Three-dimensional spheroidal culture of cytotrophoblast cells mimics the phenotype and differentiation of cytotrophoblasts from normal and preeclamptic pregnancies. Exp Cell Res. 2004;297:415–423. doi: 10.1016/j.yexcr.2004.03.043. [DOI] [PubMed] [Google Scholar]
- 21.Schoors S, et al. Partial and Transient Reduction of Glycolysis by PFKFB3 Blockade Reduces Pathological Angiogenesis. Cell Metab. 2014;19:37–48. doi: 10.1016/j.cmet.2013.11.008. [DOI] [PubMed] [Google Scholar]
- 22.Carmeliet P, et al. Synergism between vascular endothelial growth factor and placental growth factor contributes to angiogenesis and plasma extravasation in pathological conditions. Nat Med. 2001;7:575–583. doi: 10.1038/87904. [DOI] [PubMed] [Google Scholar]
- 23.Dagher Z, Ruderman N, Tornheim K, Ido Y. Acute regulation of fatty acid oxidation and amp-activated protein kinase in human umbilical vein endothelial cells. Circ Res. 2001;88:1276–1282. doi: 10.1161/hh1201.092998. [DOI] [PubMed] [Google Scholar]
- 24.Wang R, et al. The transcription factor Myc controls metabolic reprogramming upon T lymphocyte activation. Immunity. 2011;35:871–882. doi: 10.1016/j.immuni.2011.09.021. [DOI] [PMC free article] [PubMed] [Google Scholar]
- 25.Aragones J, et al. Deficiency or inhibition of oxygen sensor Phd1 induces hypoxia tolerance by reprogramming basal metabolism. Nat Genet. 2008;40:170–180. doi: 10.1038/ng.2007.62. [DOI] [PubMed] [Google Scholar]
- 26.Fendt SM, et al. Metformin decreases glucose oxidation and increases the dependency of prostate cancer cells on reductive glutamine metabolism. Cancer Res. 2013;73:4429–4438. doi: 10.1158/0008-5472.CAN-13-0080. [DOI] [PMC free article] [PubMed] [Google Scholar]
- 27.Antoniewicz MR, Kelleher JK, Stephanopoulos G. Elementary metabolite units (EMU): a novel framework for modeling isotopic distributions. Metab Eng. 2007;9:68–86. doi: 10.1016/j.ymben.2006.09.001. [DOI] [PMC free article] [PubMed] [Google Scholar]
- 28.Fernandez CA, Des Rosiers C, Previs SF, David F, Brunengraber H. Correction of 13C mass isotopomer distributions for natural stable isotope abundance. J Mass Spectrom. 1996;31:255–262. doi: 10.1002/(SICI)1096-9888(199603)31:3<255::AID-JMS290>3.0.CO;2-3. [DOI] [PubMed] [Google Scholar]
- 29.Nanchen A, Fuhrer T, Sauer U. Determination of metabolic flux ratios from 13C-experiments and gas chromatography-mass spectrometry data: protocol and principles. Methods Mol Biol. 2007;358:177–197. doi: 10.1007/978-1-59745-244-1_11. [DOI] [PubMed] [Google Scholar]
- 30.Wilson PM, et al. A novel fluorescence-based assay for the rapid detection and quantification of cellular deoxyribonucleoside triphosphates. Nucl Acids Res. 2011;39:e112. doi: 10.1093/nar/gkr350. [DOI] [PMC free article] [PubMed] [Google Scholar]
- 31.Sakaue-Sawano A, et al. Visualizing spatiotemporal dynamics of multicellular cell-cycle progression. Cell. 2008;132:487–498. doi: 10.1016/j.cell.2007.12.033. [DOI] [PubMed] [Google Scholar]
- 32.Millard P, Letisse F, Sokol S, Portais JC. IsoCor: correcting MS data in isotope labeling experiments. Bioinformatics. 2012;28:1294–1296. doi: 10.1093/bioinformatics/bts127. [DOI] [PubMed] [Google Scholar]
- 33.Buscher JM, Czernik D, Ewald JC, Sauer U, Zamboni N. Cross-platform comparison of methods for quantitative metabolomics of primary metabolism. Anal Chem. 2009;81:2135–2143. doi: 10.1021/ac8022857. [DOI] [PubMed] [Google Scholar]
- 34.Benedito R, et al. The notch ligands Dll4 and Jagged1 have opposing effects on angiogenesis. Cell. 2009;137:1124–1135. doi: 10.1016/j.cell.2009.03.025. [DOI] [PubMed] [Google Scholar]
- 35.Scott A, Fruttiger M. Oxygen-induced retinopathy: a model for vascular pathology in the retina. Eye. 2010;24:416–421. doi: 10.1038/eye.2009.306. [DOI] [PubMed] [Google Scholar]