Abstract
Cancers emerge from an on-going Darwinian evolutionary process, often leading to multiple competing subclones within a single primary tumour1-4. This evolutionary process culminates in the formation of metastases, which is the cause of 90% of cancer-related deaths5. However, despite its clinical importance, little is known about the principles governing the dissemination of cancer cells to distant organs. Although the hypothesis that each metastasis originates from a single tumour cell is generally supported6-8, recent studies using mouse models of cancer demonstrated the existence of polyclonal seeding from and inter-clonal cooperation between multiple subclones9,10. In this study, we sought definitive evidence for the existence of polyclonal seeding in human malignancy and to establish the clonal relationship among different metastases in the context of androgen-deprived metastatic prostate cancer. Using whole genome sequencing, we characterised multiple metastases arising from prostate tumours in ten patients. Integrated analyses of subclonal architecture revealed the patterns of metastatic spread in unprecedented detail. Metastasis-to-metastasis spread was found to be common, either through de novo monoclonal seeding of daughter metastases or, in five cases, through the transfer of multiple tumour clones between metastatic sites. Lesions affecting tumour suppressor genes usually occur as single events, whereas mutations in genes involved in androgen receptor signalling commonly involve multiple, convergent events in different metastases. Our results elucidate in detail the complex patterns of metastatic spread and further our understanding of the development of resistance to androgen deprivation therapy in prostate cancer.
To characterise the subclonal architecture of androgen-deprived metastatic prostate cancer, we performed whole genome sequencing (WGS) of 51 tumours from 10 patients to an average sequencing depth of 55X, including multiple metastases from different anatomic sites in each patient and, in 5 cases, the prostate tumour (Supplementary Table 1). We identified a set of high-confidence substitutions, insertions/deletions, genomic rearrangements and copy number changes present in each tumour sample (Extended Data Figure 1 and Supplementary Information, Section 3). To portray the populations of tumour cells within each patient, we employed an n-dimensional Bayesian Dirichlet process to group clonal and subclonal mutations, i.e. those mutations present in all or a fraction of tumour cells within a sample, respectively. The fraction of tumour cells carrying each mutation was calculated from the mutant allele fraction, taking into account the tumour purity and local copy number state, as described previously2,11. Each of the mutations assigned to a single cluster is present in a fixed proportion of cells in each sample and hence belongs to a separate subclone, i.e. a genetically distinct population of cells.
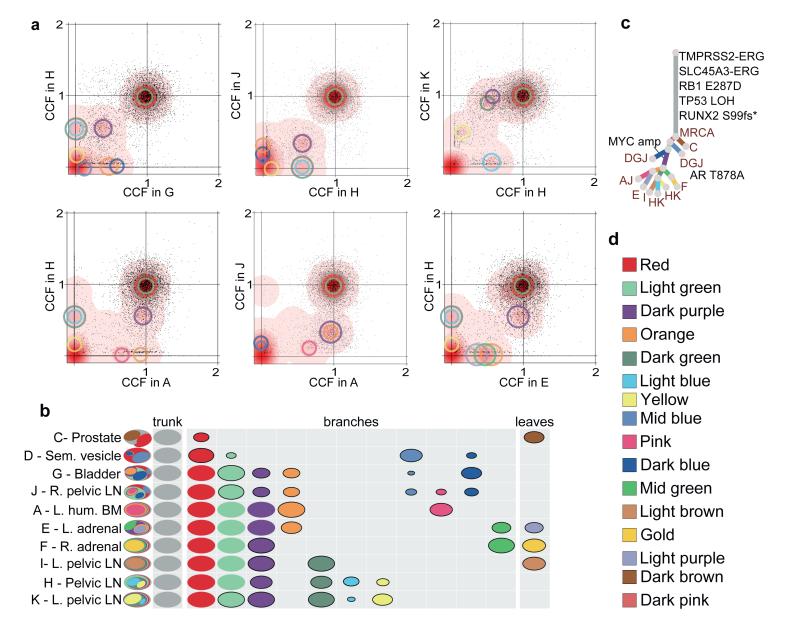
By plotting the cancer cell fractions of mutations from pairs of samples, we determined the clonal relationship between the constituent subclones and found evidence for polyclonal seeding of metastases, the most striking example of which is seen in patient A22 (Figure 1). Each of the plots in Figure 1a contains a cluster of mutations at (1,1), indicative of truncal mutations that were present in the most recent common ancestor (MRCA) of both metastases. However, in many of the plots, there are additional clusters at subclonal proportions in both samples plotted. For example, the cluster of mutations indicated by the purple circles in Figure 1a are present in 40% of cells in A22-G, 62% of cells in A22-H, 37% of cells in A22-J and 92% of cells in A22-K. A metastasis seeded by a single cell must carry a set of mutations present in all tumour cells, representing the complement of lesions in that founding cell. In some cases, this set of mutations will be subclonal in the originating site. However, mutation clusters present subclonally in two or more samples can only occur as the result of multiple seeding events by two or more genotypically distinct cells. A graphic illustration of the clonal and subclonal clusters and their representation in all of the 10 samples from A22 is shown in Figure 1b. Where one subclone is present in the same or a lower fraction of cells than a second subclone in all samples, the subclones are represented as nested ovals when required by the pigeonhole principle (Supplementary Information, Section 4b). In contrast, clusters whose relative cancer cell fractions are reversed in different samples represent branching subclones and are shown as disjoint ovals. The full lineage relationship between the subclones can be depicted in the form of a phylogenetic tree whose branch lengths are proportional to the number of substitutions in the corresponding subclone (Figure 1c).
Figure 1. n-D Dirichlet process clustering reveals widespread polyclonal seeding in A22.
(a) For pairs of metastases, cancer cell fractions (CCF), i.e. the fraction of cells within a sample containing a mutation, are plotted for all the substitutions detected in the WGS data. Red density areas off the axes and with CCF >0 and <1 reveal the existence of mutation clusters present at subclonal levels in more than one metastatic site. Mutation clusters for each sample are indicated with circles coloured according to the subclone they correspond to (Supplementary Table 3). The centre of each circle is positioned at the CCF values of the subclone in the two samples. The clusters at (1,1) correspond to the mutations present in all the cells in both sites (CCF=1) while those on axes refer to sample-specific subclones. For example, light blue and dark green clusters absent from sample A are positioned on the y-axis when H is compared to A but are moved to (0.60,0.08) and (0.60,0.88) when H is compared to K. (b) Each subclone detected in A22 is represented as a set of colour-coded ovals across all organ sites (Supplementary Table 3). Each row represents a sample, with ovals in the far left column nested if required by the pigeonhole principle (SI). The area of the ovals is proportional to the CCF of the corresponding subclone. Subclonal mutation clusters are shown with solid borders. Oval plots are divided into three types: trunk (CCF=1 in all samples), leaf (specific to a single sample) and branch (present in >1 sample and either not found in all samples or subclonal in at least one). (c) Phylogenetic tree showing the relationships between subclones in A22. Branch lengths are proportional to the number of substitutions in each cluster. Branches are annotated with samples in which they are present and with oncogenic/putative oncogenic alterations assigned to that subclone (LOH: Loss of Heterozygosity). (d) Subclone colour key.
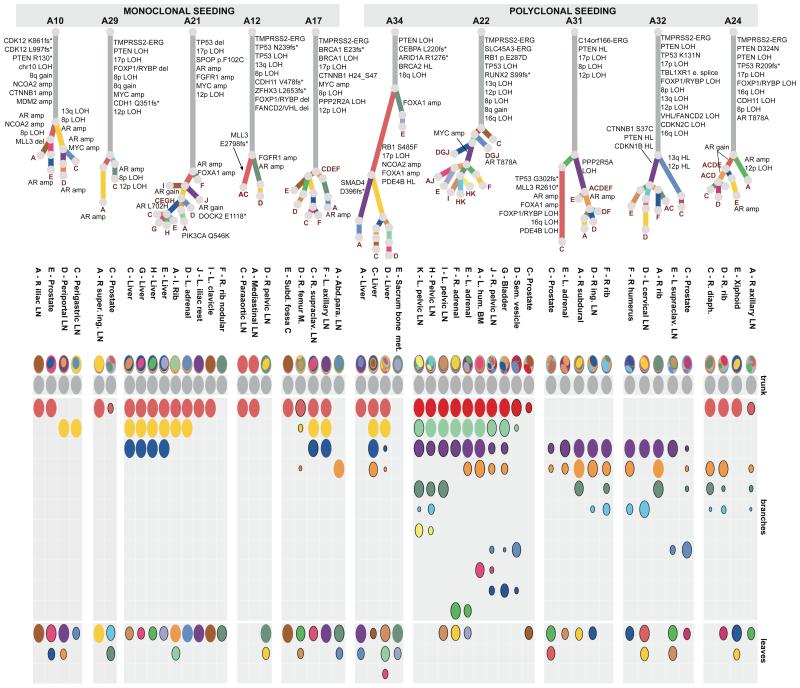
In 5/10 cases (A34, A22, A31, A32, A24), we found clusters of mutations present subclonally across multiple metastases, suggesting that polyclonal seeding between different organ sites is a common occurrence in metastatic prostate cancer (Figure 2). Mutations selected from these clusters (181-429 mutations per patient) were validated by deep sequencing (median coverage 471X) of additional aliquots of DNA from each WGS sample and extra metastatic and/or prostate samples, confirming these findings (Extended Data Figures 2-7, Extended Data Table 1 and Supplementary Information, Section 4e).
Figure 2. Subclonal structure within 10 metastatic lethal prostate cancers.
All the subclones identified in the whole genome sequenced samples are shown as phylogenetic trees and oval plots (as described in Figure 1). Patients with polyclonal seeding (A34, A22, A31, A32 and A24) are on the right (amp: amplification).
Analysis of known driver events found in the subclones provides important insights into polyclonal spread of prostate cancer during therapy. Androgen-deprivation therapy (ADT) is the standard of care for metastatic prostate cancer and initially induces tumour regression in most patients. However, ADT inevitably results in castration-resistance through various mechanisms, including androgen receptor (AR) amplification, increased AR sensitivity as a result of mutation, AR phosphorylation and bypass of the AR pathway12,13. It is currently unknown whether castration resistance is generally acquired via a single event or more commonly appears in multiple cells independently. Two of the subclones implicated with polyclonal seeding in A22 carry different oncogenic alterations associated with ADT resistance, suggesting that clonal expansion has been driven by distinct resistance mechanisms: MYC amplification14 in the purple cluster and a pathogenic AR substitution15 in the mid blue cluster. Overall, in all five patients with polyclonal seeding, subclones carrying either alterations in AR or genes involved in AR signalling (such as FOXA1), or alternative mechanisms of castration resistance such as MYC amplification and CTNNB1 mutation16, were found to have re-seeded multiple sites. This suggests that the tumour cell populations with a significant survival advantage are not confined within the boundaries of an organ site but can successfully spread to and reseed other sites (Figure 2).
Precise relationships between metastatic sites reveal the patterns of metastasis-tometastasis seeding. In all 7 cases for which the prostate tumour was sequenced (A10, A22, A29, A31 and A32; by targeted deep sequencing in A21 and A34), multiple metastases were more closely related to each other than any of them were to the primary tumour (Figure 2; Extended Data Figures 2-5 and 7; Supplementary Information, Section 4e). In the 5 cases with polyclonal seeding, this relationship resulted from multiple subclones shared subclonally by different metastases, raising the possibility of interclonal co-operativity, in agreement with recent studies using mouse models10,17, or remodelling of metastatic niches by initial colonising prostate cancer clones, making them attractive habitats that other clones can colonise later18. Further, for those patients where multiple metastases from the same tissue type were analysed (A22, A34, A21), metastases located in the same tissue are more closely related than those in different tissues, as previously observed in pancreatic cancer19. Intriguingly, samples within close physical proximity were often more similar to each other than to more distant samples. This raises the question whether the similarity between metastases in the same tissue type arises as a result of geographical proximity or from tissue-specific seeding.
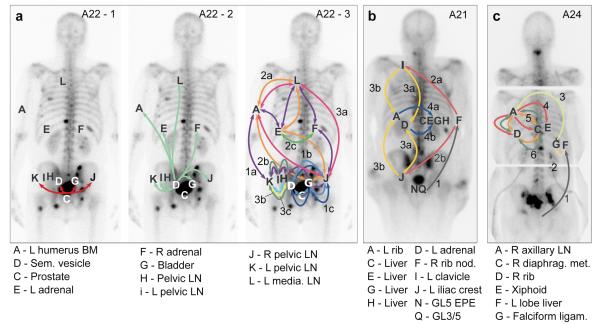
In order to explore further the relationships between samples, we considered the order of acquisition of mutations. Starting from the MRCA, we observe the accumulation of additional clusters of mutations representing subsequent ‘selective sweeps’20. Phylogenetic trees give clear pictures of the order of events, allowing the creation of ‘body maps’ that represent emergence and movement of clones from one site to another (Figure 3). The observed representation of subclones across different sites may be explained by two different patterns of spread: linear and branching. A22 demonstrates both patterns (Figure 3a). The red and light green subclones are present in all metastases and indicate linear spread from the prostate to the seminal vesicle and thence to the remaining metastases. The remaining inter-site subclones have a more complex pattern demonstrating the emergence of branching lineages, each with demonstrated metastasis-to-metastasis seeding. The stepwise accumulation of clonal mutations in A21, on the other hand, displays a simple linear pattern of metastasis-to-metastasis spread (Figure 3b). Finally, in A24, a period of sequential metastasis-to-metastasis spread was followed by parallel polyclonal spread of subclones between multiple metastases (Figure 3c). Overall, these patterns of seeding from one metastasis to the next are seen in 8 of the 10 patients (all but A12 and A29). We cannot formally exclude an alternative explanation for the observed patterns, that each of these metastases has seeded from an undetected subclone in the primary tumour. However, targeted re-sequencing of a subset of mutations failed to detect any such subclones, despite a median sequencing depth of 471X (Supplementary Information, Section 4e).
Figure 3. Metastasis-to-metastasis seeding occurs either by a linear or a branching pattern of spread.
Body maps show the seeding of all tumour sites from (a) A22, (b) A21 and (c) A24. Sites shown include samples subject to targeted sequencing (A22-L, A24-F, A24-G) in addition to WGS samples. Seeding events are represented with arrows colour-coded according to Supplementary Table 3 and with double-heads when seeding could be in either direction. When the sequence of events may be ordered from the acquisition of mutations, arrows are numbered chronologically. Subclones on branching clonal lineages are labelled with the same number but with different letters, e.g. 4a & 4b. See Supplementary Information Section 4e for a detailed discussion of the body map in these cases.
Mutations found subclonally in the prostate tumour but clonally in all metastases expose the metastasizing subclone in four cases: A22, A29, A31 and A32. In each of these patients, phylogenetic reconstruction indicates that the metastases are derived from a minor subclone, encompassing <50% of tumour cells. In three cases (A32, A10 and A34), more than one subclone from the primary tumour was involved in seeding of metastases, indicating that multiple subclones achieved metastatic potential (Supplementary Information, section 4e). In the case of A31 and A32, driver alterations that could confer selective advantage on the metastasising subclone(s) were identified (Figure 2). In A32, both copies of TP53 as well as one copy of PTEN, RB1 and CDKN1B21 were inactivated early in tumour evolution (Figure 2). Additional aberrations occurred separately in the purple and mid blue subclones to achieve homozygous inactivation of these tumour suppressor genes via independent mechanisms (Supplementary Information, section 4e). In A31, a PPP2R5A deletion and an AR duplication occurred in the metastasising subclones (purple or orange) while, interestingly, the pink cluster, displaying many important oncogenic alterations including events affecting TP53 and MLL3, showed no evidence of metastatic spread (Figure 2, Extended data Figures 3a and 8a).
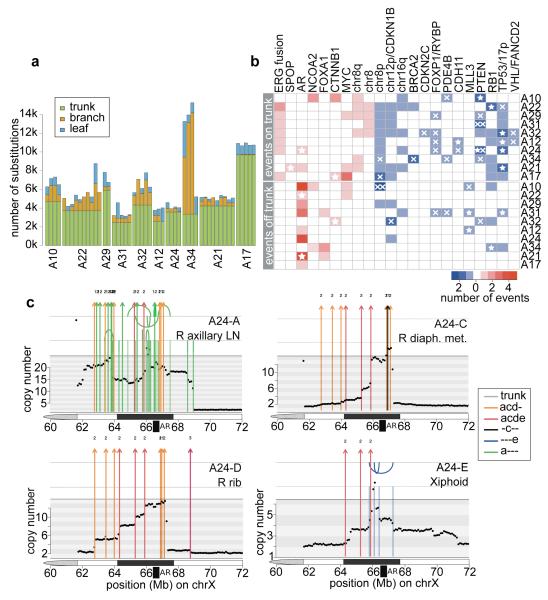
Annotation of oncogenic/putative oncogenic alterations (Supplementary Information, section 4c; Supplementary Table 2; Extended Data Table 2) on the phylogenetic trees provides some insight into the sequence of oncogenic events that take place during metastatic progression under ADT. The tumour cells in each patient share a common clonal origin (Figure 2, grey clusters). In all patients but one (A34), this mother clone represents the largest cluster of mutations (range 40-90% of all mutations) and contains the majority of driver mutations (Figures 2 and 4a-b) similar to previous observations in pancreatic cancer22. In contrast, oncogenic alterations disrupting genes important for AR signalling were rarely on the trunk. All patients had at least one alteration directly affecting the AR locus or genes involved in AR signalling, with widespread heterogeneity and convergent evolution observed across multiple samples from the same patient.
Figure 4. Drivers of tumorigenesis are truncal while drivers of castration resistance are convergent.
(a) Proportion of trunk, branch and leaf mutations in each sample. (b) Heatmap of oncogenic alterations present on the trunk (top) or off the trunk, i.e. on branches or leaves (bottom). Alterations in oncogenes and tumour suppressors are shown in red and blue, respectively, with shade indicating the number of events in that patient. Focal deletions and substitutions/indels are shown with crosses and stars, respectively. Double crosses indicate homozygous deletions resulting from deletions of both alleles. (c) Continuous selective pressure on AR signalling is observed in the form of multiple rearrangements resulting in multiple copy number increases at the AR locus within the same patient. Chromosomal rearrangements are plotted on top of the genome-wide copy number for each of the 4 WGS samples from A24. Rearrangements are coloured according to the colour code in Supplementary Table 3. Arcs above and below the top vertical line indicate deletion and tandem duplication events, while arcs above and below the second vertical line are head-to-head and tail-to-tail inversions, respectively.
In the great majority of cases, aberrations in AR signalling seem to have occurred after metastatic spread, although A21 and A24 are exceptions. The former has a large tandem duplication including the AR locus present in all samples, suggesting this was an early event. The latter harbours a truncal T878A mutation, which was also detected in two additional metastases (A24-F and A24-G, interrogated by targeted sequencing). Interestingly, though, a series of complex rearrangements between chromosomes 2 and X resulting in AR amplification was not detected in these samples (Figure 4c). Since such amplification is selected for by ADT23, it is likely that spread from the falciform ligament (A24-G) to the right axillary lymph node (A24-A) took place after ADT, which commenced 2 years and 9 months prior to death (Figure 3c). Across the whole cohort, only one out of 17 AR amplifications was truncal, with the remainder present only in a subset of metastases. Furthermore, in five patients, copy number had increased on more than one occasion within the same sample (Figure 4c and Extended Data Figure 8) implying continuous selective pressure on the AR pathway, in line with recent reports of persistent AR signalling in castration resistant prostate cancer15.
Our analyses allow us to view with unprecedented clarity the genomic evolution of metastatic prostate cancer, from initial tumorigenesis through the acquisition of metastatic potential to the development of castration resistance. A picture emerges of a diaspora of tumour cells, sharing a common heritage, spreading from one site to another, while retaining the genetic imprint of their ancestors. After a long period of development prior to the most recent complete selective sweep, metastasis usually occurs in the form of spread between distant sites, rather than as separate waves of invasion directly from the primary tumour. This observation supports the ‘seed and soil’ hypothesis in which rare subclones develop metastatic potential within the primary tumour7, rather than the theory that metastatic potential is a property of the primary tumour as a whole24,25. Transit of cells from one host site to another is relatively common, either as monoclonal metastasis-tometastasis seeding or as polyclonal seeding. Clonal diversification occurs within the constraining necessity to bypass ADT, driving distinct subclones towards a convergent path of therapeutic resistance. However, the resulting resistant subclones are not constrained to a single host site. Rather, a picture emerges of multiple related tumour clones competing for dominance across the entirety of the host.
Extended Data
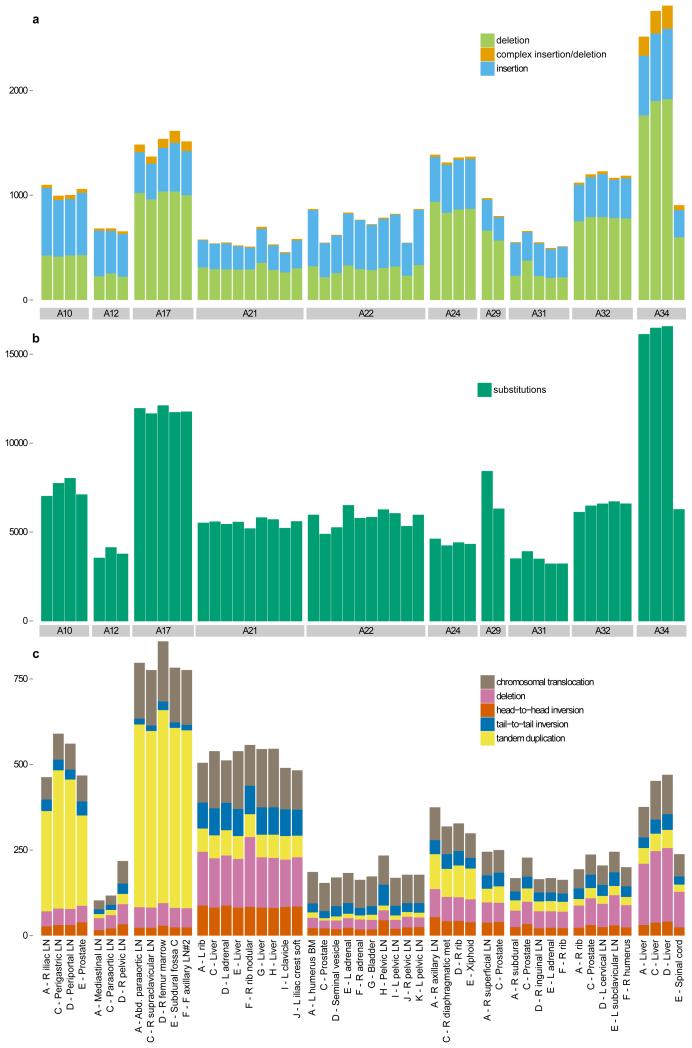
Extended Data Figure 1. Variants identified in 51 whole-genome sequenced samples from 10 patients.
Number of (a) insertion/deletions, (b) high-confidence substitutions and (c) chromosomal rearrangements are plotted across all the samples from the 10 patients that were whole-genome sequenced.
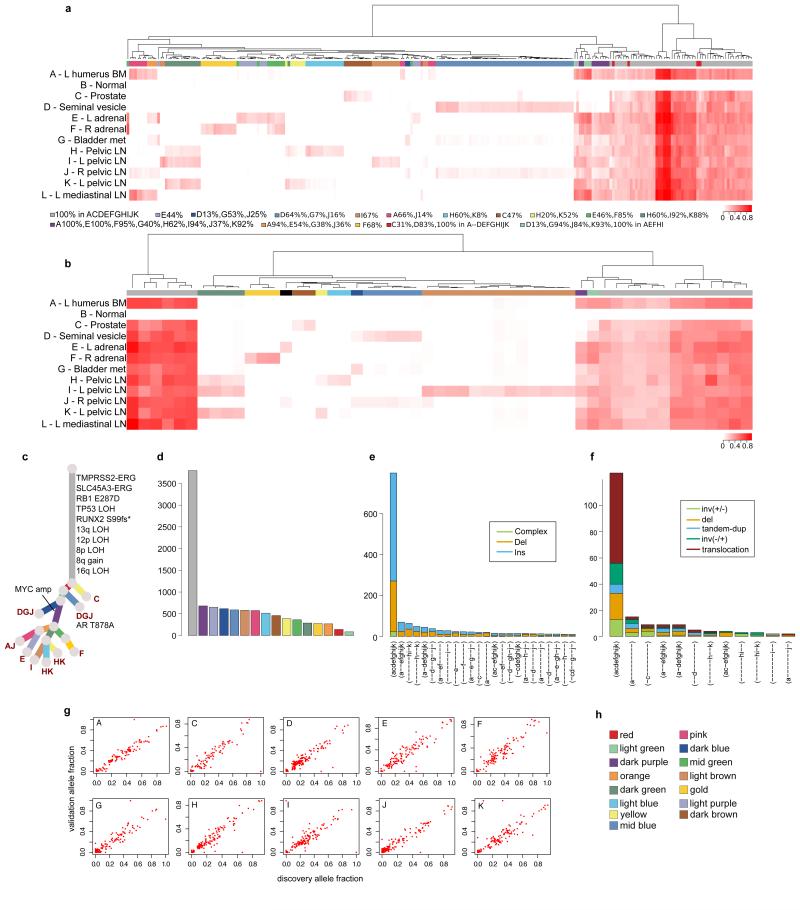
Extended Data Figure 2. Validation of the subclonal hierarchies in A22.
The primary means of validation was a deep sequencing validation experiment that included selected substitutions and indels from each sample, as described in Extended Data Table 2 and Supplementary Information, section 2b. In addition, indels and rearrangements identified in WGS represent datasets orthogonal to the substitution data from which the subclones were identified. The subsets of samples in which validated substitutions, indels and rearrangements are found correlate strongly with the subclonal clusters identified from the clustering of substitutions from WGS, providing support for the existence of these subclones. For each patient, hierarchical clustering of the variant allele fraction (VAF) was performed separately for substitutions (a) and indels (b). VAFs are represented as a heatmap with deeper shades of red indicating a higher proportion of reads reporting the mutant allele. Above each heatmap, mutations are colour-coded according to the subclone they were assigned to by Dirichlet process clustering of WGS data in the case of substitutions or by VAF for indels. Indels that could not be assigned to any cluster are annotated with black. For A22, additional samples not subject to WGS were included in the validation experiment. For these patients the phylogenetic tree from Figure 2 was modified to incorporate these additional samples (c). Number of substitutions assigned to each subclone (d) and numbers of indels (e) and rearrangements (f) present in different subsets of samples are plotted as bar charts. VAFs from WGS and validation data, plotted as scatter plots (g), are very highly correlated. Subclone colour key (h).
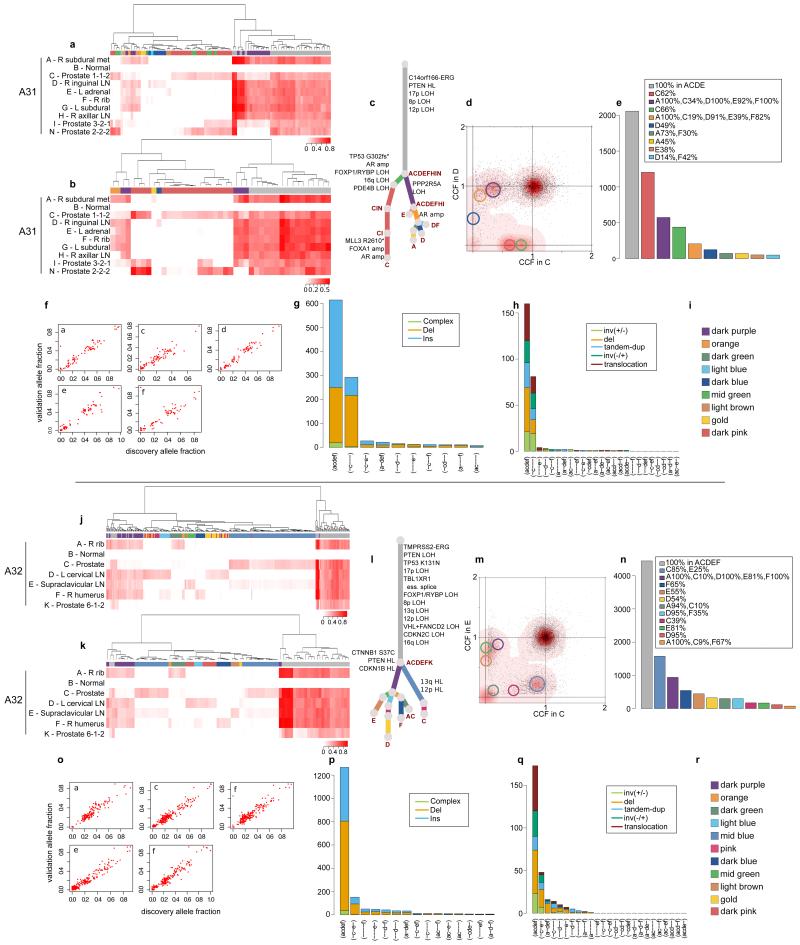
Extended Data Figure 3. Validation of the subclonal hierarchies in A31 and A32.
Validation strategy as described in Extended Data Figure 2. For A31 and A32, hierarchical clustering of the VAF was performed separately for substitutions (a) and (j) and indels (b) and (k). Heatmaps are annotated as described in Extended Data Figure 2. Additional samples for A31 and A32 are incorporated into the phylogenetic trees (c) and (l). Subclones for A31 CD and A32 CE are annotated in the corresponding 2d-DP plots (d) and (m). Numbers of substitutions in WGS data assigned to each subclone are plotted in (e) and (n). VAFs from WGS and validation data, plotted as scatter plots (f) and (o), are very highly correlated. Number of indels (g) and (p) and rearrangements (h) and (q) present in different subsets of samples are plotted as bar charts. Subclone Colour keys for A31 and A32 (i and r) respectively.
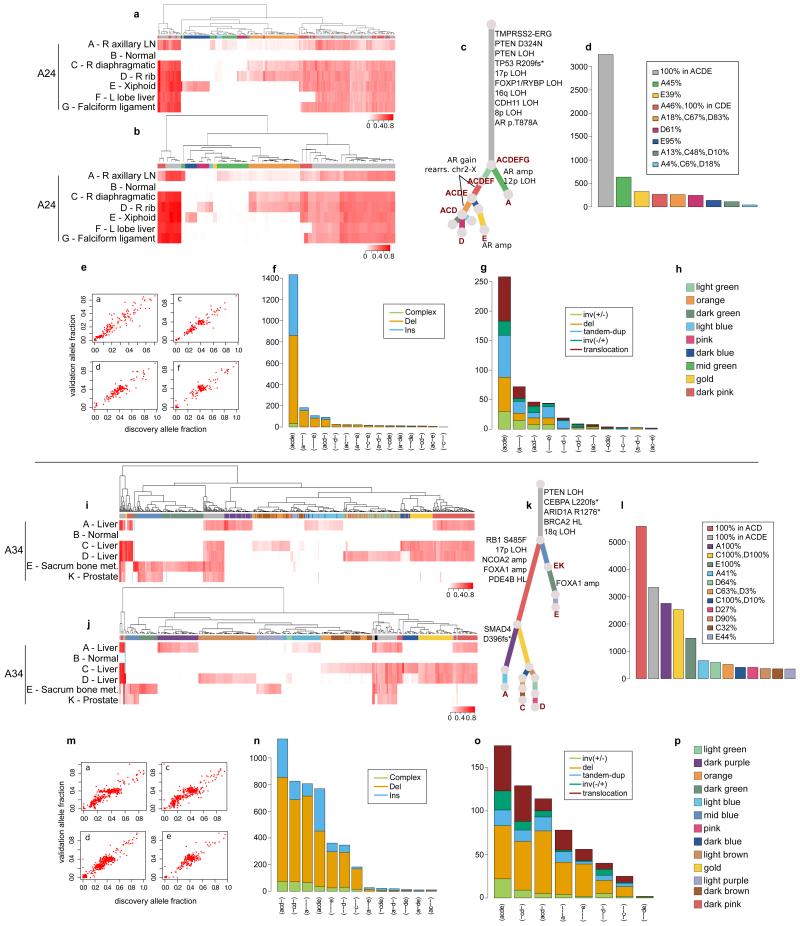
Extended Data Figure 4. Validation of the subclonal hierarchies in A24 and A34.
Validation strategy as described in Extended Data Figure 2. For A24 and A34, hierarchical clustering of the VAF was performed separately for substitutions (a) and (i) and indels (b) and (j). Heatmaps are annotated as described in Extended Data Figure 2. Indels that could not be assigned to any cluster (if any) are annotated with black. Additional samples for A24 and A34 are incorporated into the phylogenetic tree (c) and (k). The additional cluster in A24, supported by rearrangements only, is indicated by a light green branch in the tree. Numbers of substitutions in WGS data assigned to each subclone are plotted in (d) and (l). VAFs from WGS and validation data, plotted as scatter plots (e) and (m), are very highly correlated. Number of indels (f) and (n) and rearrangements (g) and (o) present in different subsets of samples are plotted as bar charts. Subclone Colour keys for A24 and A34 (h and p) respectively.
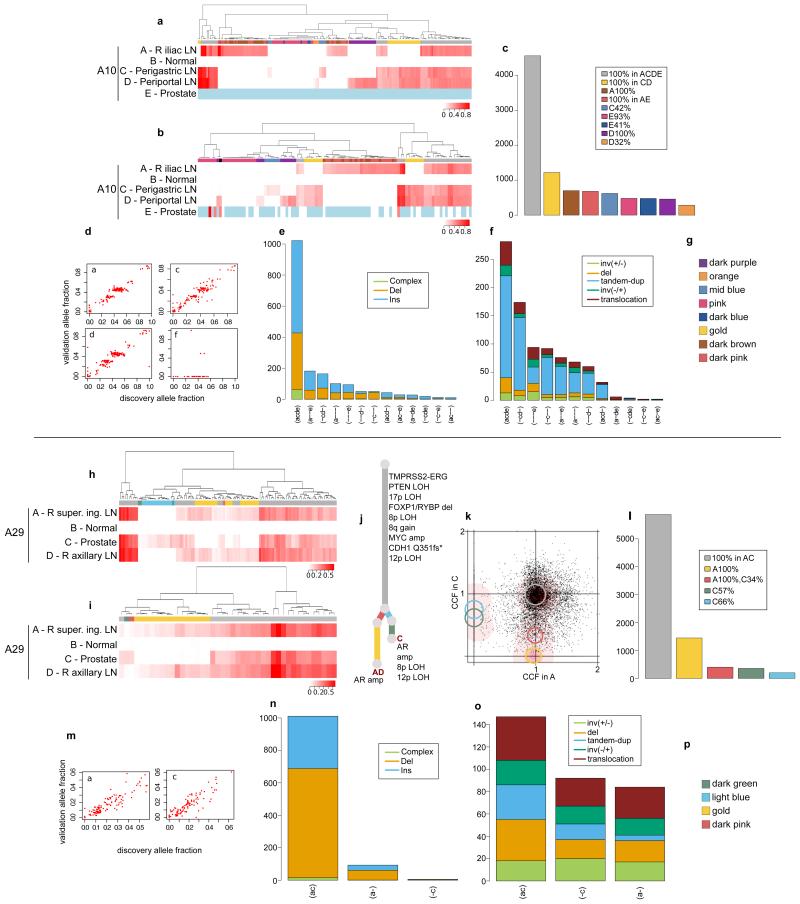
Extended Data Figure 5. Validation of the subclonal hierarchies in A10 and A29.
Validation strategy as described in Extended Data Figure 2. For A10 and A29, hierarchical clustering of the VAF was performed separately for substitutions (a) and (h) and indels (b) and (i). Heatmaps are annotated as described in Extended Data Figure 2. Indels that could not be assigned to any cluster (if any) are annotated with black. Loci with depth <20X are coloured in light blue. The additional sample (D) for A29 is incorporated into the phylogenetic tree (j). Validation experiment for A10-E, the prostate sample, gave very low coverage (d). Subclones for A29-A and A29-C are annotated in the 2d-DP plot (k). Numbers of substitutions in WGS data assigned to each subclone are plotted in (c) and (l). VAFs from WGS and validation data, plotted as scatter plots (d) and (m), are very highly correlated. Number of indels (e) and (n) and rearrangements (f) and (o) present in different subsets of samples are plotted as bar charts. Subclone Colour keys for A10 and A29 (g and p) respectively.
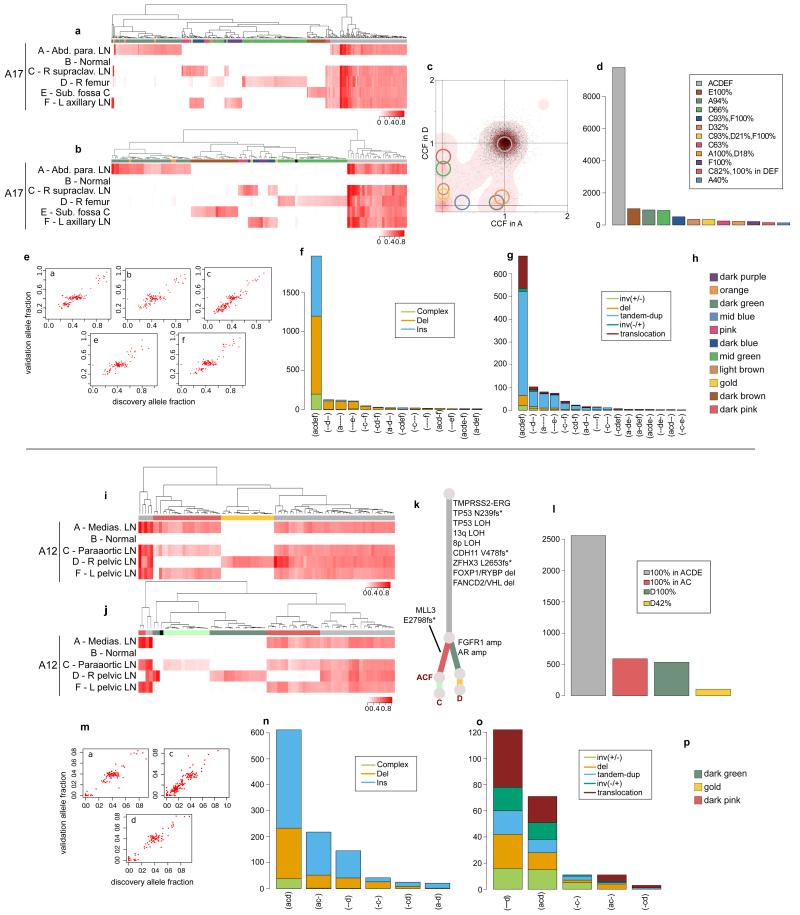
Extended Data Figure 6. Validation of the subclonal hierarchies in A17 and A12.
Validation strategy as described in Extended Data Figure 2. For A17 and A12, hierarchical clustering of the VAF was performed separately for substitutions (a) and (i) and indels (b) and (j). Heatmaps are annotated as described in Extended Data Figure 2. Mutations that could not be assigned to any cluster are annotated with black. For A12, the C-specific cluster that is not present in substitutions is shown in very light green. Subclones for A17 AD are annotated in the 2d-DP plot (c). Numbers of substitutions in WGS data assigned to each subclone are plotted in (d) and (l). VAFs from WGS and validation data, plotted as scatter plots (e) and (m), are very highly correlated. Number of indels (f) and (n) and rearrangements (g) and (o) present in different subsets of samples are plotted as bar charts. Additional samples for A12 are incorporated into the phylogenetic tree (k). Subclone Colour keys for A17 and A12 (h and p) respectively.
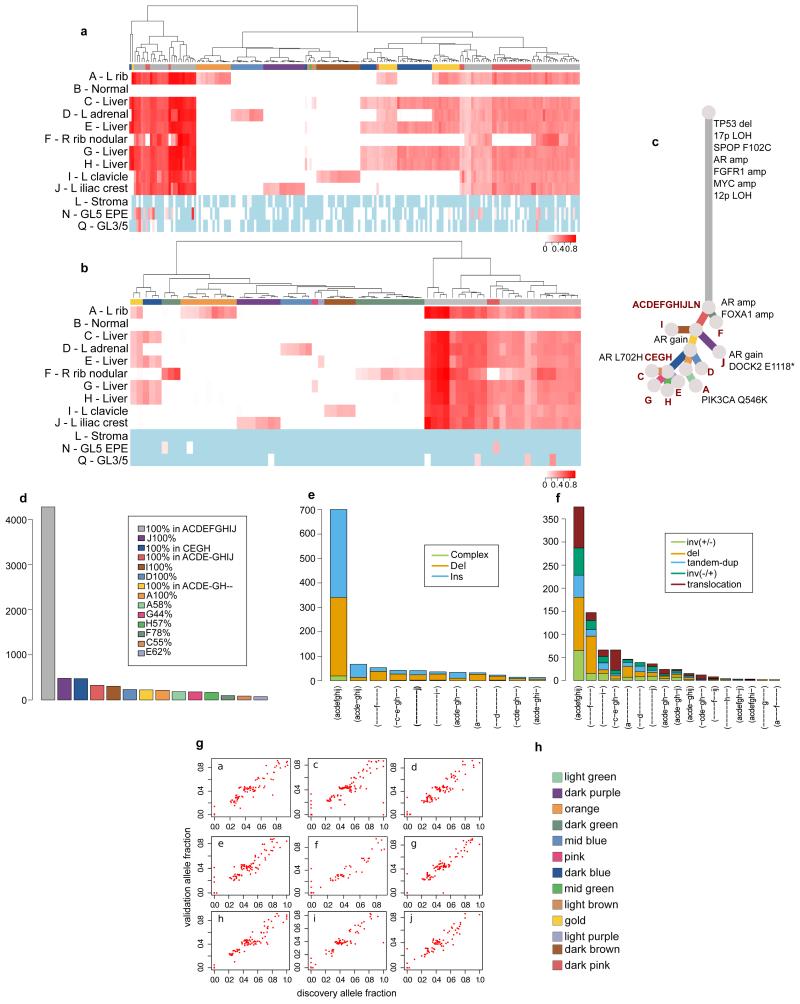
Extended Data Figure 7. Validation of the subclonal hierarchies in A21.
Validation strategy as described in Extended Data Figure 2. Hierarchical clustering of the VAF was performed separately for substitutions (a) and indels (b). Heatmaps are annotated as described in Extended Data Figure 2. Loci with depth <20X is coloured in light blue. Additional samples L, N, and Q from FFPE material had low coverage. The only loci present in these samples were all truncal. These samples are incorporated into the phylogenetic tree (c). Numbers of substitutions in WGS data assigned to each subclone are plotted in (d). Number of indels (e) and rearrangements (f) present in different subsets of samples are plotted as bar charts. VAFs from WGS and validation data, plotted as scatter plots (g), are very highly correlated. Subclone Colour key (h).
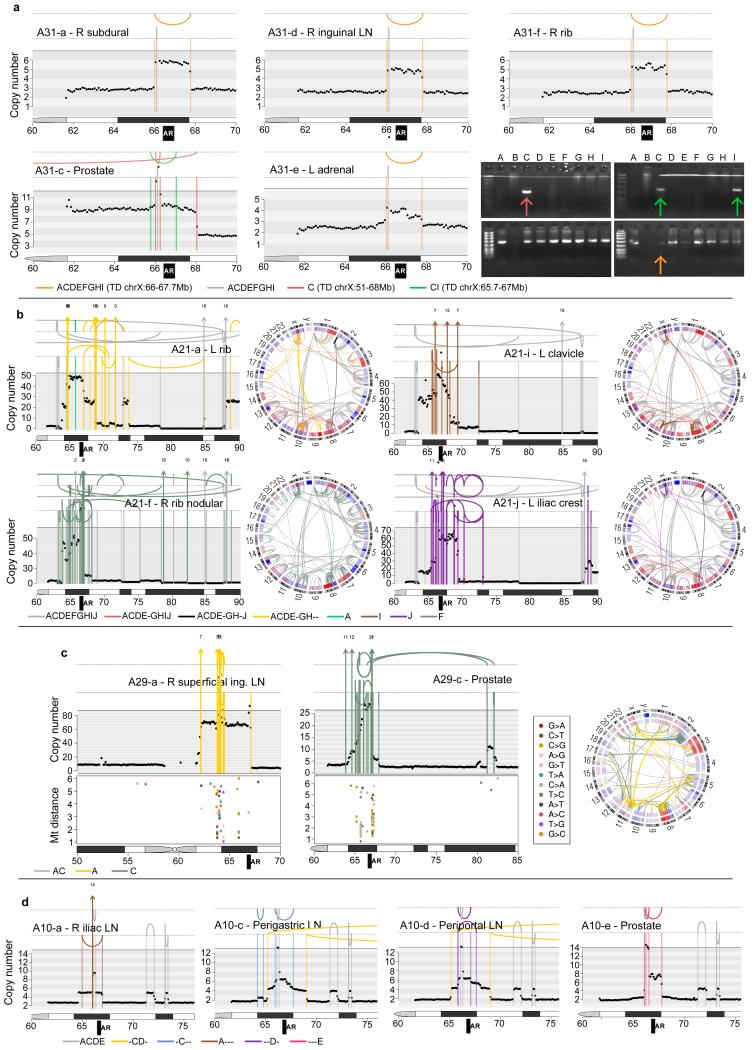
Extended Data Figure 8. Convergent evolution at the AR locus.
Rearrangements and copy number segments in the vicinity of the AR locus are shown for A31, A21, A29 and A10. (a) In A31, there are three different AR amplification events. In orange is a tandem duplication whose existence is supported by tumour reads in ADEF but not C. However PCR-gel validation confirms its existence in the prostate sample C - the faintness of the band suggesting that this rearrangement is present subclonally in A31-C - as well as the prostate sample I, which was not subject to WGS. One tandem duplication is common to both prostate samples (shown in green) while the other is specific to sample C (dark pink). (b) In A21, there are 4 different sets of complex rearrangements, one shared by ACDEGH and the remainder specific to F, I and J. (c) Rearrangements in the vicinity of the AR locus and inter-mutation distances for A29 plotted on a log10 scale for lesions specific to the metastasis (left) and specific to the prostate (middle). Each sample has a different set of complex rearrangements, which are associated with distinct kataegis events. (d) In A10, one tandem duplication is shared by CD while four others are each specific to a single sample.
Extended Data Table 1. Validation of mutation calling.
To determine validation rate for mutation calling, a custom capture SureSelect design was used to sequence selected coding/non-coding loci to an average depth of 360-2000X. For loci with sufficient depth (>=20X), the validation rate (the proportion of somatic variants) was calculated as described in Extended Data Table 2 and Supplementary Information, section 3c. On average 95% and 86% of the substitutions and indels, respectively, were somatic. Validation for rearrangement calls was performed by PCR-gel electrophoresis, as described in Supplementary Information, section 3d. PCR-gel experiments yielded a high validation rate for three of the four patients included in the validation. For A22, there was a high rate of PCR failure. For this sample, we therefore assessed the veracity of the breakpoints by visual inspection of the associated copy number segments and confirmed that 82% were high-confidence events resulting in visible copy number changes.
| Patient | # coding subs | # subs from mutation clusters | # total unique subs | # subs with coverage* | % somatic | |
|
| ||||||
| substitutions | A10 | 109 | 163 | 270 | 269 | 90.70% |
| A22 | 97 | 265 | 356 | 356 | 98.60% | |
| A29 | 76 | 70 | 144 | 143 | 93.00% | |
| A31 | 43 | 109 | 150 | 150 | 89.30% | |
| A32 | 74 | 388 | 450 | 450 | 97.80% | |
| A12 | 54 | 144 | 192 | 191 | 88.50% | |
| A24 | 50 | 147 | 196 | 196 | 97.00% | |
| A34 | 258 | 554 | 800 | 795 | 99.20% | |
| A21 | 72 | 203 | 275 | 273 | 96.30% | |
| A17 | 155 | 377 | 523 | 522 | 100% | |
| AVERAGE | 95.04% | |||||
|
| ||||||
| Patient | # coding indels | # indels from mutation clusters | # total unique indels | # indels with coverage* | % somatic | |
|
| ||||||
| indels | A10 | 11 | 145 | 156 | 155 | 80.70% |
| A22 | 9 | 74 | 80 | 79 | 78.50% | |
| A29 | 6 | 44 | 49 | 49 | 87.80% | |
| A31 | 5 | 48 | 52 | 51 | 82.40% | |
| A32 | 11 | 93 | 101 | 100 | 86% | |
| A12 | 14 | 76 | 84 | 83 | 86.80% | |
| A24 | 9 | 66 | 73 | 72 | 83.30% | |
| A34 | 43 | 258 | 284 | 282 | 96.10% | |
| A21 | 9 | 85 | 89 | 88 | 81.80% | |
| A17 | 15 | 123 | 123 | 122 | 99.20% | |
| AVERAGE | 86.26% | |||||
|
| ||||||
| Patient | # rearrs validated | PCR failed | % somatic | |||
|
| ||||||
| Rearrangements | A22 | 49 | 21 | 57% (82% with rearrs confirmed by the visual inspection of copy number changes) | ||
| A31 | 21 | 1 | 95% | |||
| A32 | 32 | 1 | 96% | |||
| A24 | 27 | 3 | 89% | |||
Extended Data Table 2. Copy number genes.
To identify potentially oncogenic events within regions of copy number changes, we intersected the affected genomic segments with genes previously shown to be recurrently amplified/deleted. The ‘Source’ column indicates the literature source of the gene as follows: pan_cancer = The Cancer Genome Atlas (TCGA) Pan-Cancer data set (Zach, 2013), prostate = reports of genes specifically amplified/deleted in prostate cancer (Taylor, 2010 and Barbieri, 2012), cancer_gene_census = Cancer gene census (Futreal, 2004), literature = widely reported in cancer literature.
| AMPLIFICATIONS | DELETIONS | ||
|---|---|---|---|
|
| |||
| gene | Source | gene | Source |
|
|
|
||
| AKT1 | pan_cancer | PTEN | prostate |
| AKT2 | cancer_gene_census | CDH1 | prostate |
| AKT3 | pan_cancer | TP53 | prostate |
| AR | literature | RB1 | prostate |
| BRAF | prostate | CHD1 | prostate |
| CCND1 | pan_cancer | CDH1 | prostate |
| CCND3 | pan_cancer | FOXPA1+RYBP | prostate |
| CCNE1 | pan_cancer | CDKN1B | prostate |
| CDK4 | pan_cancer | STK11 | pan_cancer |
| CDK6 | pan_cancer | ARID1A | pan_cancer |
| EGFR | pan_cancer,prostate | NKX3-1 | literature |
| ERBB2 | pan_cancer | BRCA1 | pan_cancer |
| EZH2 | prostate | BRCA2 | prostate |
| FGFR1 | cancer_gene_census | PDE4D | prostate |
| FGFR3 | pan_cancer | ERG | literature |
| IGF1R | pan_cancer | ||
| JUN | cancer_gene_census | ||
| KRAS | pan_cancer | ||
| MCL1 | pan_cancer | ||
| MDM2 | pan_cancer | ||
| MDM4 | pan_cancer | ||
| MITF | cancer_gene_census | ||
| MYC | pan_cancer,prostate | ||
| MYCL1 | pan_cancer | ||
| MYCN | cancer_gene_census | ||
| NKX2-1 | cancer_gene_census | ||
| NCOA2 | prostate | ||
| SKP2 | prostate | ||
Supplementary Material
ACKNOWLEDGEMENTS
We thank the men and their families who participated in the PELICAN (Project to ELIminate lethal CANcer) integrated clinical-molecular autopsy study of prostate cancer. We thank: Mario A. Eisenberger, Michael A. Carducci, V. Sinibaldi, T.B. Smyth, and G.J. Mamo for oncologic and urologic clinical support; Teemu Tolonen for uropathology support; Päivi Martikainen, Marika Vaha-Jaakkola, Mariitta Vakkuri, Katri Leinonen, Toni Vormisto, Marc Rohrer, Antti Koskenalho, Jan Silander, Tapio Lahtinen, Claire Hardy, Grover Hutchins, Barbara Crain, Sameer Jhavar, Conover Talbot, Laura Kasch, Margaret Penno, Andrew Warner, and Yelena Golubeva for technical support; Michael R. Stratton and P. Andrew Futreal for their comments on the manuscript.
FUNDING This is an ICGC Prostate Cancer study funded by: Cancer Research UK (2011-present); Academy of Finland (2011-present); Cancer Society of Finland (2013-present); PELICAN Autopsy Study family members and friends (1998-2004); John and Kathe Dyson (2000); US National Cancer Institute CA92234 (2000-2005); American Cancer Society (1998-2000); Johns Hopkins University Department of Pathology (1997-2011); Women’s Board of Johns Hopkins Hospital (1998); The Grove Foundation (1998); Association for the Cure of Cancer of the Prostate (1994-1998); American Foundation for Urologic Disease (1991-1994); Bob Champion Cancer Trust (2013-present); Research Foundation – Flanders (FWO) [FWO G.0687.12] (2012-present). EP is a European Hematology Association Research Fellow.
Footnotes
AUTHOR INFORMATION The authors declare no competing financial interests.
REFERENCES
- 1.Nowell PC. The clonal evolution of tumor cell populations. Science. 1976;194:23–28. doi: 10.1126/science.959840. [DOI] [PubMed] [Google Scholar]
- 2.Nik-Zainal S, et al. The life history of 21 breast cancers. Cell. 2012;149:994–1007. doi: 10.1016/j.cell.2012.04.023. [DOI] [PMC free article] [PubMed] [Google Scholar]
- 3.Greaves M, Maley CC. Clonal evolution in cancer. Nature. 2012;481:306–313. doi: 10.1038/nature10762. [DOI] [PMC free article] [PubMed] [Google Scholar]
- 4.Gerlinger M, et al. Intratumor heterogeneity and branched evolution revealed by multiregion sequencing. N Engl J Med. 2012;366:883–892. doi: 10.1056/NEJMoa1113205. [DOI] [PMC free article] [PubMed] [Google Scholar]
- 5.Gupta GP, Massague J. Cancer metastasis: building a framework. Cell. 2006;127:679–695. doi: 10.1016/j.cell.2006.11.001. [DOI] [PubMed] [Google Scholar]
- 6.Poste G, Fidler IJ. The pathogenesis of cancer metastasis. Nature. 1980;283:139–146. doi: 10.1038/283139a0. [DOI] [PubMed] [Google Scholar]
- 7.Fidler IJ. The pathogenesis of cancer metastasis: the ’seed and soil’ hypothesis revisited. Nat Rev Cancer. 2003;3:453–458. doi: 10.1038/nrc1098. [DOI] [PubMed] [Google Scholar]
- 8.Talmadge JE, Fidler IJ. AACR centennial series: the biology of cancer metastasis: historical perspective. Cancer Res. 2010;70:5649–5669. doi: 10.1158/0008-5472.CAN-10-1040. [DOI] [PMC free article] [PubMed] [Google Scholar]
- 9.McFadden DG, et al. Genetic and clonal dissection of murine small cell lung carcinoma progression by genome sequencing. Cell. 2014;156:1298–1311. doi: 10.1016/j.cell.2014.02.031. [DOI] [PMC free article] [PubMed] [Google Scholar]
- 10.Cleary AS, Leonard TL, Gestl SA, Gunther EJ. Tumour cell heterogeneity maintained by cooperating subclones in Wnt-driven mammary cancers. Nature. 2014;508:113–117. doi: 10.1038/nature13187. [DOI] [PMC free article] [PubMed] [Google Scholar]
- 11.Bolli N, et al. Heterogeneity of genomic evolution and mutational profiles in multiple myeloma. Nat Commun. 2014;5:2997. doi: 10.1038/ncomms3997. [DOI] [PMC free article] [PubMed] [Google Scholar]
- 12.Karantanos T, Thompson TC. GEMMs shine a light on resistance to androgen deprivation therapy for prostate cancer. Cancer Cell. 2013;24:11–13. doi: 10.1016/j.ccr.2013.06.007. [DOI] [PMC free article] [PubMed] [Google Scholar]
- 13.Harris WP, Mostaghel EA, Nelson PS, Montgomery B. Androgen deprivation therapy: progress in understanding mechanisms of resistance and optimizing androgen depletion. Nat Clin Pract Urol. 2009;6:76–85. doi: 10.1038/ncpuro1296. [DOI] [PMC free article] [PubMed] [Google Scholar]
- 14.Bernard D, Pourtier-Manzanedo A, Gil J, Beach DH. Myc confers androgen-independent prostate cancer cell growth. J Clin Invest. 2003;112:1724–1731. doi: 10.1172/JCI19035. [DOI] [PMC free article] [PubMed] [Google Scholar]
- 15.Sharma NL, et al. The androgen receptor induces a distinct transcriptional program in castration-resistant prostate cancer in man. Cancer Cell. 2013;23:35–47. doi: 10.1016/j.ccr.2012.11.010. [DOI] [PubMed] [Google Scholar]
- 16.Francis JC, Thomsen MK, Taketo MM, Swain A. beta-catenin is required for prostate development and cooperates with Pten loss to drive invasive carcinoma. PLoS Genet. 2013;9:e1003180. doi: 10.1371/journal.pgen.1003180. [DOI] [PMC free article] [PubMed] [Google Scholar]
- 17.Marusyk A, et al. Non-cell-autonomous driving of tumour growth supports subclonal heterogeneity. Nature. 2014;514:54–58. doi: 10.1038/nature13556. [DOI] [PMC free article] [PubMed] [Google Scholar]
- 18.Sun Y, et al. Treatment-induced damage to the tumor microenvironment promotes prostate cancer therapy resistance through WNT16B. Nat Med. 2012;18:1359–1368. doi: 10.1038/nm.2890. [DOI] [PMC free article] [PubMed] [Google Scholar]
- 19.Campbell PJ, et al. The patterns and dynamics of genomic instability in metastatic pancreatic cancer. Nature. 2010;467:1109–1113. doi: 10.1038/nature09460. [DOI] [PMC free article] [PubMed] [Google Scholar]
- 20.Maley CC, et al. Selectively advantageous mutations and hitchhikers in neoplasms: p16 lesions are selected in Barrett’s esophagus. Cancer Res. 2004;64:3414–3427. doi: 10.1158/0008-5472.CAN-03-3249. [DOI] [PubMed] [Google Scholar]
- 21.Majumder PK, et al. A prostatic intraepithelial neoplasia-dependent p27 Kip1 checkpoint induces senescence and inhibits cell proliferation and cancer progression. Cancer Cell. 2008;14:146–155. doi: 10.1016/j.ccr.2008.06.00. [DOI] [PMC free article] [PubMed] [Google Scholar]
- 22.Yachida S, et al. Distant metastasis occurs late during the genetic evolution of pancreatic cancer. Nature. 2010;467:1114–1117. doi: 10.1038/nature09515. [DOI] [PMC free article] [PubMed] [Google Scholar]
- 23.Visakorpi T, et al. In vivo amplification of the androgen receptor gene and progression of human prostate cancer. Nat Genet. 1995;9:401–406. doi: 10.1038/ng0495-401. [DOI] [PubMed] [Google Scholar]
- 24.Ramaswamy S, Ross KN, Lander ES, Golub TR. A molecular signature of metastasis in primary solid tumors. Nat Genet. 2003;33:49–54. doi: 10.1038/ng1060. [DOI] [PubMed] [Google Scholar]
- 25.Lee YF, et al. A gene expression signature associated with metastatic outcome in human leiomyosarcomas. Cancer Res. 2004;64:7201–7204. doi: 10.1158/0008-5472.CAN-04-1673. [DOI] [PubMed] [Google Scholar]
Associated Data
This section collects any data citations, data availability statements, or supplementary materials included in this article.


