

Abstract
Functional adaptation may complicate the choice of phenotype used in genetic studies that seek to identify genes contributing to fracture susceptibility. Often, genetic variants affecting one trait are compensated by coordinated changes in other traits. Bone fracture is a prototypic example because mechanical function of long bones (stiffness and strength) depends on how the system coordinately adjusts the amount (cortical area) and quality (tissue-mineral density, TMD) of bone tissue to mechanically offset the natural variation in bone robustness (total area/length). We propose that efforts aimed at identifying genes regulating fracture resistance will benefit from better understanding how functional adaptation contributes to the genotype-phenotype relationship. We analyzed the femurs of C57BL/6J – ChrA/J/NaJ Chromosome Substitution Strains (CSSs) to systemically interrogate the mouse genome for chromosomes harboring genes that regulate mechanical function. These CSSs (CSS-i, i = the substituted chromosome) showed changes in mechanical function on the order of -26.6 to 11.5% relative to the B6 reference strain after adjusting for body size. Seven substitutions showed altered robustness, cortical area, or TMD, but no effect on mechanical function (CSS-4, 5, 8, 9, 17, 18, 19); six substitutions showed altered robustness, cortical area, or TMD, and reduced mechanical function (CSS-1, 2, 6, 10, 12, 15); and one substitution also showed reduced mechanical function but exhibited no significant changes in the three physical traits analyzed in this study (CSS-3). A key feature that distinguished CSSs that maintained function from those with reduced function was whether the system adjusted cortical area and TMD to the levels needed to compensate for the natural variation in bone robustness. These results provide a novel biomechanical mechanism linking genotype with phenotype, indicating that genes control function not only by regulating individual traits, but also by regulating how the system coordinately adjusts multiple traits to establish function.
Keywords: functional adaptation, homeostasis, genetic heterogeneity, complex adaptive system, bone
Introduction
Understanding how genotype and phenotype are connected remains a major impediment to identifying the genes contributing to complex traits. This association is complicated in the skeletal system because the phenotype of clinical interest - fracture resistance - cannot be measured directly in living humans. Consequently, genetic studies must rely on surrogate traits that can be measured non-invasively and that correlate with fracture resistance properties. Most genetic studies have been conducted using bone mineral density (BMD), because this trait is used clinically to identify individuals with low bone mass that may have a higher risk of fracturing (1). Other studies used morphological traits derived from engineering analysis (2,3) or combinations of traits derived from principle components analysis (4–6). Although many of these traits correlate with mechanical function (i.e., whole bone stiffness and strength), an important concern is that the adaptive nature of the skeletal system is not taken into consideration in genetic analyses when traits are used individually or combined for reasons unrelated to functional adaptations.
Functional adaptations may complicate the choice of phenotype used in genetic studies, because genetic variants affecting one trait are sometimes compensated by coordinated changes in other traits (7–9). Because the skeletal system shows a particular pattern in the way traits are coordinately regulated (i.e., a network of trait interactions), individuals can achieve similar functional outcomes by assembling different sets of traits (10). Consequently, individual traits, because they are coordinately regulated, are “moving targets” and may not be reliable indicators of function and fracture resistance (Fig 1A). Thus, quantitative trait loci (QTLs) identified as regulating single traits or complex combinations of traits (e.g., BMD) may not necessarily regulate fracture resistance. These functional trait coadaptations may explain why there is often inconsistent overlap among the QTLs regulating individual traits and those regulating bone strength in mice (11) and humans (12).
Figure 1.


A) Genotype-phenotype relationships have traditionally been studied as a system that adapts to genetic and environmental perturbations leading to a singular functional outcome. Our working hypothesis is that the complex adaptive nature of the skeletal system coordinately adjusts morphological and compositional traits in a pattern (phenotypic network) leading to a continuum of functional outcomes. B) We postulate that the phenotype network acts to establish mechanical function for daily load conditions so that individuals have bones that are sufficiently stiff for their body size. The set of traits acquired by this process defines the emergent effect on the repertoire of fracture resistance properties such as maximum load, post-yield deflection, and work-to-fracture.
We propose that efforts aimed at identifying genes regulating fracture resistance will benefit from targeting the biological processes that are directly responsible for establishing mechanical function. This changes the focus from individual gene-trait relationships to functional coadaptations (13). Bone, like many physiological systems, uses a closed-loop feedback system to establish function, such that bone cells adjust traits in response to signals that convey how close the structure is to a functional end-state or set point (14). Consequently, biological factors regulating aspects of this feedback system (e.g., set points, cellular responsiveness, compensation, hysteresis) are subject to genetic regulation (15). Herein, we analyzed the femora of C57BL/6J - ChrA/J/NaJ Chromosome Substitution Strains (CSSs) to identify the chromosomes harboring genes that regulate bone mechanical function. Prior work confirmed that individual chromosome substitutions significantly altered individual bone traits (16–18). Whole bone stiffness varies widely among inbred mouse strains (19). Many genetic studies compared C57BL/6J (B6) and C3H/HeJ (C3H) strains to identify the genes responsible for the increased BMD of C3H mice (1). In contrast, we chose to compare A/J and B6 strains, because 1) these two strains achieved similar skeletal functional outcomes (i.e., similar stiffness relative to body size) but in distinct ways (10) and 2) the degree of variation in bone robustness and the associated functional trait interactions observed for crosses derived from A/J and B6 (10) are similar to that observed for human long bones (20,21). Therefore, this CSS panel allowed us to systemically interrogate the mouse genome by testing the hypothesis that some chromosome substitutions will show altered morphology and composition while coordinately adjusting these traits to establish normal function. In contrast, other substitutions will disrupt the ability of the system to properly coordinate traits leading to altered mechanical function. We also identified the biomechanical mechanisms explaining how system function was maintained or impaired in each strain, and then tested how each biomechanical strategy affected fracture resistance properties.
Methods
Husbandry
A panel of 16 week old male C57BL/6J – ChrA/J/NaJ chromosome substitution strains were obtained from the Jackson Laboratory (Bar Harbor, ME, USA) for all 19 autosomes and the X chromosome (n = 10 per strain). Male 16 week old C57BL/6J (B6) and A/J mice (n = 40 and 10, respectively) were also purchased from Jackson Laboratory. All mice received water and were fed a standard rodent diet (Purina Rodent Chow 5001; Purina Mills, Richmond, IN, USA) ad libitum. Mice were housed with a maximum of 5 mice per cage in a room with a 12-hour light/dark cycle. All mice received intra-peritoneal injections of Alizarin (30mg/kg body weight) and Calcein (30mg/kg body weight) at 7 and 2 days prior to sacrifice, respectively. All mice were euthanized with carbon dioxide asphyxiation at 16 weeks of age. Body mass and the mass of the quadriceps complex were recorded at sacrifice. Left femurs were harvested, manually cleaned of soft tissues, and stored frozen at −20 deg C in phosphate buffer saline solution (PBS) for morphological analysis and mechanical testing. All animal procedures were approved by the University Committee on Use and Care of Animals.
Cross-sectional Morphology and Tissue-Mineral Density
Femur length (Le) was measured as the distance from the proximal femoral head to the center of the distal condyles using digital calipers (0.01 mm resolution). Femurs were imaged while submerged in water using a nano-computed tomography system (nanotom-s; phoenix|x-ray, GE Sensing & Inspection Technologies, GmbH; Wunstorf, Germany). All scans were performed with a custom calibration phantom containing regions of air, water, and a hydroxyapatite mimicker (1.69mg/cc, Gammex, Middleton, WI USA) and the same imaging parameters (tungsten target, 2000 ms timing, 3 averages, 1 skip, 85 kV and 220 μA tube settings). Beam hardening artifacts were minimized by using a 0.3 mm aluminum filter and an equilibration bath surrounding the sample holder (22). Images were reconstructed at 8 μm voxel size using datos|x reconstruction 2.1 (phoenix|x-ray, GE Sensing & Inspection Technologies, GmbH; Wunstorf, Germany). Grey values were converted to Hounsfield units (HU) using the calibration phantom. The analysis site was standardized by selecting a region of interest (ROI) starting immediately distal to the third trochanter and extending 2.5mm distally. The ROI was thresholded on a per sample basis using the method of Otsu (23). Tissue mineral density (TMD), cortical area (Ct.Ar), marrow area (Ma.Ar), and total area (Tt.Ar) were quantified using MicroView v2.2 Advanced Bone Analysis Application (GE Healthcare Pre-Clinical Imaging, London, ON, Canada). Robustness was calculated as total cross-sectional area divided by femoral length (Tt.Ar/Le), consistent with prior studies (18).
Mechanical Testing
Following nanoCT imaging, left femurs were loaded to failure in 4-point bending at 0.05 mm/sec using a servohydraulic materials testing system (MTS 858 MiniBionix, Eden Prairie, MN). All bones were tested at room temperature, kept moist with PBS, and loaded with the anterior side in tension between upper and lower supports that were 2.2 mm and 6.35 mm apart, respectively. Stiffness (S), maximum load (ML), post-yield deflection (PYD), and work-to-fracture (Work) were calculated from the load-deflection curves (24,25).
Chromosome Substitutions Altering Mechanical Function
We used a top-down approach to identify CSSs with altered mechanical function. Prevailing theories suggest that bone coordinately adjusts traits to achieve a narrow range of peak tissue strains (26). Peak tissue strains are proportional to how stiff a bone is relative to the applied loads, which can be approximated as body mass x femur length (27). CSSs affecting function were identified as those showing a significantly different (reduced or greater) stiffness compared to B6, after adjusting for body size (body mass x femur length). We also used changes in maximum load to identify CSSs with altered function that were borderline significant when assessed by changes in stiffness alone. This was done by comparing the stiffness and maximum load of CSS femurs to B6 by using a General Linear Model (GLM) (overall p-value=0.05) with body size as a covariate (Minitab 16.2.3; Minitab, Inc, State College, PA, USA). To test if our measure of body size affected the outcome of the study, we also conducted GLM analyses by using body mass and the average quadriceps complex mass as alternative covariates, as well as comparing the stiffness and maximum load of each CSS to B6 without adjusting for body size (t-test, p<0.008) (28). The GLM results were further confirmed by regressing stiffness and maximum load against body size, and testing for differences in the slope and y-intercept between each CSS and B6 by using an analysis of covariance, ANCOVA (p<0.05, Prism 6.01; GraphPad Software, Inc., La Jolla, CA, USA).
Biomechanical Mechanisms Contributing to Variation in Mechanical Function
We assessed bone morphology and composition in a systematic manner to identify the biomechanical mechanisms explaining how each CSS either achieved normal function or showed impaired function. Although many traits are probably coordinated to achieve function, our prior work identified three traits (robustness, Ct.Ar, TMD) that can be measured non-invasively and that explain a significant amount of the variation in mechanical function (10). We first tested for changes in robustness by comparing each CSS to the B6 host by using GLM with body size as a covariate. We then identified the CSSs that had Ct.Ar and TMD values that were significantly higher or lower than expected for their body size and robustness. This was done by comparing each CSS to B6 by using GLM with body size and robustness as covariates. Robustness was included as a covariate because both Ct.Ar and TMD vary relative to robustness (i.e., slender bones have lower Ct.Ar and higher TMD compared to robust bones). As with the analysis for stiffness and maximum load, the GLM analysis for robustness, Ct.Ar, and TMD were confirmed by using body mass and the average quadriceps complex mass as alternative covariates. For unadjusted comparisons, each CSS was compared to B6 by using a t-test with the significance level (p<0.008) adjusted for multiple comparisons (n=20 CSSs) (28,29).
Emergent Effects on Fracture Resistance Properties
The association between QTLs and fracture resistance may also be complicated by how the set of traits acquired during growth relates to the mechanical properties that define system performance under daily loading conditions and then to the mechanical properties that define fracture resistance under extreme loading conditions. In our working model (Fig 1B), we propose that the repertoire of fracture resistance properties is not regulated directly by genes; rather, these properties are defined as an emergent outcome of the particular set of genetically determined traits acquired to establish mechanical function. Consequently, we segregated the mechanical property that is relevant to functional adaptation (i.e., stiffness) from those that are relevant to fracture resistance. For monotonic failure tests, fracture resistance properties include maximum load, post-yield deflection, and work-to-fracture. As noted previously, maximum load was reported as a secondary analysis for functional adaptation due to its high correlation with stiffness. CSSs that differed significantly from B6 for post-yield deflection and work-to-fracture were identified using GLM with body size as a covariate.
Results
Variation among CSSs
We surveyed B6, A/J and the 20 CSSs for a total of 13 traits including body size measurements (4 traits), whole bone mechanical properties (4 traits), femoral cross-sectional morphology (4 traits), and tissue mineral density (1 trait). On average across the suite of traits, 5 CSSs differed significantly from B6 (range = 1 to 10 CSSs) and all traits showed at least one CSS that differed significantly from B6 (p<0.008) when examining unadjusted trait values (Table 1a, b, c). Body size measures and TMD showed the largest number of CSSs that differed significantly from B6 (6 to 10 CSSs). The CSSs with altered morphology were largely consistent for the 4 traits examined in this study. Post-yield deflection and work-to-fracture showed the least number of CSSs that differed significantly from B6.
Table 1a.
Variation in body size parameters among 16 week old male B6, A/J, and the CSS panel.
| Strain | n | BM (g) | Le (mm) | BS (BM xLe) | Quad Mass (g) |
|---|---|---|---|---|---|
| B6 | 40 | 27.0 ± 1.8 | 15.95 ± 0.25 | 431 ± 33 | 0.24 ± 0.02 |
| A/J | 10 | 25.8 ± 1.7 | 15.74 ± 0.20 | 406 ± 30 | 0.22 ± 0.01 |
| CSS-1 | 9 | 30.4 ± 2.7 | 15.67 ± 0.24 | 475 ± 51 | 0.23 ± 0.01 |
| CSS-2 | 10 | 25.8 ± 2.8 | 14.77 ± 0.25 | 382 ± 46 | 0.20 ± 0.03 |
| CSS-3 | 10 | 30.4 ± 1.3 | 16.16 ± 0.10 | 492 ± 23 | 0.27 ± 0.01 |
| CSS-4 | 10 | 27.8 ± 2.0 | 15.71 ± 0.29 | 437 ± 35 | 0.24 ± 0.02 |
| CSS-5 | 10 | 29.3 ± 1.8 | 16.30 ± 0.28 | 478 ± 35 | 0.24 ± 0.02 |
| CSS-6 | 10 | 27.7 ± 2.2 | 15.63 ± 0.40 | 433 ± 42 | 0.22 ± 0.03 |
| CSS-7 | 10 | 29.1 ± 1.4 | 16.15 ± 0.27 | 471 ± 30 | 0.27 ± 0.02 |
| CSS-8 | 10 | 28.1 ± 1.6 | 16.05 ± 0.22 | 452 ± 29 | 0.25 ± 0.01 |
| CSS-9 | 10 | 27.9 ± 1.8 | 15.86 ± 0.27 | 443 ± 35 | 0.25 ± 0.02 |
| CSS-10 | 10 | 31.6 ± 2.6 | 16.37 ± 0.19 | 517 ± 47 | 0.26 ± 0.03 |
| CSS-11 | 10 | 27.6 ± 1.6 | 15.98 ± 0.18 | 440 ± 30 | 0.26 ± 0.02 |
| CSS-12 | 10 | 28.4 ± 2.1 | 16.17 ± 0.26 | 459 ± 35 | 0.23 ± 0.04 |
| CSS-13 | 10 | 29.2 ± 1.3 | 15.90 ± 0.18 | 464 ± 25 | 0.26 ± 0.02 |
| CSS-14 | 10 | 29.9 ± 2.4 | 16.14 ± 0.30 | 483 ± 45 | 0.27 ± 0.03 |
| CSS-15 | 10 | 28.2 ± 2.5 | 15.87 ± 0.29 | 448 ± 46 | 0.26 ± 0.02 |
| CSS-16 | 10 | 26.7 ± 1.6 | 15.81 ± 0.24 | 422 ± 26 | 0.24 ± 0.02 |
| CSS-17 | 10 | 27.2 ± 2.2 | 16.07 ± 0.23 | 438 ± 41 | 0.25 ± 0.02 |
| CSS-18 | 10 | 25.0 ± 1.9 | 15.86 ± 0.19 | 397 ± 34 | 0.23 ± 0.01 |
| CSS-19 | 10 | 29.6 ± 1.1 | 16.26 ± 0.30 | 481 ± 23 | 0.22 ± 0.03 |
| CSS-X | 10 | 27.5 ± 1.9 | 16.14 ± 0.26 | 444 ± 37 | 0.26 ± 0.02 |
Table 1b.
Variation in whole bone mechanical properties among 16 week old male B6, A/J, and the CSS panel.
| Strain | n | Stiff (N/mm) | Max (N) | PYD (mm) | Work (Nmm) |
|---|---|---|---|---|---|
| B6 | 40 | 197.1 ± 28.6 | 28.0 ± 3.3 | 0.33 ± 0.10 | 8.42 ± 2.4 |
| A/J | 10 | 206.9 ± 22.9 | 27.6 ± 1.6 | 0.12 ± 0.04 | 4.64 ± 1.3 |
| CSS-1 | 9 | 156.6 ± 31.7 | 25.6 ± 4.1 | 0.28 ± 0.12 | 6.12 ± 2.4 |
| CSS-2 | 10 | 166.1 ± 30.6 | 22.2 ± 2.6 | 0.08 ± 0.05 | 3.04 ± 0.9 |
| CSS-3 | 10 | 165.5 ± 22.9 | 27.5 ± 2.0 | 0.35 ± 0.09 | 9.43 ± 2.3 |
| CSS-4 | 10 | 217.0 ± 30.8 | 27.3 ± 1.6 | 0.26 ± 0.09 | 6.64 ± 2.5 |
| CSS-5 | 10 | 220.0 ± 28.4 | 29.2 ± 3.6 | 0.28 ± 0.17 | 8.02 ± 4.3 |
| CSS-6 | 10 | 171.2 ± 18.1 | 23.2 ± 2.6 | 0.43 ± 0.19 | 8.23 ± 1.7 |
| CSS-7 | 10 | 215.0 ± 29.8 | 27.3 ± 2.4 | 0.33 ± 0.12 | 8.69 ± 2.6 |
| CSS-8 | 10 | 197.2 ± 21.8 | 27.0 ± 2.0 | 0.38 ± 0.19 | 9.78 ± 4.2 |
| CSS-9 | 10 | 189.3 ± 26.0 | 27.6 ± 2.9 | 0.46 ± 0.27 | 11.19 ± 4.3 |
| CSS-10 | 10 | 183.4 ± 23.6 | 27.3 ± 1.7 | 0.33 ± 0.06 | 8.73 ± 1.6 |
| CSS-11 | 10 | 204.7 ± 22.6 | 27.1 ± 2.2 | 0.43 ± 0.20 | 10.11 ± 3.1 |
| CSS-12 | 10 | 178.9 ± 34.3 | 24.6 ± 3.5 | 0.16 ± 0.07 | 4.24 ± 1.7 |
| CSS-13 | 10 | 214.0 ± 18.2 | 30.0 ± 1.9 | 0.37 ± 0.11 | 10.45 ± 2.6 |
| CSS-14 | 10 | 236.6 ± 37.0 | 28.6 ± 3.8 | 0.26 ± 0.12 | 7.40 ± 2.8 |
| CSS-15 | 10 | 173.7 ± 17.8 | 24.1 ± 2.7 | 0.33 ± 0.09 | 7.03 ± 1.8 |
| CSS-16 | 10 | 199.7 ± 24.7 | 25.3 ± 2.3 | 0.34 ± 0.11 | 8.37 ± 2.4 |
| CSS-17 | 10 | 189.8 ± 34.8 | 26.7 ± 2.1 | 0.37 ± 0.19 | 9.08 ± 3.9 |
| CSS-18 | 10 | 201.3 ± 22.5 | 26.3 ± 2.1 | 0.30 ± 0.08 | 7.69 ± 1.6 |
| CSS-19 | 10 | 210.8 ± 33.8 | 28.6 ± 2.3 | 0.26 ± 0.07 | 7.13 ± 2.1 |
| CSS-X | 10 | 216.3 ± 24.8 | 29.5 ± 2.1 | 0.32 ± 0.12 | 8.66 ± 2.4 |
Table 1c.
Variation in femoral morphology and TMD among 16 week old male B6, A/J, and the CSS panel.
| Strain | n | Robust (mm) | Tt.Ar (mm2) | Ct.Ar (mm2) | Ma.Ar (mm2) | TMD (mg/cc) |
|---|---|---|---|---|---|---|
| B6 | 40 | 0.13 ± 0.01 | 2.04 ± 0.20 | 0.88 ± 0.07 | 1.15 ± 0.15 | 1416 ± 12 |
| A/J | 10 | 0.08 ± 0.00 | 1.27 ± 0.06 | 0.77 ± 0.03 | 0.51 ± 0.04 | 1538 ± 11 |
| CSS-1 | 9 | 0.12 ± 0.00 | 1.95 ± 0.09 | 0.83 ± 0.06 | 1.12 ± 0.06 | 1410 ± 8 |
| CSS-2 | 10 | 0.12 ± 0.01 | 1.85 ± 0.15 | 0.78 ± 0.06 | 1.07 ± 0.09 | 1392 ± 13 |
| CSS-3 | 10 | 0.14 ± 0.01 | 2.31 ± 0.09 | 0.98 ± 0.02 | 1.34 ± 0.08 | 1418 ± 9 |
| CSS-4 | 10 | 0.14 ± 0.00 | 2.26 ± 0.08 | 0.92 ± 0.02 | 1.34 ± 0.07 | 1432 ± 10 |
| CSS-5 | 10 | 0.12 ± 0.01 | 1.97 ± 0.21 | 0.90 ± 0.06 | 1.07 ± 0.15 | 1421 ± 17 |
| CSS-6 | 10 | 0.12 ± 0.01 | 1.90 ± 0.17 | 0.85 ± 0.08 | 1.05 ± 0.10 | 1402 ± 13 |
| CSS-7 | 10 | 0.14 ± 0.01 | 2.20 ± 0.15 | 0.92 ± 0.04 | 1.28 ± 0.13 | 1413 ± 13 |
| CSS-8 | 10 | 0.12 ± 0.01 | 1.89 ± 0.12 | 0.85 ± 0.05 | 1.04 ± 0.08 | 1413 ± 7 |
| CSS-9 | 10 | 0.12 ± 0.01 | 1.93 ± 0.12 | 0.89 ± 0.07 | 1.05 ± 0.06 | 1431 ± 10 |
| CSS-10 | 10 | 0.13 ± 0.01 | 2.14 ± 0.14 | 0.94 ± 0.04 | 1.20 ± 0.12 | 1397 ± 8 |
| CSS-11 | 10 | 0.13 ± 0.01 | 2.05 ± 0.13 | 0.87 ± 0.05 | 1.18 ± 0.10 | 1415 ± 10 |
| CSS-12 | 10 | 0.12 ± 0.02 | 1.99 ± 0.25 | 0.82 ± 0.08 | 1.16 ± 0.18 | 1446 ± 16 |
| CSS-13 | 10 | 0.13 ± 0.01 | 2.04 ± 0.10 | 0.93 ± 0.03 | 1.11 ± 0.08 | 1420 ± 10 |
| CSS-14 | 10 | 0.14 ± 0.01 | 2.29 ± 0.21 | 0.95 ± 0.08 | 1.34 ± 0.14 | 1417 ± 14 |
| CSS-15 | 10 | 0.12 ± 0.01 | 1.91 ± 0.25 | 0.82 ± 0.08 | 1.09 ± 0.18 | 1434 ± 14 |
| CSS-16 | 10 | 0.12 ± 0.01 | 1.94 ± 0.10 | 0.84 ± 0.03 | 1.10 ± 0.07 | 1422 ± 7 |
| CSS-17 | 10 | 0.11 ± 0.01 | 1.82 ± 0.13 | 0.85 ± 0.04 | 0.97 ± 0.10 | 1430 ± 14 |
| CSS-18 | 10 | 0.11 ± 0.01 | 1.77 ± 0.16 | 0.83 ± 0.06 | 0.94 ± 0.10 | 1438 ± 11 |
| CSS-19 | 10 | 0.13 ± 0.01 | 2.05 ± 0.25 | 0.90 ± 0.08 | 1.15 ± 0.18 | 1410 ± 11 |
| CSS-X | 10 | 0.13 ± 0.01 | 2.14 ± 0.20 | 0.92 ± 0.06 | 1.21 ± 0.14 | 1415 ± 15 |
Data are shown as mean ± standard deviation. Bold font represents significant differences between each CSS and B6 (p<0.008, t-test).
Abbreviations: BM = body mass, Le = femur length, BS = body size (BM x Le), Stiff = stiffness, Max = Maximum load, PYD = post-yield deflection, Work = work-to-fracture, Robust = robustness, TtAr = total cross-sectional area, CtAr = cortical area, MaAr = marrow area, TMD = tissue-mineral density.
Effect of chromosome substitutions on body size
Body mass and femoral length were expressed as a percent difference relative to B6 (Table 2) to identify chromosome substitutions that affected body size (t-test, p<0.008). No significant differences were observed between AJ and B6 for body mass, femoral length, and body size (body mass x femoral length). In comparison to B6, individual CSSs significantly affected body size with the percent differences ranging from -11.4% to 20.0% for body size, −7.3% to 16.9% for body mass, and −7.4% to 2.6% for femoral length. Four strains (CSS-1, 5, 10, 19) differed significantly from B6 for all three measures. Five strains (CSS-3, 7, 13, 14, 18) differed significantly from B6 only in body mass and body size. One strain (CSS-2) differed significantly from B6 for femur length and body size. Finally, one strain (CSS-6) differed significantly from B6 for femur length only. These substitutions affected body size measures of sufficient magnitude to warrant adjusting all mechanical properties and physical bone traits for body size in subsequent analyses.
Table 2.
Differences (%) in body size, body mass and bone length between each CSS relative to B6. Data for A/J compared to B6 are shown for comparison.
| Body measurements | |||
|---|---|---|---|
|
| |||
| Body Size | Body mass | Length | |
| CSS-1 | 10.2 | 12.4 | −1.7 |
| CSS-2 | −11.4 | −4.4 | −7.4 |
| CSS-3 | 14.2 | 12.7 | 1.3 |
| CSS-4 | 1.4 | 2.9 | −1.5 |
| CSS-5 | 10.9 | 8.6 | 2.2 |
| CSS-6 | 0.5 | 2.5 | −2.0 |
| CSS-7 | 9.2 | 7.8 | 1.3 |
| CSS-8 | 4.8 | 4.2 | 0.7 |
| CSS-9 | 2.7 | 3.3 | −0.5 |
| CSS-10 | 20.0 | 16.9 | 2.6 |
| CSS-11 | 2.2 | 2.0 | 0.2 |
| CSS-12 | 6.4 | 5.0 | 1.4 |
| CSS-13 | 7.6 | 7.9 | −0.3 |
| CSS-14 | 12.1 | 10.7 | 1.2 |
| CSS-15 | 3.9 | 4.3 | −0.5 |
| CSS-16 | −2.0 | −1.1 | −0.9 |
| CSS-17 | 1.7 | 0.9 | 0.8 |
| CSS-18 | −7.9 | −7.3 | −0.5 |
| CSS-19 | 11.6 | 9.5 | 1.9 |
| CSS-X | 3.1 | 1.9 | 1.2 |
|
| |||
| A/J | −5.8 | −4.5 | −1.3 |
Bold values indicate significant differences relative to B6 (p<0.008, t-test).
Individual chromosome substitutions significantly affected whole bone mechanical function
Femora were loaded to failure in 4-point bending to identify chromosome substitutions that altered whole bone mechanical function. Differences in stiffness and maximum load for CSSs relative to B6 ranged from −26.6% to +11.5% and −16.9% to +3.6%, respectively, after adjusting for body size, indicating that individual substitutions were associated with large changes in whole bone mechanical function (Table 3). Seven substitutions altered mechanical function (CSS-1, 2, 3, 6, 10, 12, 15). Four chromosome substitutions (CSS-1, 3, 10, 15) had significantly reduced stiffness and maximum load relative to B6. Three substitutions (CSS-2, 6, 12) showed significant reductions in maximum load and borderline significant reductions in stiffness compared to B6. Similar results were found when adjusting stiffness and maximum load for body mass alone and also separately for the mass of the quadriceps complex (Supplemental Table 1). The changes in stiffness and maximum load were confirmed with regression analysis (e.g., Figure 2).
Table 3.
Percent differences in femoral traits between each CSS relative to B6, after adjusting for body size. Ct.Ar and TMD values presented have been further adjusted for robustness. The cumulative, signed CSS-effect and A/J properties (% difference from B6) are shown for comparison.
| Strain | Stiffness | Max Load | Robustness | Ct.Ar | TMD | PYD | Work |
|---|---|---|---|---|---|---|---|
| CSS-1 | −26.6 | −14.4 | −8.1 | −8.3 | −0.3 | −16.2 | −32.8 |
| CSS-2 | −7.9 | −13.4 | 4.6 | −6.3 | −2.0 | −76.3 | −55.4 |
| CSS-3 | −24.9 | −9.9 | 3.9 | −0.8 | 0.7 | 7.3 | 3.0 |
| CSS-4 | 8.9 | −3.3 | 11.6 | −2.1 | 1.5 | −20.7 | −21.5 |
| CSS-5 | 4.1 | −2.1 | −11.3 | 0.3 | 0.3 | −16.4 | −11.3 |
| CSS-6 | −13.1 | −16.9 | −5.2 | −1.5 | −1.2 | 28.4 | −2.5 |
| CSS-7 | 2.8 | −7.7 | 1.4 | −2.7 | 0.1 | −1.2 | −2.5 |
| CSS-8 | −3.1 | −6.1 | −10.2 | −1.8 | −0.4 | 15.0 | 12.7 |
| CSS-9 | −5.7 | −2.8 | −6.1 | 1.5 | 0.9 | 38.2 | 30.3 |
| CSS-10 | −19.8 | −14.2 | −8.9 | −2.3 | −1.0 | 1.0 | −8.6 |
| CSS-11 | 2.3 | −4.5 | −0.7 | −2.8 | 0.0 | 28.9 | 18.2 |
| CSS-12 | −13.2 | −15.7 | −7.2 | −7.3 | 2.0 | −50.4 | −52.3 |
| CSS-13 | 3.3 | 2.5 | −3.9 | 2.0 | 0.3 | 10.6 | 18.8 |
| CSS-14 | 11.5 | −4.9 | 4.0 | −1.9 | 0.6 | −19.6 | −19.3 |
| CSS-15 | −14.1 | −16.0 | −7.9 | −5.7 | 1.1 | 0.6 | −18.5 |
| CSS-16 | 2.6 | −8.2 | −2.8 | −2.6 | 0.2 | 2.1 | 0.6 |
| CSS-17 | −4.7 | −5.5 | −11.9 | 0.7 | 0.6 | 11.7 | 6.5 |
| CSS-18 | 7.2 | −1.1 | −8.0 | 3.0 | 1.0 | −11.1 | −3.7 |
| CSS-19 | −0.8 | −4.6 | −7.7 | −1.7 | −0.3 | −21.5 | −22.1 |
| CSS-X | 7.4 | 3.6 | 1.8 | 1.7 | 0.1 | −4.3 | 0.8 |
| Cumulative CSS effect | −83.8 | −145.2 | −72.6 | −38.6 | 4.2 | −93.9 | −159.6 |
| A/J | 11.3 | 4.0 | −33.2 | 7.7 | 7.5 | −62.4 | −40.5 |
Bold font indicates significant differences relative to B6. For CSSs adjusted for body size as well as body size and robustness, significance was determined with General Linear Model with an overall p-value = 0.05. Significance values obtained for A/J were based on comparisons with the B6 control, separately from CSS.
Figure 2.

Examples of the linear regression between maximum load and body size for the femora of adult CSS-6 and B6 males. The difference in y-intercept (ANCOVA) illustrates how certain chromosome substitutions disrupted the relationship between whole bone maximum load and body size (body mass x bone length).
Biomechanical mechanisms defining combinations of traits differentiating functional from dysfunctional structures
We systematically evaluated femoral robustness, cortical area, and TMD to identify the various biomechanical strategies used by CSSs to establish function or that would explain how function was compromised. Ten chromosome substitutions (CSS-1, 4, 5, 8, 10, 12, 15, 17, 18, 19) showed significant changes in robustness (Table 3), with nine of these ten substitutions tending toward the slender A/J-like phenotype. Individual substitutions altered robustness between +11.6% to −11.9%. The CSS with the most slender phenotype deviated as much as 33% of the difference in robustness between B6 and A/J. Only one substitution (CSS-4) resulted in femora that were significantly more robust than B6. The magnitude of the percent change in robustness relative to B6 was largely independent of whether data were adjusted for body size, body mass alone, or quadriceps mass (Supplemental Table 2). The only discrepancy was the addition of two CSSs (CSS-6, 9) that differed significantly from B6 when adjusted for body mass, and one CSS (CSS-3) when adjusted for quadriceps mass. Importantly, of the 10 CSSs showing a significant change in robustness, only four CSSs (CSS-1, 10, 12, 15) showed reduced function as measured by stiffness and maximum load, indicating that the remaining 6 CSSs (CSS-4, 5, 8, 17, 18, 19) adjusted other traits to maintain function despite the change in robustness.
Given that individual substitutions were associated with changes in robustness for 10 CSSs, we then tested if CSSs also adjusted Ct.Ar and TMD in a way that was expected for the changes in robustness. To accomplish this, we compared each CSS to B6 after adjusting for both robustness and body size. Four CSSs showed Ct.Ar values that were 8.3% (CSS-1), 6.3% (CSS-2), 7.3% (CSS-12), and 5.7% (CSS-15) lower than expected for their robustness and body size. The lower than expected Ct.Ar for CSS-1, 12, and 15 helps explain the reduced stiffness and maximum load for these strains. After adjusting for robustness and body size, eight strains (CSS-2, 4, 6, 9, 10, 12, 15, 18) showed TMD values that differed significantly from B6. These CSS had TMD values ranging from -2.0% lower to 2.0% higher than expected for their robustness and body size. Interestingly, CSS-3 did not show a change in robustness, Ct.Ar or TMD, but did show reduced function indicating that other trait changes must have occurred to account for the reduced mechanical function.
Emergent effects on fracture resistance properties
Chromosome substitutions affecting fracture resistance properties were identified by comparing post-yield deflection and work-to-fracture of the CSS to B6 after body size adjustments (Table 3). Two substitutions (CSS-2, 12) showed significantly reduced post-yield deflection (−76.3% and −50.4%, respectively) and work-to-fracture (−55.4% and −52.3% respectively) compared to B6, and these were similar in magnitude to that observed for A/J. The overlap in substitutions affecting post-yield deflection and work-to-fracture was expected given that work-to-fracture is calculated as the area under the load-deflection curve and is particularly sensitive to changes in post-yield deflection. The magnitude of the percent change in fracture resistance properties relative to B6 was largely independent of whether the data were adjusted for body size, body mass alone, or quadriceps mass (data not shown).
Discussion
We tested the hypothesis that a systems analysis of C57BL/6J–ChrA/J/NaJ (CSS) mice would identify chromosomes harboring genes that regulate mechanical function. We identified seven substitutions that showed altered cross-sectional morphology or TMD, but coordinately adjusted these traits in a way that established a similar level of mechanical function as B6 (CSS-4, 5, 8, 9, 17, 18, 19). Six substitutions showed altered cross-sectional morphology or TMD but significantly reduced mechanical function relative to B6 (CSS-1, 2, 6, 10, 12, 15). One substitution also showed reduced function but exhibited no significant changes in the three physical traits analyzed in this study (CSS-3). The seven substitutions with reduced mechanical function showed similar changes in robustness as the seven substitutions that maintained function, suggesting that the reduced function did not arise from a morphological perturbation (e.g., severe slenderness) that was beyond the system’s ability to compensate. All CSS harboring genes leading to reduced function overlapped with QTLs regulating bone stiffness and strength reported by others, except for CSS-3 (4,11,30–33). A key feature that distinguished CSSs that maintained function from those with reduced function was whether Ct.Ar and TMD were adjusted to the expected levels for body size and robustness (Table 3, see also Fig 3). CSSs that maintained function showed Ct.Ar and TMD values at the expected (or higher) levels for their body size and robustness. In contrast, CSSs with reduced function had lower than expected values of Ct.Ar or TMD for their robustness and body size. The only exception was CSS-3. These data suggested that reduced function occurred when the substitution impaired the degree to which the system adjusted traits to compensate for the natural variation in robustness. An alternative explanation for the reduced function of the 7 CSS would be that the individual chromosome substitutions severely perturbed other traits that were not included in the current analysis. Future studies assessing a wider range of traits would need to be conducted to test this alternate conclusion. Our results provide a novel biomechanical mechanism linking genotype with phenotype, indicating that genes regulate function and impact bone strength not only by regulating individual traits, but also by regulating the functional interactions among traits.
Figure 3.
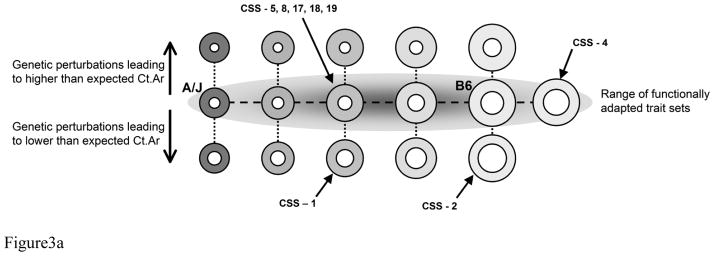

A) Schematic illustrating the range of functionally adapted trait sets for a population of mice derived from a cross between A/J and B6. The gray ellipse, which is presented in 2D, conveys the range of trait sets leading to mechanically functional femora. This ellipse is more accurately depicted by a 3D ellipsoid with mineralization perpendicular to the page. Genetic perturbations that impair the degree to which Ct.Ar and TMD are adjusted relative to robustness are expected to fall outside the ellipsoid. Examples of CSS that are functionally adapted versus those that are not are shown in the schematic. B) Illustration summarizing the various biomechanical pathways in which a complex system adapts to maintain function when faced with genetic perturbations. Femoral cross-sections were depicted as ellipses, based on body size adjusted data, to simplify the image and to convey how individual chromosome substitutions altered morphology and TMD. The shading indicates differences in TMD. Darker gray means the bone is more highly mineralized. CSSs were segregated into several groups based on whether they exhibited no differences relative to B6 (i.e., unaffected by the chromosome substitution), alterations in morphology and TMD but no change in function relative to B6, and alterations in morphology or TMD but showed reduced function. Within each group, CSSs were further segregated into sub-groups showing roughly similar sets of adult traits. Each sub-group represents CSS showing similar adaptive strategies by which the bone coordinately adjusted traits to establish function.
Complex adaptive systems accommodate genetic and environmental perturbations by “buffering” or coordinately adjusting naturally varying traits so the traits together achieve organ-level function or homeostasis (8,34–37). Networks of interactions contributing to homeostasis have been studied primarily at the molecular and protein levels (38). Much less attention has been given to the functional networks that exist at the phenotype level (36,37). Networks of trait interactions at the phenotype-level are important, because the functionality of physiological systems like bone, heart, cartilage, and lung depend on their ability to precisely regulate structure and tissue-properties to achieve organ-level function. CSSs that established mechanical properties similar to B6 showed changes in morphology and composition that were consistent with the pattern (network) of functional trait interactions derived from an analysis of AXB/BXA Recombinant Inbred mouse strains (10). A similar network of trait interactions has also been observed for human bone (20,39). This network provided a systematic method to evaluate whether the CSS adjusted individual trait values to the degree needed to establish the same level of mechanical function as B6. For example, CSS femora that were slender (narrow relative to length) and maintained function also tended to show higher TMD values (CSS-5, 8, 9, 17, 18, 19). This interaction would indicate that cellular processes increased tissue-stiffness to mechanically offset the small cross- sectional size (40).
The network of interactions among three traits (robustness, Ct.Ar, TMD) explained the variation in function for 19 of the 20 CSSs, indicating that adaptive networks at the phenotype-level play a critical role in the genotype-phenotype relationship. The underlying molecular network(s) that regulates these functional trait interactions is unknown. Our data showed that for the 13 CSSs that maintained function, similar functional outcomes arose from different genetic perturbations (Figure 3). Likewise, for the 7 CSSs that failed to maintain function, relatively similar degrees of reduced mechanical function arose from different genetic perturbations. This genetic heterogeneity is expected to complicate genetic analyses, because it means genotype and phenotype are not uniquely related (41). A comparison of CSSs with impaired function did not reveal a single biomechanical pathway explaining how these particular chromosome substitutions lead to reduced stiffness and maximum load. For a simple model system (i.e., hollow cylinder), we observed five distinct biomechanical pathways that led to reduced function resulting from impairments in the degree to which the system adjusted Ct.Ar and/or TMD relative to body size and robustness (Fig 3). Finding that reduced function arose from multiple biomechanical pathways is an important outcome of this study, and is consistent with prior human studies showing that increased risk of developing stress fractures during military training also arises through multiple biomechanical pathways (42).
Traditionally, genetic studies are often conducted assuming that variation in a phenotype of clinical interest (e.g., BMD, fracture incidence) arises from a common set of genes. Our data showed that the genetic heterogeneity associated with the functional adaptation process may complicate the choice of phenotype that should be used in genetic analyses to identify genes that regulate strength. For example, if cortical area adjusted for body size was used to identify chromosomes harboring genes that impaired mechanical function, then we would have accurately predicted four of the seven strains with decreased function (CSS-1, 10, 12, 15); missed three of the strains with decreased function (CSS-2, 3, 6); and incorrectly designated four strains (CSS-5, 8, 17, 19) as having reduced function when in fact each adjusted other traits to establish normal function. Thus, our results indicate a) that different genetic perturbations lead to similar functional outcomes (genetic heterogeneity), b) that reliance on simple bone traits or combinations of traits unrelated to functional adaptations may not reliably identify QTLs that affect bone strength and fracture resistance, and c) that the phenotype used in genetic analyses may be better defined by the set of traits acquired in the context of mechanical function rather than a single trait.
We segregated the mechanical properties related to functional adaptation (i.e., stiffness) from those that are related to fracture resistance (e.g., maximum load, post-yield deflection, work-to-fracture) (Fig 1B). Although fracture is a clinically important event, we felt it necessary to distinguish the biological machinery engaged to buffer genetic perturbations based on a functional endpoint pertaining to daily loading conditions from the mechanical resistance to rare loading events that could lead to a fracture. This study was powered to achieve statistically meaningful differences for measures like stiffness and maximum load but not the failure properties, which typically show greater coefficients of variation. Nevertheless, we identified two strains (CSS-2, 12) that showed 50–76% reductions in post-yield deflection, indicating that these substitutions resulted in significantly more brittle femurs. Changes in post-yield mechanical properties typically arise from alterations in matrix composition and organization (43). Neither CSS-2 nor 12 showed remarkable changes in TMD (absolute values) that would account for the increased brittleness, suggesting that other matrix properties (e.g., collagen fibrillogenesis, cross-linking) may be altered in these two strains.
There are several limitations of our analysis that should be addressed. The current study focused on the femur of adult male CSS mice. Adult female CSSs also showed changes in robustness for chromosomes 18 and 19 (18). However, CSS-19 showed opposite effects in males and females. Ct.Ar and TMD were adjusted for body size but not robustness in the prior study and so these outcomes are not comparable. We and others identified QTLs regulating the interaction among traits (4,5,9,18,30,44,45). However, these studies were not conducted explicitly in the context of functional adaptations and thus it is difficult to compare the QTLs identified previously with the outcomes reported here. The tube-like structure of the femoral diaphysis is a relatively straightforward biological system to understand in engineering terms and thus provided an appropriate model to begin understanding how to integrate functional adaptation with genetic analyses. We simplified the systems analysis by focusing on three functionally interacting traits (robustness, Ct.Ar, TMD) that together explain the majority of the variation in whole bone mechanical function (18). We recognize that three traits cannot fully explain all adaptive mechanisms, as evidenced by our inability to explain functional changes in CSS-3 and post-yield property changes in CSS-2 and 12. Future work can examine individual CSSs at multiple ages and with a broader array of traits (e.g., collagen organization, mineral to matrix ratio) that other work (46) has shown to contribute to the variation in bone strength.
In conclusion, the results of the current study showed that functional adaptations play a critical role in the genotype-phenotype relationship. Although tremendous advances have been made in the computational aspects of genetic analyses (47), comparatively less attention has been given to the choice of phenotype. For bone, the phenotype used in genetic analyses has been largely based on clinical measures used to screen individuals for osteoporosis, such as BMD. This complex trait does not provide the details of morphology, tissue-level mechanical properties, and their interactions, which our analysis showed are needed to understand how genetic perturbations affect mechanical function. Subdividing complex measures like BMD into simpler, more refined traits was shown to increase statistical power for mapping QTLs (48) and to better relate traits to the biological processes associated with the genes located within candidate loci (49). The genetic heterogeneity observed in the current study suggests that individuals may arrive at similar phenotypes through different biomechanical pathways. Combining all individuals into a single population does not recognize these genetically and biomechanically distinct pathways and may confound statistical associations between genotype and phenotype. Our data indicated that reduced function arose most often when chromosome substitutions disrupted the normal pattern of functional trait interactions. This outcome provides a novel biomechanical mechanism linking genotype with phenotype. Thus, efforts aimed at identifying genes regulating fracture resistance may benefit from targeting the functional interaction among traits (7–9,38) and thus how the emergent set of traits defines the repertoire of fracture resistance properties.
Supplementary Material
Highlights.
Genes regulate bone strength not only by regulating individual traits, but also by regulating the functional interactions among traits.
Systematic analysis of chromosome substitution strains identified 7 chromosomes harboring genes that impair function.
The complex adaptive nature of the skeletal system complicates the genotype-phenotype relationship, making individual traits unreliable predictors of bone fragility.
CSSs that maintained function adjusted cortical area and tissue mineral density to expected levels for body size and robustness.
Reduced function arose most often when chromosome substitutions disrupted the normal pattern of functional trait interactions.
Acknowledgments
Research reported in this publication was supported by the National Institutes of Health under award numbers AR44927 and S10RR026336 to KJJ and RR12305 to JHN. The content is solely the responsibility of the authors and does not necessarily represent the official views of the National Institutes of Health. We thank Dr. Stephen Schlecht and Melissa Ramcharan for their assistance in data collection.
Footnotes
Disclosures
All authors state that they have no conflicts of interest.
Publisher's Disclaimer: This is a PDF file of an unedited manuscript that has been accepted for publication. As a service to our customers we are providing this early version of the manuscript. The manuscript will undergo copyediting, typesetting, and review of the resulting proof before it is published in its final citable form. Please note that during the production process errors may be discovered which could affect the content, and all legal disclaimers that apply to the journal pertain.
References
- 1.Beamer WG, Shultz KL, Donahue LR, et al. Quantitative trait loci for femoral and lumbar veterbral bone mineral density in C57BL/6J and C3H/HeJ Inbred Strains of Mice. J Bone Miner Res. 2001;16(7):1195–1206. doi: 10.1359/jbmr.2001.16.7.1195. [DOI] [PubMed] [Google Scholar]
- 2.Judex S, Garman R, Squire M, Donahue LR, Rubin C. Genetically based influences on the site-specific regulation of trabecular and cortical bone morphology. J Bone Miner Res. 2004;19 (4):600–6. doi: 10.1359/JBMR.040101. [DOI] [PubMed] [Google Scholar]
- 3.Sabsovich I, Clark JD, Liao G, et al. Bone microstructure and its associated genetic variability in 12 inbred mouse strains: microCT study and in silico genome scan. Bone. 2008;42(2):439–51. doi: 10.1016/j.bone.2007.09.041. [DOI] [PMC free article] [PubMed] [Google Scholar]
- 4.Koller DL, Schriefer J, Sun Q, et al. Genetic effects for femoral biomechanics, structure, and density in C57BL/6J and C3H/HeJ inbred mouse strains. J Bone Miner Res. 2003;18(10):1758–65. doi: 10.1359/jbmr.2003.18.10.1758. [DOI] [PubMed] [Google Scholar]
- 5.Saless N, Litscher SJ, Vanderby R, Demant P, Blank RD. Linkage mapping of principal components for femoral biomechanical performance in a reciprocal HCB-8 x HCB-23 intercross. Bone. 2011;48(3):647–53. doi: 10.1016/j.bone.2010.10.165. [DOI] [PMC free article] [PubMed] [Google Scholar]
- 6.Karasik D, Cheung CL, Zhou Y, Cupples LA, Kiel DP, Demissie S. Genome-wide association of an integrated osteoporosis-related phenotype: is there evidence for pleiotropic genes? J Bone Miner Res. 2012;27(2):319–30. doi: 10.1002/jbmr.563. [DOI] [PMC free article] [PubMed] [Google Scholar]
- 7.Olson E, Miller R. 1958 Morphological Integration. Chicago: The University of Chicago Press, Ltd; 1958. [Google Scholar]
- 8.Cheverud JM. Phenotypic, genetic, and environmental morphological integration in the cranium. Evolution. 1981;36(3):499–516. doi: 10.1111/j.1558-5646.1982.tb05070.x. [DOI] [PubMed] [Google Scholar]
- 9.Saless N, Litscher SJ, Houlihan MJ, et al. Comprehensive skeletal phenotyping and linkage mapping in an intercross of recombinant congenic mouse strains HcB-8 and HcB-23. Cells Tissues Organs. 2011;194(2–4):244–8. doi: 10.1159/000324774. [DOI] [PMC free article] [PubMed] [Google Scholar]
- 10.Jepsen KJ, Hu B, Tommasini SM, et al. Genetic randomization reveals functional relationships among morphologic and tissue-quality traits that contribute to bone strength and fragilty. Mamm Genome. 2007;18:192–507. doi: 10.1007/s00335-007-9017-5. [DOI] [PMC free article] [PubMed] [Google Scholar]
- 11.Yershov Y, Baldini TH, Villagomez S, et al. Bone strength and related traits in HcB/Dem recombinant congenic mice. J Bone Miner Res. 2001;16(6):992–1003. doi: 10.1359/jbmr.2001.16.6.992. [DOI] [PubMed] [Google Scholar]
- 12.Estrada K, Styrkarsdottir U, Evangelou E, et al. Genome-wide meta-analysis identifies 56 bone mineral density loci and reveals 14 loci associated with risk of fracture. Nat Genet. 2012;44 (5):491–501. doi: 10.1038/ng.2249. [DOI] [PMC free article] [PubMed] [Google Scholar]
- 13.Havill LM, Coan HB, Mahaney MC, Nicolella DP. Characterization of complex, co-adapted skeletal biomechanics phenotypes: a needed paradigm shift in the genetics of bone structure and function. Curr Osteoporos Rep. 2014;12(2):174–80. doi: 10.1007/s11914-014-0211-6. [DOI] [PMC free article] [PubMed] [Google Scholar]
- 14.Frost HM. Bone "Mass" and the "Mechanostat": a proposal. Anat Rec. 1987;219:1–9. doi: 10.1002/ar.1092190104. [DOI] [PubMed] [Google Scholar]
- 15.Frost HM. Bone's mechanostat: a 2003 update. Anat Rec. 2003;275(2):1081–101. doi: 10.1002/ar.a.10119. [DOI] [PubMed] [Google Scholar]
- 16.Govoni KE, Donahue LR, Marden C, Mohan S. Complex genetic regulation of bone mineral density and insulin-like growth factor-I in C57BL/6J-Chr#A/J/NaJ chromosome substitution strains. Physiol Genomics. 2008;35:159–164. doi: 10.1152/physiolgenomics.90203.2008. [DOI] [PMC free article] [PubMed] [Google Scholar]
- 17.Reed DR, McDaniel AH, Avigdor M, Bachmanov AA. QTL for body composition on chromosome 7 detected using a chromosome substitution mouse strain. Obesity. 2008;16(2):483–87. doi: 10.1038/oby.2007.26. [DOI] [PMC free article] [PubMed] [Google Scholar]
- 18.Jepsen KJ, Courtland HW, Nadeau JH. Genetically determined phenotype covariation networks control bone strength. J Bone Miner Res. 2010;25(7):1581–93. doi: 10.1002/jbmr.41. [DOI] [PMC free article] [PubMed] [Google Scholar]
- 19.Jepsen KJ, Akkus OJ, Majeska RJ, Nadeau JH. Hierarchical relationship between bone traits and mechanical properties in inbred mice. Mamm Genome. 2003;14(2):97–104. doi: 10.1007/s00335-002-3045-y. [DOI] [PubMed] [Google Scholar]
- 20.Tommasini SM, Nasser P, Hu B, Jepsen KJ. Biological co-adaptation of morphological and composition traits contributes to mechanical functionality and skeletal fragility. J Bone Miner Res. 2008;23(2):236–46. doi: 10.1359/JBMR.071014. [DOI] [PMC free article] [PubMed] [Google Scholar]
- 21.Schlecht SH, Jepsen KJ. Functional integration of skeletal traits: an intraskeletal assessment of bone size, mineralization, and volume covariance. Bone. 2013;56(1):127–38. doi: 10.1016/j.bone.2013.05.012. [DOI] [PMC free article] [PubMed] [Google Scholar]
- 22.Meganck JA, Kozloff KM, Thornton MM, Broski SM, Goldstein SA. Beam hardening artifacts in micro-computed tomography scanning can be reduced by X-ray beam filtration and the resulting images can be used to accurately measure BMD. Bone. 2009;45(6):1104–16. doi: 10.1016/j.bone.2009.07.078. [DOI] [PMC free article] [PubMed] [Google Scholar]
- 23.Otsu N. A threshold selection method from gray-level histograms. IEEE T Syst Man Cyb. 1979;SMC-9(1):62–6. [Google Scholar]
- 24.Jepsen KJ, Goldstein SA, Kuhn JL, Schaffler MB, Bonadio J. Type-I collagen mutation compromises the post-yield behavior of Mov13 long bone. J Orthop Res. 1996;14:493–99. doi: 10.1002/jor.1100140320. [DOI] [PubMed] [Google Scholar]
- 25.Jepsen KJ, Pennington DE, Lee Y-L, Warman M, Nadeau JH. Bone brittleness varies with genetic background in A/J and C57BL/6J inbred mice. J Bone Miner Res. 2001;16:1854–1862. doi: 10.1359/jbmr.2001.16.10.1854. [DOI] [PubMed] [Google Scholar]
- 26.Rubin CT. Skeletal strain and the functional significance of bone architecture. Calcif Tissue Int. 1984;36:11–18. doi: 10.1007/BF02406128. [DOI] [PubMed] [Google Scholar]
- 27.Selker F, Carter DR. Scaling of long bone fracture strength with animal mass. J Biomech. 1989;22 (11/12):1175–1183. doi: 10.1016/0021-9290(89)90219-4. [DOI] [PubMed] [Google Scholar]
- 28.Belknap JK. Chromosome substitution strains: some quantitative considerations for genome scans and fine mapping. Mamm Genome. 2003;14:723–732. doi: 10.1007/s00335-003-2264-1. [DOI] [PubMed] [Google Scholar]
- 29.Nadeau JH, Singer JB, Matin A, Lander ES. Analysing complex genetic traits with chromosome substitution strains. Nat Genet. 2000;24:221–5. doi: 10.1038/73427. [DOI] [PubMed] [Google Scholar]
- 30.Li X, Masinde G, Gu W, Wergedal J, Mohan S, Baylink DJ. Genetic dissection of femur breaking strength in a large population (MRL/MpJ x SJL/J) of F2 Mice: single QTL effects, epistasis, and pleiotropy. Genomics. 2002;79(5):734–40. doi: 10.1006/geno.2002.6760. [DOI] [PubMed] [Google Scholar]
- 31.Turner CH, Sun Q, Schriefer J, et al. Congenic mice reveal sex-specific genetic regulation of femoral structure and strength. Calcif Tissue Int. 2003;73(3):297–303. doi: 10.1007/s00223-002-1062-1. [DOI] [PubMed] [Google Scholar]
- 32.Lang DH, Sharkey NA, Mack HA, et al. Quantitative trait loci analysis of structural and material skeletal phenotypes in C57BL/6J and DBA/2 second-generation and recombinant inbred mice. J Bone Miner Res. 2005;20(1):88–99. doi: 10.1359/JBMR.041001. [DOI] [PMC free article] [PubMed] [Google Scholar]
- 33.Saless N, Litscher SJ, Lopez Franco GE, et al. Quantitative trait loci for biomechanical performance and femoral geometry in an intercross of recombinant congenic mice: restriction of the Bmd7 candidate interval. FASEB J. 2009;23(7):2142–54. doi: 10.1096/fj.08-118679. [DOI] [PubMed] [Google Scholar]
- 34.Waddington CH. Canalization of development and the inheritance of acquired characters. Nature. 1942;(3811):563–565. doi: 10.1038/1831654a0. [DOI] [PubMed] [Google Scholar]
- 35.Hoit BD, Kiatchoosakun S, Restivo J, et al. Naturally occurring variation in cardiovascular traits among inbred mouse strains. Genomics. 2002;79(5):679–85. doi: 10.1006/geno.2002.6754. [DOI] [PubMed] [Google Scholar]
- 36.Nadeau JH, Burrage LC, Restivo J, Pao YH, Churchill G, Hoit BD. Pleiotropy, homeostasis, and functional networks based on assays of cardiovascular traits in genetically randomized populations. Genome Res. 2003;13(9):2082–91. doi: 10.1101/gr.1186603. [DOI] [PMC free article] [PubMed] [Google Scholar]
- 37.Marder E, Goaillard JM. Variability, compensation and homeostasis in neuron and network function. Nat Rev Neurosci. 2006;7(7):563–74. doi: 10.1038/nrn1949. [DOI] [PubMed] [Google Scholar]
- 38.Sahni N, Yi S, Zhong Q, et al. Edgotype: a fundamental link between genotype and phenotype. Curr Opin Genet Dev. 2013;23(6):649–57. doi: 10.1016/j.gde.2013.11.002. [DOI] [PMC free article] [PubMed] [Google Scholar]
- 39.Jepsen KJ. Functional interactions among morphologic and tissue quality traits define bone quality. Clin Orthop Relat Res. 2011;469(8):2150–9. doi: 10.1007/s11999-010-1706-9. [DOI] [PMC free article] [PubMed] [Google Scholar]
- 40.Courtland HW, Spevak M, Boskey AL, Jepsen KJ. Genetic variation in mouse femoral tissue-level mineral content underlies differences in whole bone mechanical properties. Cells Tissues Organs. 2009;189(1–4):237–40. doi: 10.1159/000151381. [DOI] [PMC free article] [PubMed] [Google Scholar]
- 41.McClellan J, King MC. Genetic heterogeneity in human disease. Cell. 2010;141(2):210–7. doi: 10.1016/j.cell.2010.03.032. [DOI] [PubMed] [Google Scholar]
- 42.Jepsen KJ, Evans R, Negus CH, et al. Variation in tibial functionality and fracture susceptibility among healthy, young adults arises from the acquisition of biologically distinct sets of traits. J Bone Miner Res. 2013;28(6):1290–300. doi: 10.1002/jbmr.1879. [DOI] [PubMed] [Google Scholar]
- 43.Donnelly E, Chen DX, Boskey AL, Baker SP, van der Meulen MC. Contribution of mineral to bone structural behavior and tissue mechanical properties. Calcif Tissue Int. 2010;87(5):450–60. doi: 10.1007/s00223-010-9404-x. [DOI] [PMC free article] [PubMed] [Google Scholar]
- 44.Li R, Tsaih SW, Shockley KR, et al. Structural model analysis of multiple quantitative traits. PLOS Genetics. 2006;2(7):1046–57. doi: 10.1371/journal.pgen.0020114. [DOI] [PMC free article] [PubMed] [Google Scholar]
- 45.Saless N, Lopez Franco GE, Litscher S, et al. Linkage mapping of femoral material properties in a reciprocal intercross of HcB-8 and HcB-23 recombinant mouse strains. Bone. 2010;46 (5):1251–9. doi: 10.1016/j.bone.2010.01.375. [DOI] [PMC free article] [PubMed] [Google Scholar]
- 46.Judex S, Boyd S, Qin Y-X, Miller L, Müller R, Rubin C. Combining high–resolution microcomputed tomography with material composition to define the quality of bone tissue. Curr Osteoporos Rep. 2003;1:11–19. doi: 10.1007/s11914-003-0003-x. [DOI] [PubMed] [Google Scholar]
- 47.Moreau Y, Tranchevent LC. Computational tools for prioritizing candidate genes: boosting disease gene discovery. Nat Rev Genet. 2012;13(8):523–36. doi: 10.1038/nrg3253. [DOI] [PubMed] [Google Scholar]
- 48.Huang Q-Y, Xu F-H, Shen H, et al. Genome scan for QTLs underlying bone size variation at 10 refined skeletal sites: genetic heterogeneity and the significance of phenotype refinement. Physiol Genomics. 2004;17:326–331. doi: 10.1152/physiolgenomics.00161.2002. [DOI] [PubMed] [Google Scholar]
- 49.Koller DL, Liu G, Econs MJ, et al. Genome screen for quantitative trait loci underlying normal variation in femoral structure. J Bone Miner Res. 2001;16(6):985–91. doi: 10.1359/jbmr.2001.16.6.985. [DOI] [PubMed] [Google Scholar]
Associated Data
This section collects any data citations, data availability statements, or supplementary materials included in this article.