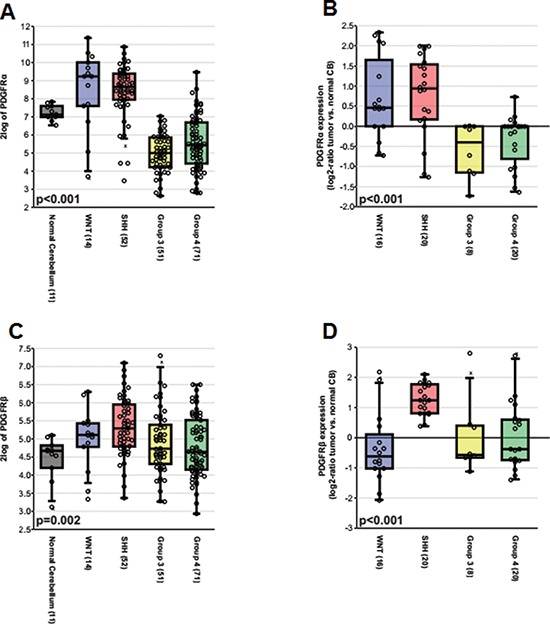
Figure 1. The subgroup specific expression of PDGFRα and PDGFRβ in primary MB.

(A) Boxplot showing PDGFRα expression in normal adult cerebellar samples and MB subgroups based on the Boston cohort (n = 199). (B) Relative expression of PDGFRα as a log2-ratio compared to a pool of normal cerebellar samples according to MB subgroups based on the Heidelberg cohort (n = 64). (C) Boxplot showing PDGFRβ expression in normal adult cerebellar samples and MB subgroups based on the Boston cohort. (D) Relative expression of PDGFRβ as a log2-ratio compared to a pool of normal cerebellar samples according to MB subgroups based on the Heidelberg cohort.
