
Figure 2. Imatinib induces mast cell deficiency in the bone marrow of patients with CML.
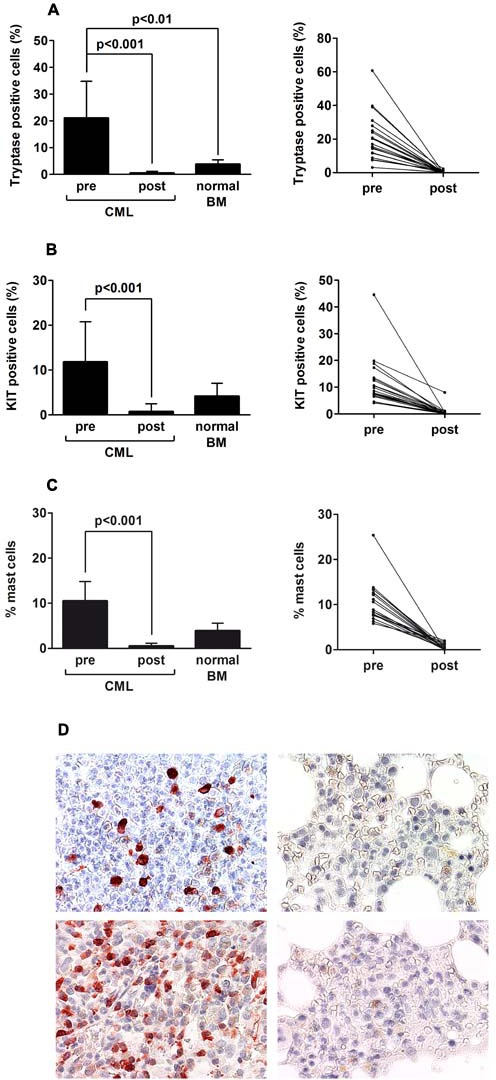
Bone marrow (BM) biopsy material was obtained from patients with CML (n=23) at diagnosis and at the time of major or complete molecular response and at least 2 years on therapy with imatinib (400 mg/day). In addition, control BM section from 5 patients were examined. Serial sections were prepared from paraffin-embedded BM specimens and stained with antibodies against tryptase (A) and against KIT (B) by indirect immunohistochemistry as well as by Giemsa-staining (C). The percentages of tryptase+ mast cells (MC) and KIT+ MC relative to all nucleated BM cells (500 cells counted), was determined using an Olympus AX-1 microscope equipped with 100x/1.35 UPlan-Apo objective lens. Results in the left panels represent the mean±S.D. (percent-values) from all donors before and after therapy, and a comparison to normal control BM samples (n=5). The right panels show the percentages of tryptase+ MC and KIT+ MC in each individual patient before and after therapy. In C, the numbers of MC was determined by Giemsa-staining (percent of all nucleated BM cells) using an Olympus AX-1 microscope. Results in the left panel represent the mean±S.D. from all donors before and after therapy, and a comparison to normal control BM samples (n=5). The right panel shows the percentages of MC in each individual patient. D: Examples of BM sections stained for tryptase (upper panels) and KIT (lower panels) at diagnosis (upper and lower left panels) and at the time of re-investigation (upper and lower right panels) by indirect immunohistochemistry. Cells were analyzed using an Olympus AX-1 microscope equipped with 40x/0.85 UPlan-Apo objective lens. Images were taken using an Olympus DP21 camera and adjusted by Adobe Photoshop CS2 software Version 9.0 (Adobe Systems).