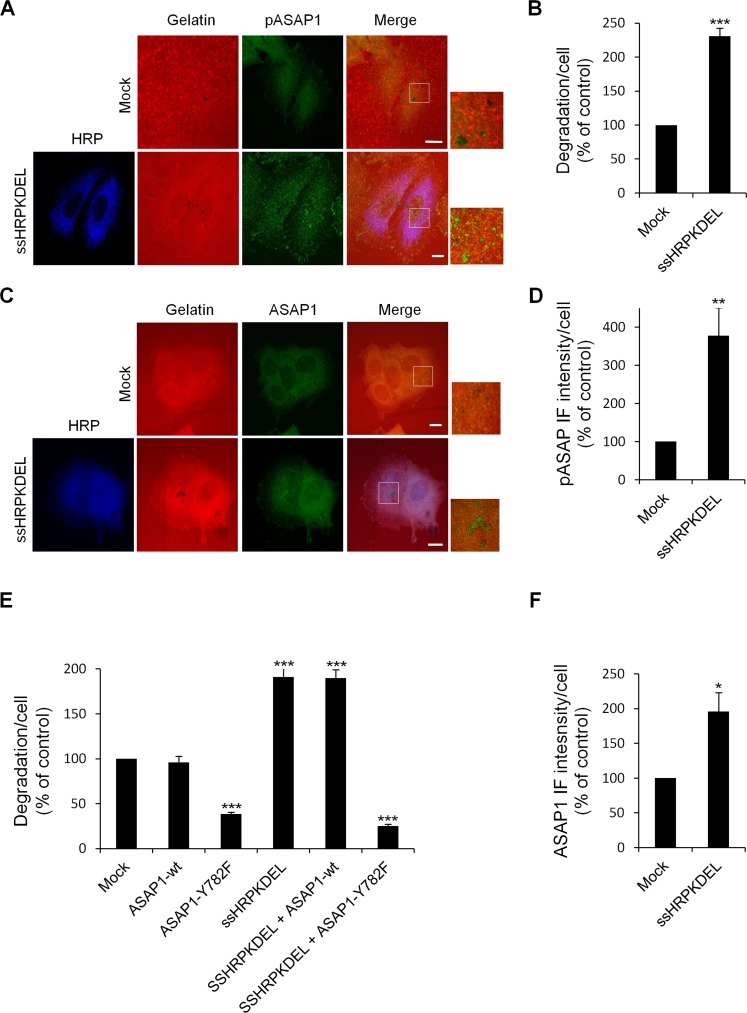
Figure 9. ASAP1 is involved in KDELR-dependent ECM degradation.
(A) KDELR stimulation increases the levels of phosphorylated ASAP1 in areas of ECM degradation. A375MM cells were transfected with the empty vector (Mock) or ssHRPKDEL, and grown on rhodamine-conjugated crosslinked gelatine (red) for 16 h in the presence of BB94. Following BB94 wash-out, the cells were incubated for a further 3 h and then fixed and stained for pASAP1 (pTyr 782, green). An anti-HRP antibody (blue) was used to visualise ssHRPKDEL-transfected cells. Merged images of red and green (Mock) and red, green and blue signals are also shown (Merge). pASAP1 immunofluorescence overlapping the degradation patches are shown in the enlargements of the boxed regions (small right panels: red and green signals). The images are representative of three independent experiments. (B) Quantification of the degradation area per cell. Data are degradation area per cell (% of control), as means ±SEM of three independent experiments. In each experiment, at least 100 cells were quantified. (C) KDELR stimulation increases ASAP1 recruitment to areas of degradation. A375MM cells were treated as in A, fixed, and stained for ASAP1 (green). An anti-HRP antibody (blue) was used to visualise ssHRPKDEL-transfected cells. Merged images of red and green (Mock) and red, green and blue signals are also shown (Merge). ASAP1 immunofluorescence overlapping the degradation patches are shown in the enlargements of the boxed regions (small right panels: red and green signals). The images are representative of three independent experiments. (D) Quantification of pASAP1 immunofluorescence in the cell regions overlapping the ECM degradation patches. Data are means ±SEM of pASAP1 immunofluorescence per cell (% of control), of three independent experiments. In each experiment at least 100 cells were quantified. (A, C) Scale bars, 10 μm. (E) The ASAP1 Y782F mutant inhibit ECM degradation. A375MM cells were transfected with empty vector (Mock), Flag-tagged ASAP1-wt or the Flag-tagged ASAP1 Y782F mutant. The cells were also transfected with myc-tagged ssHRPKDEL, myc-tagged ssHRPKDEL and ASAP1-wt, or myc-tagged ssHRPKDEL and ASAP1 Y782F. Following BB94wash-out, the cells were incubated for a further 3 h, then fixed, stained and scored for degradation of the ECM. Quantification of the degradation area per cell. Data are means ±SEM, as indicated for B. ***p<0.001, ASAP1 Y782F versus Mock; ssHRPKDEL versus Mock; ssHRPKDEL + ASAP1 Y782F versus ssHRPKDEL (t test). (F) Quantification of ASAP1 immunofluorescence intensity in the cell regions overlapping the ECM degradation patches. Data are means ±SEM of ASAP1 immunofluorescence per cell (% of control), of three independent experiments. In each experiment at least 100 cells were quantified. (B, D, F) ***p <0.001, **p <0.01, *p <0.05 compared to Mock cells (t-test).

