

Abstract
Spiral waves are a basic feature of excitable systems. Although such waves have been observed in a variety of biological systems, they have not been observed in the mammalian cortex during neuronal activity. Here, we report stable rotating spiral waves in rat neocortical slices visualized by voltage-sensitive dye imaging. Tissue from the occipital cortex (visual) was sectioned parallel to cortical lamina to preserve horizontal connections in layers III-V (500-μm-thick, ∼4 × 6 mm2). In such tangential slices, excitation waves propagated in two dimensions during cholinergic oscillations. Spiral waves occurred spontaneously and alternated with plane, ring, and irregular waves. The rotation rate of the spirals was ∼10 turns per second, and the rotation was linked to the oscillations in a one-cycle- one-rotation manner. A small (<128 μm) phase singularity occurred at the center of the spirals, about which were observed oscillations of widely distributed phases. The phase singularity drifted slowly across the tissue (∼1 mm/10 turns). We introduced a computational model of a cortical layer that predicted and replicated many of the features of our experimental findings. We speculate that rotating spiral waves may provide a spatial framework to organize cortical oscillations.
Keywords: voltage-sensitive dye, tangential slice, optical imaging, oscillation, partial differential equations, spiral waves
Introduction
A spiral wave in the broadest sense is a rotating wave traveling outward from a center. Such spiral waves have been observed in many systems (Winfree, 2001; Murray, 2003), including biological systems, such as heart ventricular fibrillation (Davidenko et al., 1992), retinal spreading depression (Gorelova and Bures, 1983), fertilizing Xenopus oocyte calcium waves (Lechleiter et al., 1991), and glial calcium waves in cortical tissue culture (Verkhratsky et al., 1998). Although neuronal traveling waves have been observed in many systems from invertebrates to mammals (Ermentrout and Kleinfeld, 2001), spiral waves of neuronal activity have not been confirmed in mammalian brain despite considerable effort (Petsche et al., 1974; Fuchs et al., 1987; Friedrich et al., 1991).
Demonstrating a true spiral wave requires that the medium under study be relatively smooth and isotropic. Such demonstrations must exclude spurious rotation of the measured activity as a result of spatial undulations in the excitable medium and its properties (e.g., human EEG cannot detect true spirals if recorded on a scale larger than a single gyrus or from the scalp). If one labels the phases of oscillation at each point in the medium, a “phase singularity” should be observed at the center that distinguishes spiral waves from other kinds of rotating waves (Winfree, 2001). The most rigorous demonstration of spiral wave formation in cortex that we are aware of is the finding of phase singularities in optical imaging of turtle visual cortex, which demonstrated circular waves persisting for up to four rotations (Prechtl et al., 1997).
Although circular waves were predicted from early models of cortical activity (Beurle, 1956), true spiral wave formation was not observed until the more sophisticated Wilson-Cowan formulation (Wilson and Cowan, 1972, 1973) and modern computing simulation strategies (Milton et al., 1993). Our experimental work was inspired by such theoretical considerations. Nevertheless, a close link between computational models of spiral wave formation in cortex and experiment has not been attempted previously.
In this report, we present evidence for stable spiral waves (up to 30 cycles) in rat neocortical slices with robust phase singularities. We also introduce a computational model of a cortical layer that predicts and replicates many of the features of our experimental findings. Our results suggest the possibility that spiral dynamics participate in the spatial organization of prolonged and periodical activities such as seizures and oscillations in neocortex related to sensory and motor events.
Materials and Methods
Tangential slice. Neocortical slices were obtained from Sprague Dawley rats (postnatal days 21-35). Tangential slices were cut with a vibratome on the rostrocaudal and mediolateral coordinates of bregma -2 to -8 mm and lateral 1-6 mm, respectively (see Fig. 1, left). The first cut was made 300 μm deep from the pial surface, and the tissue was discarded. The second cut was made 500 μm deeper to obtain a 500-μm-thick slice of middle cortical layers. The slice was perfused with artificial CSF (ACSF) containing the following (in mm): 132 NaCl, 3 KCl, 2 CaCl2, 2 MgSO4, 1.25 NaH2PO4, 26 NaHCO3, and 10 dextrose (saturated with 95% O2 and 5% CO2 at 28°C for 1 hr before experiments). When the slices were perfused with 100 μm carbachol and 10 μm bicuculline, oscillations (4-15 Hz) occurred spontaneously, and the activity appeared as spiral and other waves in the voltage-sensitive dye imaging. These activities lasted as long as the preparation was perfused with carbachol and bicuculline, similar to coronal slices (Lukatch and MacIver, 1997; Bao and Wu, 2003).
Figure 1.

Preparation and optical signals. Left, Tangential slices from occipital (visual) cortex. The slice was 6 × 8 mm (horizontal dimensions) and 500 μm thick, containing cortical layers III-V. The field of view for optical recording was 3.2 or 4 mm in diameter (circle, broken line). Optical and electrical recordings from one location (black dot) are shown on the right. Right, Optical signals (O) and local field potential (E) during rest and oscillation. Calibration: 10-4 of resting light intensity (optical), 0.4 mV (local field potentials).
Voltage-sensitive dye imaging. An oxonol dye, NK3630 (Nippon Kankoh-Shikiso Kenkyusho, Okayama, Japan) was used as an indicator of transmembrane potential. Slices were stained with 5-10 μg/ml of dye dissolved in ACSF for 60-120 min (26°C) and perfused in a submersion chamber during the experiment (28°C). Imaging was performed with a photodiode array on an upright microscope with transillumination (absorption) arrangement (Wu et al., 1999; Jin et al., 2002). Data were analyzed using NeuroPlex software (RedShirtImaging, Fairfield, CT) and displayed in the form of traces (see Figs. 1, 2 B, 3) (digitally filtered 2-50 Hz) and pseudocolor images (see Figs. 2 A, 3A) (digitally filtered 3-30 Hz). Supplementary movies S1-S4 (supplemental material, available at www.jneurosci.org) are made with consecutive pseudocolor images.
Figure 2.
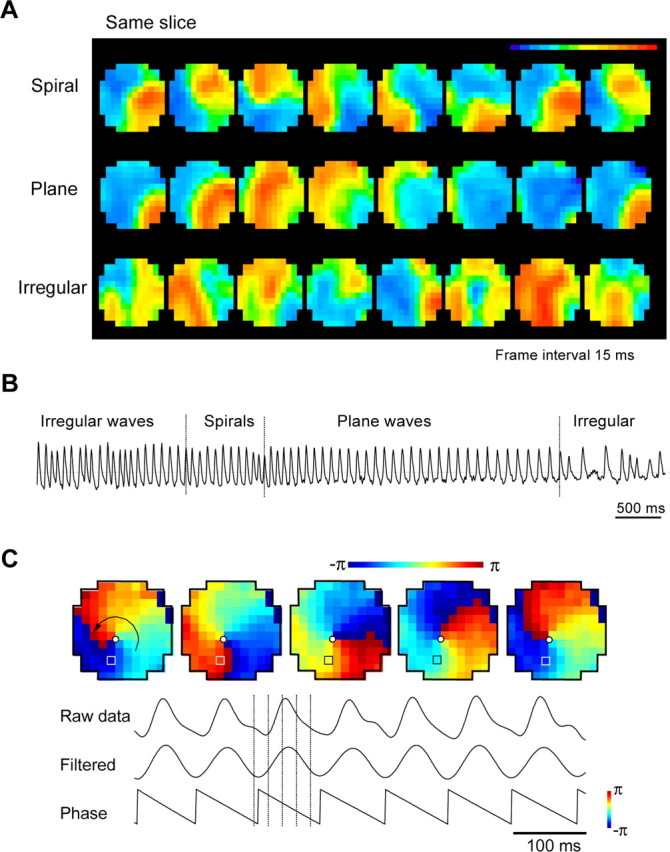
Wave patterns in tangential slices. A, Spiral, plane, and irregular waves seen from the same field of one slice. Colors represent the amplitude of the signal following a linear color scale (top right). Images are 1 msec snapshots of the waveforms, selected from ∼160,000 images of the same field of view (movies 1-3, available at www.jneurosci.org as supplemental material). B, Trace from one optical detector during one oscillation epoch showing alternation of three wave patterns. Note that, when the wave pattern alters, oscillations from a single detector do not show distinguishing changes. C, Phase singularity. Images show phase distribution in field of view. The phase on each location is assigned a color on a linear color scale (top right). All images are 1 msec snapshots (field of view, 4 × 4 mm). The phase singularity (white dot) is defined as a point at which the spatial phase gradient among four neighboring detectors is maximal. Bottom, Method for converting the amplitude in to phase. Top, Raw data from optical detector(location marked by box). Center and bottom, Data projected onto multitapered filter centered at ∼13 Hz and the assigned phase, respectively. Broken vertical lines in the traces mark the times at which the snapshots of the images were taken.
Figure 3.
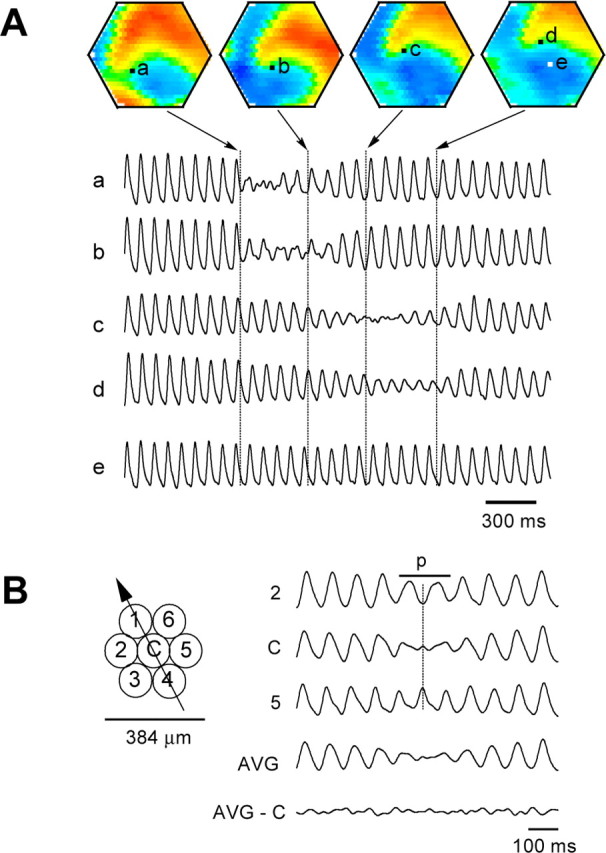
Amplitude reduction. A, Amplitude snapshots. The spirals started at approximately the time of the first image on the left and ended at approximately the last image. Traces a-e, Optical signals from five detectors (locations marked a-e). Broken vertical lines in traces mark image times. During spiral waves, the four detectors, a-d, alternately recorded reduced amplitude as the spiral center approached each detector in turn. Note that detector e, to which the spiral center never reached, has high amplitude throughout the entire period. B, Left, The trajectory (arrow) of a spiral center moving through a group of optical detectors (1-6 and C). Right, Signals from the detectors mapped at left. Mark p indicates the time during which the spiral hovered over the center detector. The surrounding detectors (2, 5) did not show amplitude reduction, but the oscillation phases exactly opposed each other. AVG, Averaged signal of six surrounding detectors showed amplitude reduction similar to that on the center detector (C). AVG-C, Subtraction of trace C from AVG. These results indicate that the spiral center was fully confined within the area of the central detector and suggest that the amplitude reduction on trace C was caused by superimposition of multiple phases surrounding the center detector.
Phase analysis. The phase map of the spiral (see Fig. 2C) was made using programs written in the MATLAB (Mathworks, Natick, MA) according to methods described by Prechtl et al. (1997). Briefly, raw data (filtered 2-50 Hz) recorded by each photodetector (see Fig. 2C, Raw data) was further filtered by a multitapered projection filter at an optimal frequency (see Fig. 2C, Filtered). Phase was then assigned to the filtered signal (see Fig. 2C, Phase). The phase value at each location at a given time was assigned to a color according to a linear color scale, and the map was composed of colors at all locations.
Computational methods. In our model, we reduce the size of “neurons” to points in a continuum in which the cells have excitation u and recovery a, but, as in our experiments, no inhibition:
 |
 |
where w represents the connectivity between neurons as a function of position (x, y). We have taken w to be a product of the following form:
 |
where  is a symmetric decreasing Gaussian-type function, and g(q,p) represents a mild anisotropy. In polar coordinates, (r,φ), g(q,p) has the simple form g = 0.5(1 + exp(0.02 rsin(0.5φ))). The firing rate is f(u-θ), where θ denotes threshold. In our simulations, f is represented by either a sigmoid or Heaviside function (equal to 0 for u < θ and equal to 1 for u > θ). The a represents a recovery or adaptation variable whose rate of increase is proportional to βu, and τ is the time constant for change in a relative to change in u. For efficiency, we used a Fourier transform method (Laing and Troy, 2003) to transform the system into an equivalent system of partial differential equations. These were solved using a finite difference scheme with Neumann (free) boundary conditions. Spirals and ring waves were initiated with both homogenous and mildly inhomogeneous coupling.
Results
Oscillation and optical signals
Oscillations of 4-15 Hz developed in neocortical tissue when perfused with 100 μm carbachol and 10 μm bicuculline (Lukatch and MacIver, 1997). The oscillations were organized as epochs, each epoch containing 10-50 cycles. The epochs occurred spontaneously at intervals from 1 to 10 min and could also be triggered by infrequent electrical stimulation (>3 min intervals).
Voltage-sensitive dye signals from these oscillations have waveforms similar to the local field potential from the same location (Fig. 1, right) (Bao and Wu, 2003). The signal-to-noise ratio of the dye signal was high (5-10) (Fig. 1), and no signal averaging was required for mapping the spatiotemporal patterns. The voltage-sensitive dye signal reflects the fluctuation of transmembrane potential summed over a population of neurons (Ross et al., 1977; Jin et al., 2002). We used 124 (12 × 12 array) or 464 (25 × 25 array) optical detectors to image a field of 3.2 or 4 mm diameter. In each slice, we recorded 300-2000 oscillation cycles during 10-30 spontaneous or evoked epochs in a fixed field of view.
Wave patterns during oscillation
Oscillations in coronal slices manifest as unidirectional propagating waves (Golomb and Amitai, 1997; Wu et al., 1999; Bao and Wu, 2003). In tangential slices (Fig. 1, left) (Fleidervish et al., 1998), such oscillations develop into two-dimensional waves. Four wave patterns were observed: spiral, plane, ring, and irregular (Fig. 2A) (movies 1-4, available at www.jneurosci.org as supplemental material). Spiral waves appeared as a wave front rotating around a center (Fig. 2A, top row). Each cycle of the rotation was associated with one cycle of the oscillation (movie 1, available at www.jneurosci.org as supplemental material). Plane waves had straight traveling paths across the tissue, and each wave was associated with one cycle of oscillation (Fig. 2A, middle row) (movie 2, available at www.jneurosci.org as supplemental material). The plane waves appeared to evolve from ring waves as the wavefront curvature decreased when propagating outward from the center of the ring (movie 4, available at www.jneurosci.org as supplemental material). Irregular waves had multiple simultaneous wavefronts with unstable directions and velocities (Fig. 2A, bottom row) (movie 3, available at www.jneurosci.org as supplemental material). These four patterns alternately occurred within an oscillation epoch. Irregular waves usually occurred at the beginning and the end of the oscillation epochs; the plane, ring, or spiral waves typically occurred in the middle of the epochs (Fig. 2B) and were relatively stable, i.e., similar wave patterns repeated with each cycle of the oscillation. Spiral waves appeared to arise out of the interactions of waves (movie 4, available at www.jneurosci.org as supplemental material).
Spiral waves were observed in 48% of trials (116 of 242 trials from 15 slices of 12 animals). Of these 116 observations of spirals, 66 had at least four rotations (57%) and 10 had >10 rotations (9%). Both clockwise and counterclockwise rotations were seen during different oscillation epochs from the same slice. However, each emergent spiral always rotated in the same direction.
Phase singularity
To distinguish the spirals from other types of rotating waves, we analyzed the spatial phase distribution of the spirals (Fig. 2C). During the entire period of the spiral, the phase distribution within the field of view was mapped between -π and π (Fig. 2C). The highest spatial phase gradient was observed at the pivot of the spiral (Fig. 2C, white dots). The presence within such a phase gradient of a phase singularity would be the hallmark of a true spiral wave (Ermentrout and Kleinfeld, 2001; Winfree, 2001; Jalife, 2003).
We hypothesized that a phase singularity in the slice would be observed as a small region containing oscillating neurons with nearly all phases represented between -π and π. Such phase mixing would result in amplitude reduction in the optical signal. In the experiment in Figure 3, we used higher spatial resolution to search for the singularity. Using a 25 × 25 hexagonal array with 464 elements, each detector covered a circular area 128 μm in diameter (total field of view, 3.2 mm in diameter). All of the detectors showed high-amplitude oscillations before the formation of spirals (Fig. 3A, traces a-e, before the first broken vertical line). During spiral waves, the phase singularity drifted slowly across the tissue (∼1 mm/10 turns). The four detectors, a-d, alternately recorded reduced amplitude as the spiral center approached each detector in turn. Such amplitude reduction was localized at the spiral center, and this reduced amplitude propagated with drift of the spiral center (Fig. 3A, traces a-d). In locations distant from the spiral center (Fig. 3A, location e), the amplitude remained high during all rotations of the spiral. In plane or ring waves, no localized region of oscillatory amplitude reduction was seen.
To further confirm that the amplitude reduction was caused by superposition of anti-phased oscillations, we examined the signals surrounding a spiral center. Figure 3B shows the signals from a group of detectors when a spiral center drifted over the center detector. As the spiral center hovered briefly (∼200 msec, two rotations) (Fig. 3B, p) over the center detector, the amplitude was reduced (Fig. 3B, trace C). Simultaneously, the six surrounding detectors (1-6) did not show amplitude reduction, but the oscillation phases exactly opposed each other symmetrically across the center (Fig. 3B, traces 2, 5). These results indicate that the area of amplitude reduction was less than or equal to the size of our optical detector field of view (128 μm diameter). When we added the signals from the six surrounding detectors, the averaged waveform showed a similar amplitude reduction to the center detector (Fig. 3B, AVG). This combined signal was nearly identical to the central signal, as demonstrated by the small residual when the two signals were subtracted (Fig. 3B, AVG-C). These findings strongly support that the amplitude reduction was not caused by inactivity but rather by the superimposition of multiple widely distributed phases surrounding the singularity and that the spiral center was fully confined within the area of the central detector.
In all of the 63 cases of spiral waves examined by the 25 × 25 array, we found that localized amplitude reduction always occurred at the center of the spiral. Such phase singularities were not anchored to a fixed location within the tissue but were observed to drift while rotating.
Spirals in model
We modeled the spiral waves in cortical slices with a homogeneous and isotropic two-dimensional excitable medium. The most widely used models for such medium are based on the Wilson-Cowan equations (Wilson and Cowan, 1972, 1973). Later, modifications by Pinto and Ermentrout (2001) described one-dimensional wave propagation in excitatory disinhibited neural networks. We extended this approach into two dimensions.
We seek the simplest model possible, reducing the neurons to points in a continuum that has excitation and recovery but, as in our experiments, no inhibition. Such a model represents the qualities of a disinhibited network dominated by fast excitation (perfused by carbachol and bicuculline) and with an intact recovery adaptation that combines the refractory effects of spike inactivation and voltage- and calcium-activated potassium currents. Point stimulation of this model can successfully reproduce ring and plane waves propagating away from the point of stimulation (Fig. 4A, left and center).
Figure 4.

Model waves. A, Examples of wave patterns from the computational model, including ring waves from central stimulation and plane and spiral waves initiated from stimulation at the edge of the excitable sheet. B, Computational output u, amplitude from individual detectors (a-d in A) with differing spatial and temporal relationships to spiral center. Amplitude reduction occurred in detectors a-d at different times, indicating drift of the spiral center. t, Time (computational steps).
The spirals in the model were initiated by breaking a wavefront with an inhibitory stimulus applied where the wave meets the boundary of the medium, creating a free end of sufficiently high curvature to initiate spiral rotation. Such spiral waves emerged macroscopically as a property of the network in the absence of pacemaker or oscillatory microscopic dynamics and were sustained as a prolonged and periodic activity in the network (Fig. 4A, right) (movie 5, available at www.jneurosci.org as supplemental material). The model also showed irregular waves with multiple wave fronts and annihilation after collisions. These behaviors were consistent with the waves observed in the cortical slices. When virtual detectors were placed at different locations in the field of the rotating spiral waves (Fig. 4 A, right, a-d), amplitude reductions were observed near the spiral center but not at other locations, consistent with the observations in slices (Fig. 3).
Discussion
Spiral in neocortex
Our results support the existence of true spiral waves of cortical neuronal activities in four respects. First, a phase singularity (Figs. 2, 3) was observed in spiral waves but not in other wave patterns. Second, the oscillation amplitude was reduced at the spiral center (Fig. 3A), and the reduction only occurred when a spiral was formed. Third, the center of the spiral was smaller than the field of view of a single photodetector at our highest spatial resolution (Fig. 3B). Last, spirals were not an artifact of the boundary constraints from the edge of the slices because nonrotating waves (plane, ring, and irregular) were observed to dynamically alternate with rotating spiral waves.
Phase singularity
It would be interesting and challenging to understand the cellular organization within the phase singularity. The observed spiral center was small, ∼100 μm in diameter (Fig. 3B). We speculate that, at the center of the spiral, intracellular measurement would show high-amplitude oscillations but that neighboring neurons would have different phases. Future experiments with simultaneous intracellular measurements from neurons near the phase singularity would be required to fully characterize such dynamics.
Waves and oscillations
Neuronal population wave activity in slices cut normal (perpendicular) to the surface of the cortex produce unidirectional traveling waves as if the cortical circuits were functionally one-dimensional (Chagnac-Amitai and Connors, 1989; Wadman and Gutnick, 1993; Golomb and Amitai, 1997; Tsau et al., 1998; Wu et al., 1999, 2001; Bao and Wu, 2003). Population oscillatory wave activity in slices cut tangentially to the surface of the cortex (Fleidervish et al., 1998) can generate activities that suggest that the cortical circuits are functionally two-dimensional. Oscillation patterns in two-dimensional networks can be complex, and at least four types were described in this report. These patterns occurred spontaneously and alternatively in the same tissue, suggesting that the patterns are organized dynamically rather than associated with particular anatomical structures within the network.
Golomb and Amitai (1997) have proposed that the speed of the wave front and implicitly the direction of the wave front were related to the spread of horizontal connections. In our results, emerging dynamics of the activity in the system also play a significant role in the propagating velocity, direction, and the curvature of the wave front, because, within a given set of anatomical connections, different wave patterns occur (Fig. 2) (movies 1-4, available at www.jneurosci.org as supplemental material). Interestingly, all of the patterns were associated with the oscillation in the same manner: one-cycle- one-wave for nonrotating waves and one-cycle- one-rotation for spirals. This is consistent with previous characterizations of one-dimensional waves in coronal slices (Wu et al., 1999; Bao and Wu, 2003).
Although oscillations are commonly observed in sensory (Gray and Singer, 1989; Franowicz and Barth, 1995) and associational (Pesaran et al., 2002) cortices, little is known about the spatial organization that accompanies such oscillatory activity. It has been shown in visual cortex that sensory-evoked oscillations can demonstrate intercolumnar coherency (Eckhorn et al., 1988; Gray et al., 1989). We speculate that rotation waves of spirals may provide a spatial framework to organize cortical oscillations. Dynamic stability of spirals might extend the duration of evoked activity and interact with incoming input streams, and, in pathological conditions, might contribute to seizure generation. Spiral waves might serve as emergent population pacemakers to generate periodic activity in a nonoscillatory network without individual cellular pacemakers. Spirals might be used for coordinating oscillation phases over a population of neurons, serving functions such as binding sensory information or dynamical temporal storage in working memory.
Footnotes
This work was supported by National Institutes of Health Grants R01NS036447 (J.-Y.W.) and K02MH01493 (S.J.S.). We thank V. Jirsa for helpful discussions and for mutual time in residence at a Pattern Formation Workshop at the Institute for Theoretical Physics, University of California at Santa Barbara (S.J.S., W.C.T., and J.-Y.W.).
Correspondence should be addressed to Jian-Young Wu, 247 Basic Science Building, 3900 Reservoir Road Northwest, Washington, DC 20057. E-mail: wuj@georgetown.edu.
Copyright © 2004 Society for Neuroscience 0270-6474/04/249897-06$15.00/0
References
- Bao W, Wu JY (2003) Propagating wave and irregular dynamics: spatiotemporal patterns of cholinergic theta oscillations in neocortex in vitro. J Neurophysiol 90: 333-341. [DOI] [PMC free article] [PubMed] [Google Scholar]
- Beurle RL (1956) Properties of a mass of cells capable of regenerating pulses. Philos Trans R Soc Lond B Biol Sci 240: 55-94. [Google Scholar]
- Chagnac-Amitai Y, Connors BW (1989) Horizontal spread of synchronized activity in neocortex and its control by GABA-mediated inhibition. J Neurophysiol 61: 747-758. [DOI] [PubMed] [Google Scholar]
- Davidenko JM, Pertsov AV, Salomonsz R, Baxter W, Jalife J (1992) Stationary and drifting spiral waves of excitation in isolated cardiac muscle. Nature 355: 349-351. [DOI] [PubMed] [Google Scholar]
- Eckhorn R, Bauer R, Jordan W, Brosch M, Kruse W, Munk M, Reitboeck HJ (1988) Coherent oscillations: a mechanism of feature linking in the visual cortex? Multiple electrode and correlation analyses in the cat. Biol Cybern 60: 121-130. [DOI] [PubMed] [Google Scholar]
- Ermentrout GB, Kleinfeld D (2001) Traveling electrical waves in cortex: insights from phase dynamics and speculation on a computational role. Neuron 29: 33-44. [DOI] [PubMed] [Google Scholar]
- Fleidervish IA, Binshtok AM, Gutnick MJ (1998) Functionally distinct NMDA receptors mediate horizontal connectivity within layer 4 of mouse barrel cortex. Neuron 21: 1055-1065. [DOI] [PubMed] [Google Scholar]
- Franowicz MN, Barth DS (1995) Comparison of evoked potentials and high-frequency (gamma-band) oscillating potentials in rat auditory cortex. J Neurophysiol 74: 96-112. [DOI] [PubMed] [Google Scholar]
- Friedrich R, Fuchs A, Haken H (1991) Spatio-temporal EEG patterns. In: Synergetics of rhythms (Haken H, Köpchen HP, eds), pp 119-128. Berlin: Springer Verlag.
- Fuchs A, Friedrich R, Haken H, Lehmann D (1987) Spatio-temporal analysis of multi-channel alpha EEG map series. In: Computational systems—natural and artificial (Haken H, ed), pp 74-83. Berlin: Springer.
- Golomb D, Amitai Y (1997) Propagating neuronal discharges in neurocortical slices: computational and experimental study. J Neurophysiol 78: 1199-1211. [DOI] [PubMed] [Google Scholar]
- Gorelova NA, Bures J (1983) Spiral waves of spreading depression in the isolated chicken retina. J Neurobiol 14: 353-363. [DOI] [PubMed] [Google Scholar]
- Gray CM, Singer W (1989) Stimulus-specific neuronal oscillations in orientation columns of cat visual cortex. Proc Natl Acad Sci USA 86: 1698-1702. [DOI] [PMC free article] [PubMed] [Google Scholar]
- Gray CM, König P, Engel AK, Singer W (1989) Oscillatory responses in cat visual cortex exhibit inter-columnar synchronization which reflects global stimulus properties. Nature 338: 334-337. [DOI] [PubMed] [Google Scholar]
- Jalife J (2003) Rotors and spiral waves in atrial fibrillation. J Cardiovasc Electrophysiol 14: 776-780. [DOI] [PubMed] [Google Scholar]
- Jin W, Zhang RJ, Wu JY (2002) Voltage-sensitive dye imaging of population neuronal activity in cortical tissue. J Neurosci Methods 115: 13-27. [DOI] [PubMed] [Google Scholar]
- Laing CR, Troy WC (2003) PDE methods for nonlocal problems. SIAM J Dyn Sys 2: 487-516. [Google Scholar]
- Lechleiter J, Girard S, Peralta E, Clapham D (1991) Spiral calcium wave propagation and annihilation in Xenopus laevis oocytes. Science 252: 123-126. [DOI] [PubMed] [Google Scholar]
- Lukatch HS, MacIver MB (1997) Physiology, pharmacology, and topography of cholinergic neocortical oscillations in vitro J Neurophysiol 77: 2427-2445. [DOI] [PubMed] [Google Scholar]
- Milton JG, Chu PH, Cowan JD (1993) Spiral waves in integrate-and-fire neural networks. In: Advances in neural information processing systems (Hanson SJ, Cowan JD, Giles CL, eds), pp 1001-1007. San Mateo: Morgan Kaufmann.
- Murray JD (2003) Mathematical biology II: spatial models and biomedical applications, pp 1-67. New York: Springer.
- Pesaran B, Pezaris JS, Sajani M, Mitra PP, Andersen RA (2002) Temporal structure in neuronal activity during working memory in macaque parietal cortex. Nat Neurosci 5: 808-811. [DOI] [PubMed] [Google Scholar]
- Petsche H, Prohaska O, Rappelsberger P, Vollmer R, Kaiser A (1974) Cortical seizure patterns in multidimensional view: the information content of equipotential maps. Epilepsia 15: 439-463. [DOI] [PubMed] [Google Scholar]
- Pinto DJ, Ermentrout GB (2001) Spatially structured activity in synapticallycoupled neuronal networks. I. Traveling fronts and pulses. SIAM J Appl Math 62: 206-225. [Google Scholar]
- Prechtl JC, Cohen LB, Pesaran B, Mitra PP, Kleinfeld D (1997) Visual stimuli induce waves of electrical activity in turtle cortex. Proc Natl Acad Sci USA 94: 7621-7626. [DOI] [PMC free article] [PubMed] [Google Scholar]
- Ross WN, Salzberg BM, Cohen LB, Grinvald A, Davila HV, Waggoner AS, Wang CH (1977) Changes in absorption, fluorescence, dichroism, and birefringence in stained giant axons: optical measurement of membrane potential. J Membr Biol 33: 141-183. [DOI] [PubMed] [Google Scholar]
- Tsau Y, Guan L, Wu JY (1998) Initiation of spontaneous epileptiform activity in the neocortical slice. J Neurophysiol 80: 978-982. [DOI] [PubMed] [Google Scholar]
- Verkhratsky A, Orkand RK, Kettenmann H (1998) Glial calcium: homeostasis and signaling function. Physiol Rev 78: 99-141. [DOI] [PubMed] [Google Scholar]
- Wadman WJ, Gutnick MJ (1993) Non-uniform propagation of epileptiform discharge in brain slices of rat neocortex. Neuroscience 52: 255-262. [DOI] [PubMed] [Google Scholar]
- Wilson HR, Cowan JD (1972) Excitatory and inhibitory interactions in localized populations of model neurons. Biophys J 12: 1-24. [DOI] [PMC free article] [PubMed] [Google Scholar]
- Wilson HR, Cowan JD (1973) A mathematical theory of the functional dynamics of cortical and thalamic nervous tissue. Kybernetik 13: 55-80. [DOI] [PubMed] [Google Scholar]
- Winfree AT (2001) The geometry of biological time. New York: Springer.
- Wu JY, Guan L, Tsau Y (1999) Propagating activation during oscillations and evoked responses in neocortical slices. J Neurosci 19: 5005-5015. [DOI] [PMC free article] [PubMed] [Google Scholar]
- Wu JY, Guan L, Bai L, Yang Q (2001) Spatiotemporal properties of an evoked population activity in rat sensory cortical slices. J Neurophysiol 86: 2461-2474. [DOI] [PubMed] [Google Scholar]