

SUMMARY
Objective
Drug toxicity is a hurdle to drug development and to clinical translation of basic research. Antiepileptic drugs such as carbamazepine (CBZ) and selective serotonin reuptake inhibitors such as sertraline (SRT) are commonly co-prescribed to patients with epilepsy and comorbid depression. Because SRT may interfere with cytochrome P450 (CYP) enzyme activity and CYPs have been implicated in the conversion of CBZ to reactive cytotoxic metabolites, we investigated in vitro models to determine whether SRT affects the neurotoxic potential of CBZ and the mechanisms involved.
Methods
Human fetal brain-derived dopaminergic neurons, human brain microvascular endothelial cells (HBMECs), and embryonic kidney (HEK) cells were used to evaluate cytotoxicity of CBZ and SRT individually and in combination. Nitrite and glutathione (GSH) levels were measured with drug exposure. To validate the role of CYP3A4 in causing neurotoxicity, drug metabolism was compared to cell death in HEK CYP3A4 overex-pressed and cells pretreated with the CYP3A4 inhibitor ketoconazole.
Results
In all cellular systems tested, exposure to CBZ (127 μM) or SRT (5 μM) alone caused negligible cytotoxicity. By contrast CBZ, tested at a much lower concentration (17 μM) in combination with SRT (5 μM), produced prominent cytotoxicity within 15 min exposure. In neurons and HBMECs, cytotoxicity was associated with increased nitrite levels, suggesting involvement of free radicals as a pathogenetic mechanism. Pretreatment of HBMECs with reduced GSH or with the GSH precursor N-acetyl-L-cysteine prevented cytotoxic response. In HEK cells, the cytotoxic response to the CBZ + SRT combination correlated with the rate of CBZ biotransformation and production of 2-hydroxy CBZ, further suggesting a causative role of reactive metabolites. In the same system, cytotoxicity was potentiated by overexpression of CYP3A4, and prevented by CYP3A4 inhibitor.
Significance
These results demonstrate an unexpected neurotoxic interaction between CBZ and SRT, apparently related to increased CYP3A4-mediated production of reactive CBZ metabolites. The potential clinical implications of these findings are discussed.
Keywords: CYP3A4, Cytotoxicity, Drug interaction, Human, Ketoconazole, Neurotoxicity
Depression is the most frequent comorbid psychiatric disorder in epilepsy. Its lifetime prevalence has been estimated to be 6–30% in population-based studies and up to 50% among patients followed in tertiary centers.1 Studies also indicate that a history of depression is associated with a four- to sixfold greater risk of developing epilepsy.2 Patients with epilepsy and comorbid depression are often managed by using combinations of antiepileptic drugs (AEDs) with an antidepressant.3,4 In a study that enrolled 933 consecutive adults with refractory epilepsy, antidepressants were, together with antihypertensive agents, the drug class most frequently co-prescribed with AEDs, and were taken by about 7% of the study population.5 Selective serotonin reup-take inhibitors (SSRIs) are usually the preferred antidepressants in these patients, because of their low potential for reducing seizure threshold.3 When different pharmacologic agents are co-prescribed, drug–drug interactions may occur, some of which can have serious adverse clinical consequences.6
Although interaction mechanisms differ depending on the drug combination being used, most clinically important interactions involve inhibition or induction of cytochrome P450 (CYP) drug metabolizing enzymes.7,8 Although drug metabolism is primarily a detoxifying process, biotransformation of many drugs can result in the generation of toxic intermediates, including free radicals,9 which can cause cell death.9–13 Reactive metabolites and free radicals are a common product of phase I CYP-mediated oxidation reactions, resulting in oxidation of thiols, covalent binding of macromolecules, and consequent inhibition of normal cell function and damage to key cellular components. Functionally active phase I (CYPs) and phase II (e.g., glucuronyl transferases, glutathione S-transferases) enzymes and transporter systems, including P-glycoprotein (P-gp), are present in blood–brain barrier (BBB) endothelial cells and in neurons. The same enzymes are also expressed, albeit more sparsely, in astrocytes.14–18 Of interest, BBB enzymes have been found to transform CBZ to a proconvulsant neurotoxin, quinolinic acid. This finding was reported in brain specimens from patients with drug-resistant epilepsy, who were previously treated with CBZ, but not in brain specimens from epilepsy patients treated with lamotrigine (LTG) or pregabalin.19
The role of reactive oxidized metabolites of CBZ in the pathogenesis of CBZ-induced cell damage and hypersensitivity reactions has been documented in several studies.10–12,20 Whether the cytotoxicity of CBZ is affected by concomitant exposure to antidepressants such as SSRIs is unknown. In the present study, we used human fetal brain-derived dopaminergic neurons, human brain microvascular endothelial cells (HBMECs), and human embryonic kidney (HEK) cells to assess in vitro potential cytotoxic interactions between CBZ and sertraline (SRT), an SSRI that has been reported to cause variable inhibition of various CYP isoforms.21,22 Sertraline was selected for this study because in a recent meta-analysis it was found to be possibly the best choice when starting treatment for moderate to severe major depression in adults, due to its most favorable balance between benefits, acceptability, and acquisition cost.23 Sertraline has also been suggested as an SSRI of first choice for people with epilepsy and comordid depression.24
Methods
Chemicals and reagents
CBZ, SRT, N-acetyl-L-cysteine (NAC), and ketoconazole (KTC) of 99% purity were purchased from Sigma-Aldrich (St. Louis, MO, U.S.A.). Cell culture reagent components including Dulbecco’s Modified Eagle’s Medium (DMEM) and penicillin/streptomycin solutions were purchased from Gibco (Grand Island, NY, U.S.A.). Six-well culture dishes and chamber slides were purchased from Costar Corporation (Cambridge, MA, U.S.A.). LIVE/DEAD Viability/ Cytotoxicity kit was purchased from Molecular Probes (Invitrogen, Eugene, OR, U.S.A.). ToxiLight bioassay kit was from Lonza (Walkersville, MD, U.S.A.). The glutathione assay kit (catalog number: KA1649) was from Abnova (Walnut, CA, U.S.A.). Methanol and acetonitrile of high performance liquid chromatography (HPLC) grade were obtained from Sigma-Aldrich.
Cell cultures and drug exposure
Human dopaminergic neurons derived from fetal brain were purchased from Cloneexpress (catalog number: DAN 020; Gaithersburg, MD, U.S.A.) with company recommended culture media. HEK 293 cells were obtained from American Type Culture Collection (ATCC; catalog number: CRL-1573; Manassas, VA, U.S.A.) and HBMECs from Cell Systems (catalog number: ACBRI 376; Kirkland, WA, U.S.A.). Respective media specifications were followed. For drug experiments, neurons, HEK cells, and HBMECs were grown in a confluent monolayer. Neurons, HBMECs, and HEK cells (5 104 cells/60 × 15 mm petri dish) were exposed to CBZ (127 μM) and SRT (5 μM) individually and together (CBZ 17 μM + SRT 5 μM) for 10–60 min. Other concentrations tested for both compounds (5, 10, 50, 100, and 500 μM and 1 mM). For drug experiments, stock solutions of CBZ (330 mM) and SRT (30 mM) were prepared in dimethyl sulfoxide (DMSO). Initial working concentrations of CBZ (127 μM) and SRT (5 μM) were obtained by diluting the stocks in culture media. Other tested concentrations of CBZ and SRT (5, 10, 50, 100, and 500 μM and 1 mM) and drug combinations of CBZ + SRT were prepared from respective stocks. Concentrations of stock solutions were kept deliberately high to minimize the amount of DMSO in the final working solutions.
Immunocytochemistry
At approximately 75% confluency in chamber slides, neuronal cells were fixed using 3% formalin for 30 min. Cells were then washed with phosphate-buffered saline (PBS), and blocked and incubated overnight at 4°C using a mouse polyclonal anti-human microtubule-associated protein 2 (MAP-2) (1:200; Abcam Inc, Cambridge, MA, U.S.A.). The secondary antibody Alexa 594, donkey anti-rabbit IgG (1:100 catalog number 711-585-152; Jackson Immunoresearch Inc., West Grove, PA, U.S.A.) was used. Cells were mounted using Vectashield mounting medium with diamidino-2-phenylindole (DAPI) staining (Vector Laboratories, Burlingame, CA, U.S.A.).
LIVE/DEAD assay
The proportion of live and dead cells after exposure to the test drugs, alone and in combination, was investigated by using the LIVE/DEAD viability/cytotoxicity kit. The contents of the kit includes calcein acetoxymethyl ester (AM) for live (green) cells and ethidium homodimer-1 for dead (red) cells. Cell viability was analyzed using fluorescent microscopy and images were quantified with ImageJ software (Image J software, http://imagej.nih.gov/ij/ described in the Data S1).
Changes in cell morphology after drug exposure
The morphology of cells was assessed using phase-contrast microscopy. Special attention was given to signs of cellular damage, including disruption of intercellular junctional complexes, swollen or prominent nuclei, a shrunken cytosol, and rupture of nuclear and plasma membranes. All assessments were done by an evaluator who was blinded to the type of exposure. The extent of cellular damage in drug-exposed samples was compared with that of control samples.
Adenylate kinase, nitrite and glutathione determination
Quantitative assessment of cellular damage and oxidative stress was determined in neurons, HBMECs, and HEK cells.
Adenylate kinase/ToxiLight cytotoxicity assay
This highly sensitive cytotoxicity assay measures adenylate kinase (AK) (catalog number: LT07-217; Lonza) released from damaged mammalian cells. Bioluminescent AK is present in all cells. Loss of cell integrity through damaged membrane results in leakage of AK into the surrounding medium. Measurement of AK provides an accurate determination of the degree of cytolysis (cytotoxicity). AK measurements are plotted as relative luminescent units, so that equal number of cells exposed to different drug exposures could be compared with the control and the zero time point.
Nitrite levels
Nitric oxide (NO) production was determined indirectly by measuring the concentration of nitrite, an NO product, in supernatants from triplicate cultures (5.0 × 10⁵ cells in 0.2 ml of the medium contained within an individual well of a 96-well plate, or 2.5–5.0 × 10⁶ cells in 2.0 ml of the medium contained within a 60-mm petri dish). Measurements were done by a spectrophotometric method based on the Greiss reaction (Promega, Madison, WI, U.S.A.), as previously described.25
Reduced glutathione levels
Oxidative stress was quantified by measuring the levels of glutathione (GSH) in the cells. In this assay, 5,5′-Dithio-bis-(2-nitrobenzoic acid)/DTNB reacts with GSH to form a yellow product. The optical density, measured at 412 nm, is directly proportional to the GSH concentration in the sample.
Pretreatment with N-acetyl-L-cysteine (NAC)
To assess the potential cytoprotective effects of GSH, HBMECs were pretreated with the GSH precursor NAC prior to CBZ + SRT exposure. Cultures (3 × 10⁴ cells/ per chamber) were preexposed to 10 mM NAC for 2 h, followed by CBZ + SRT (17 μM + 5 μM). Dead cells were identified by the red fluorescent labeled ethidium dye. The chamber slides were fixed with 3% formalin and mounted with DAPI (blue). Cells exposed to NAC pretreatment and untreated (control) cells were incubated with CBZ + SRT for 10, 15, 30, and 60 min (experimental design in Fig. S2A) in triplicate. Fluorescent images from different fields were captured and the total (blue/DAPI) and dead cells (red, ethidium homodimer) were quantified by ImageJ software.
CYP3A4 overexpression by transfection and CYP3A4 inhibition with ketoconazole (experimental design in Fig. S2B)
For CYP3A4 transfection into HEK cells, human CYP3A4 cDNA was subcloned into the pcDNA 3.1 vector (catalog number 11668-019; Gibco, Invitrogen, Carlsbad, CA, U.S.A.). HEK cells were transiently transfected for 24 h to overexpress human CYP3A4. CYP3A4 overexpression in transfected cells (HEK-CYP+) was confirmed by Western analysis. HEK and HEK-CYP+ cells were incubated with CBZ + SRT for 15, 30, and 45 min. Images were taken by phase microscope and the levels of AK, as a marker of cytotoxicity, were measured in the supernatant.
To test the effects of CYP3A4 inhibition, nontransfected HEK cells and transfected HEK-CYP+ cells were preincubated with 10 μM ketoconazole for 2 h. Subsequent incubation with CBZ + SRT for 15, 30, and 45 min was carried out to determine the role of CYP3A4 in the cytotoxic response.
Protein isolation and Western blot analysis
Total proteins were extracted from HEK and HEK-CYP3A4+ transfected cells as described previously.16,17 Proteins were separated by sodium dodecyl sulfate poly-acrylamide gel electrophoresis (SDS-PAGE) and transferred onto polyvinylidene fluoride (PVDF) membranes (Millipore Corporation, Billerica, MA, U.S.A.). The membranes were probed overnight at 4°C with the primary antibody rabbit polyclonal CYP3A4, 1:2,000 (Abcam Inc) and appropriate secondary antibody. PVDF membranes were incubated for 30 min at 50°C in stripping buffer and later normalized with β-actin protein levels (as loading control). Protein expression was quantified by ImageJ software.
HPLC-UV analysis
In initial experiments, cells were incubated in the presence of 127 μM CBZ and 5 μM SRT. The selected concentration of CBZ is slightly greater than twice the upper limit of the reference plasma concentration range in CBZ-treated patients.26 For SRT, a 5 μM concentration is 10–20 times higher than the highest levels found in the plasma of patients treated for major depression, 27–29 but its selection was justified by evidence from animal studies that brain SRT concentrations are about 17–40 times higher than plasma concentrations.30–32 Subsequent incubations were performed using a much lower concentration of CBZ (17 μM), corresponding to the lower limit of the reference plasma concentration range,26 in combination with SRT (5 μM). Drug concentrations after 0, 15, 30, and 45 min were analyzed by reverse-phase HPLC with UV detection (Agilent 1100 Series, Santa Clara, CA, U.S.A.).16,19 Concentrations of drugs and their metabolites in CYP3A4-transfected HEK-CYP+ cells and ketoconazole pretreated HEK cells were evaluated. The drugs and their metabolites were separated by using a Zorbax XDB C8 RP column (4.6 × 150 mm, 4 μm; Agilent Technologies).
Preparation of standard solutions
Stock solutions containing 1 mg/ml of SRT and CBZ each were prepared in methanol. Calibration standards (0.5, 5, 10, 20, 40, and 60 μg/ml) were prepared by further dilution of stock solutions with drug-free media. Drug metabolites, carbamazepine-10,11-epoxide (CBZ-E), 2-hydroxy-carbamazepine (hydroxy-CBZ), and desm-ethyl-sertraline (desmethyl-SRT) were simultaneously analyzed.
Chromatographic conditions
The mobile phase consisted of acetonitrile: phosphate buffer (12.3 mM) containing 0.1% triethylamine (35:65, v/v/v) at pH adjusted to 3. Chromatography was performed at 50°C (flow rate of 1 ml/min at 220 nm, described in detail in the Data S1). CBZ and SRT are stable for at least 4 weeks when stored at 20°C. The method was validated by determining the limit of quantification (LOQ), precision and accuracy (Table S1). Quantification, sensitivity, precision, and accuracy of the method are described in the Data S1.
Statistical analysis
All data are expressed as means ± standard error (SE). The Student’s t-test was used to compare mean values between two groups, and analysis of variance (ANOVA) was used for multiple comparisons. A p-value < 0.05 was considered statistically significant. For the statistical validation of data, independent experiments (n = 3) were performed in triplicate. X–Y linear regression (Pearson’s r) was also performed as required. Origin 9.0 (Origin Lab, Northampton, MA, U.S.A.) was used for all statistical analyses.
Results
In the initial experiments performed in cultured human fetal brain-derived dopaminergic neurons, neither CBZ (127 μM) nor SRT (5 μM), applied separately, produced detectable cytotoxicity (Fig. 1A). However, when neurons were exposed to a much lower concentration of CBZ (17 μM) in combination with SRT (5 μM), cell integrity was rapidly disrupted, followed by pronounced neurodegeneration. Parallel experiments with media containing equivalent concentrations of DMSO alone showed no alteration in cell morphology. Because these results were based on light microscopy, which does not allow a precise quantification of cytotoxicity, the same experiments were repeated using the LIVE-DEAD assay, which differentiates live healthy cells from dead cells (see Methods) (Fig. 1B). The LIVE-DEAD assay confirmed that at 15 min, the majority of cells were alive (green) after exposure to CBZ (127 μM) or SRT (5 μM) alone, whereas the combination of CBZ (17 μM) + SRT (5 μM) led to marked cytotoxicity. In subsequent experiments, analysis of the extracellular fluids from these cultures showed that combined exposure to CBZ + SRT led to elevated levels of nitrite, a product and a source of nitric oxide (Fig. 1C).
Figure 1.

Results obtained by applying the LIVE/DEAD Assay on human fetal brain-derived dopaminergic neurons exposed to CBZ and SRT. (A) Cells were fixed in vitro and immunostained with anti-MAP-2 (red), with the nuclei stained with DAPI (blue) to characterize the neuronal culture. Morphologic cellular changes were assessed after exposure to CBZ alone (127 μM), SRT alone (5 μM) and CBZ (17 μM) + SRT (5 μM) combined. Images were obtained by phase microscopy. (B) The LIVE/DEAD assay, performed as described under Methods, shows live cells stained by calcein in green, dead cells stained by ethidium homodimer in red, and total cells stained by DAPI in blue. After 15-min exposure to SRT (5 μM) and CBZ (127 μM) separately, the majority of cells stained green (live) and only a few cells stained red (dead). After 15-min exposure to CBZ (17 μM) + SRT (5 μM) combined, the majority of cells were dead (red). Merged images of live and dead cells stained with DAPI are shown in the right column. Scale bar = 50 μm and analyzed from five randomly selected fields in triplicates. (C) After 15-min exposure to CBZ (17 μM) + SRT (5 μM), the extracellular fluid showed increased levels (*p < 0.05, n = 5) of nitrite, a product and source of nitric oxide.
To characterize the relationship between the cytotoxic response and the concentration of CBZ, human fetal brain-derived dopaminergic neurons were exposed to increasing CBZ concentrations, both in the absence and in the presence of a constant concentration of SRT (5 μM) (Fig. 2). In the absence of SRT, CBZ was not toxic at levels up to around 100 μM (Fig. S1) and exerted prominent toxicity only at 1 mM, whereas in the presence of SRT, maximal cytotoxicity already occurred at 17 μM. These results show that CBZ is neurotoxic at low concentrations only when co-applied with SRT, whereas no neurotoxicity occurs after exposure to SRT alone (up to 50 μM).
Figure 2.
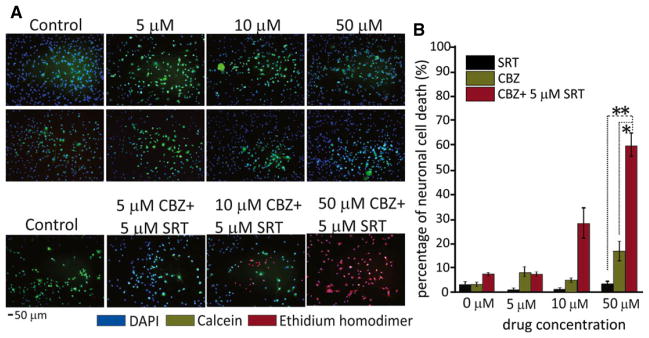
Viability of human fetal brain-derived dopaminergic neuronal cells after exposure to different concentrations of CBZ and SRT, applied separately and in combination. (A) Neuronal cells were incubated with SRT and CBZ, applied separately at 0, 5, 10, and 50 μM concentrations for 15 min (upper rows). Cell viability was measured by LIVE/DEAD assay. Both drugs given separately caused negligible cell death, with the majority of cells being live (green). By contrast, when CBZ and SRT were applied together (SRT 5 μM combined with increasing concentrations of CBZ at 5, 10, and 50 μM), concentration-dependent neurotoxicity (shown by increasing numbers of red, dead cells) was observed (bottom row). (B) Quantification of dead cells (red, ethidium homodimer staining) by ImageJ software showed that the proportion of dead cells at 15 min was 45% with 10 μM CBZ + 5 μM SRT and 60% with 50 μM CBZ + 5 μM SRT. Numbers of green and red cells were counted per five random fields at ×10 magnification in triplicates. *p < 0.05 and **p < 0.01 in 50 μM CBZ + 5 μM SRT together compared with CBZ and SRT alone, respectively. Data are means ± SE (ANOVA). Scale bar = 50 μm.
The brain is protected from circulating neurotoxins by the presence of a functional BBB. Therefore, further experiments were conducted to determine whether CBZ, alone and in combination with SRT, can also exert toxicity against brain endothelial cells, reproducing properties of the BBB. In these experiments, primary cultures of HBMECs were exposed to the same CBZ and SRT concentrations used for neurotoxicity testing in dopaminergic neurons. As shown in Figure 3, the cytotoxic response of endothelial cells to CBZ alone (127 μM) and to the combination of CBZ (17 μM) + SRT (5 μM) was similar to that found in neurons, that is, there was no significant cytotoxicity with CBZ alone and marked cytotoxicity when CBZ was combined with SRT. The degree of cytotoxicity in endothelial cells exposed to the CBZ + SRT combination was quantified by documenting an increase in AK levels in the extracellular fluid (Fig. 3B). Evidence that the cytotoxic effects was mediated by production of free radicals was provided by the observation that exposure of HBMECs to CBZ + SRT resulted in a significant decrease in GSH levels (Fig. 3D) and a significant increase in nitrite levels (Fig. 3C), similar to that found in neuronal cultures (Fig. 1C). Exposure of HBMECs to GSH, an endogenous antioxidant, inhibited the cytotoxic response (data not shown), implicating oxidative stress as a trigger for cell toxicity.
Figure 3.

Cytotoxicity in human brain microvascular endothelial cells (HBMECs) after combined exposure to CBZ and SRT is related to oxidative stress. (A) CBZ (17 μM) + SRT (5 μM) caused marked cell death within 15 min, unlike either drug applied alone (CBZ 127 μM, SRT 5 μM) (details under Methods, n = 5). Representative images are at 10× magnification. (B) Cytotoxicity after 15 min exposure to CBZ (17 μM) + SRT (5 μM) was associated with increased levels of adenylate kinase (AK) released from damaged cells, measured in relative luminescence units (RLU). (C,D) Cytotoxicity after 15-min exposure to CBZ (17 μM) + SRT (5 μM) was associated with oxidative stress, as shown by increased (*p < 0.01, n = 5) release of nitrite (C), and decreased levels (*p < 0.05) of reduced glutathione (GSH, D) in CBZ + SRT exposed cells compared with either drug applied alone (CBZ 127 μM, SRT 5 μM). Data are means ± SE (ANOVA).
If free radical formation was the main mechanism responsible for cytotoxicity, pretreating the cells with the GSH precursor NAC would be expected to prevent cellular damage. In agreement with this hypothesis, pre-incubation of HBMECs for 2 h with NAC, followed by exposure to CBZ (17 μM) + SRT (5 μM) (see experimental design in Fig. S2A) resulted in prevention of cell death as monitored for up to 60 min with the LIVE-DEAD assay (Fig. 4).
Figure 4.
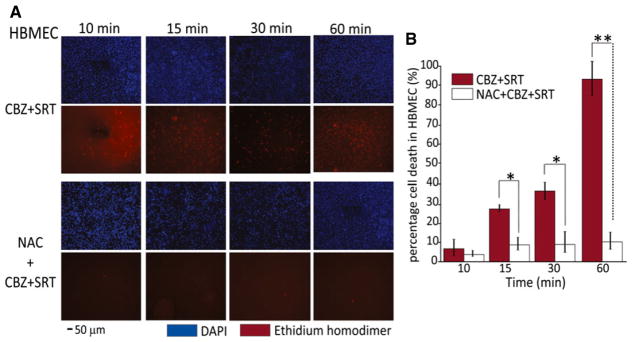
Protective role of N-acetyl-L-cysteine (NAC) against cytotoxicity induced by the CBZ + SRT combination in human brain microvascular endothelial cells (HBMECs). (A) Staining of total cells in blue (DAPI) and number of dead (red) cells increasing over time after exposure to CBZ (17 μM) + SRT (5 μM) (upper panel). Representative images in the lower panel show the dramatic prevention of cytotoxicity in cells exposed to NAC pretreatment. Scale bar = 50 μm, analyzed from five randomly selected fields in triplicates. NAC alone did not induce any change in cell number or cell morphology (data not shown). (B) Exposure to CBZ (17 μM) + SRT (5 μM) shows minimal damage after 10 min; proportion of dead cells was 28% at 15 min, 40% at 30 min, and 90% at 60 min. NAC pretreatment rescued the cells from death across all time points (*p < 0.05 in 15 and 30 min and *p < 0.01 in 60 min when CBZ + SRT versus NAC pretreated groups are compared). Data are means ± SE (ANOVA).
Primary neuronal or endothelial cell cultures are an excellent model for studying neurotoxic effects in vitro, but their use for high throughput or transfection screening is problematic. For transfection experiments, we used HEK cells, a broadly used cell line that retains many properties of immature neurons.33 Specifically, HEK cells were used to test the hypothesis that CYP3A4 is at least in part responsible for the cytotoxic effects of CBZ in the presence of SRT. For this purpose, two sets of experiments were performed to investigate the effects of (1) overexpression of CYP3A4 activity by using HEK-CYP+ cells, and (2) inhibition CYP3A4 activity with ketoconazole.13,34 Overexpression of CYP3A4 was confirmed by western blotting (Fig. 5C), whereas the effects of CYP3A4 inhibition were assessed by HPLC measurement of CBZ metabolites (Fig. 6). As shown in Figure 5A, although normal HEK cells showed maximal cytotoxicity within 15 min of exposure to CBZ (17 μM) + SRT (5 μM), cells overexpressing CYP3A4 showed greater cytotoxicity developing over a longer time span. The degree of CYP3A4 expression was also correlated with the amount of released AK, a marker of cytotoxicity (Fig. 5D). Pretreatment with the CYP3A4 inhibitor ketoconazole virtually abolished the cytotoxic response in HEK cells, and inhibited it prominently in HEK-CYP+ cells, as documented qualitatively by phase microscopy (data not shown) and quantitatively by measurement of AK activity (Fig. 5B).
Figure 5.

Overexpression and inhibition of CYP3A4 activity regulates the cytotoxic response to the CBZ + SRT combination in human embryonic kidney (HEK) cells. (A) Both HEK cells and CYP3A4 overexpressing HEK cells (HEK-CYP+) show prominent cytotoxicity, as quantified by increased adenylate kinase (AK) levels after exposure to CBZ (17 μM) + SRT (5 μM). AK levels reached a plateau after 15 min in HEK cells but increased further at subsequent times (indicating greater cytotoxicity) in HEK-CYP+ cells (n = 5 in triplicate experiments). (B) Pretreatment with the CYP3A4 inhibitor ketoconazole prevented completely the increase in AK levels (cytotoxicity) in HEK cells exposed to CBZ (17 μM) + SRT (5 μM). The protective effect of ketoconazole was less prominent in HEK-CYP+ cells. (C) Western blot showing effective transfection/CYP3A4 overexpression (normalized with β-actin) in HEK-CYP+ cells. Normalized band intensity was quantified by Image J software. The histogram shows that HEK-CYP+ intensity is significantly increased compared with non-transfected HEK cells. **p < 0.01, means ± SE, n = 8 under each condition. (D) Direct correlation between AK levels and CYP3A4 expression in HEK/HEK-CYP+ cells after exposure to CBZ (17 μM) + SRT (5 μM) provides further evidence for cytotoxicity being related to CYP3A4 expression. Individual data points are plotted and linear regression was used to analyze data (Pearson’s coefficient, r = 0.983) within data sets.
Figure 6.

Relationship between CBZ metabolism and cytotoxicity in HEK cells. (A) HPLC chromatogram illustrating the metabolic profile of CBZ in media from cell cultures exposed to CBZ alone (127 μM). Note the formation of carbamazepine-10,11-epoxide (CBZ-E) after 24 h (see standard calibrations and HPLC profiles in Fig. S3). (A1, A2) HPLC chromatograms from culture media of HEK cells and HEK cells pretreated with the CYP3A4 inhibitor ketoconazole, after 15, 30, and 45 min exposure to CBZ (17 μM) + SRT (5 μM). The metabolite 2-hydroxy-CBZ (hydroxy-CBZ), which is part of a pathway involving formation of reactive toxic metabolites, was detected after exposure to CBZ + SRT, but not after exposure to CBZ alone (A) or after exposure to CBZ + SRT in the presence of ketoconazole (A2). The limit of detection (LOD) was estimated at a signal-to-noise ratio of 3:1, which was found to be ~0.06 μg/ml. HPLC chromatograms of CBZ and its metabolites in culture media of HEK cells CBZ (17 μM) + SRT (5 μM) in the absence and in the presence of ketoconazole pretreatment are shown in Figure S3B,B1. (B, B1) Comparison between percent decline (vs. time 0) in CBZ and SRT concentrations in HEK/HEK-CYP+ cells culture medium and percent increase in number of dead cells, based on changes in adenylate cyclase (AK), after exposure to CBZ (17 μM) + SRT (5 μM). Percent death rate was estimated by assigning a value of 100% to the AK levels measured after 45 min exposure in HEK-CYP+ cells. The decline in CBZ concentration mirrors the increase in cell death (B), which does not occur in ketoconazole pretreated cells (B1). These findings suggest that cell death is related to the biotransformation of CBZ, presumably to reactive metabolites. There is a strong relationship between percent decline of CBZ concentration in the medium and the increase in the concentration of 2-hydroxy-CBZ (C1, C2) (r = 0.94, Pearson regression coefficient). No changes in CBZ and 2-hydroxy-CBZ concentrations are observed in cells pretreated with ketoconazole (n = 3 in triplicate experiments).
In previous studies, CYP3A4-mediated production of unstable reactive metabolites, including iminoquinone, has been shown to play a causative role in the cytotoxic effects of CBZ.12,13 Because the stable metabolite 2-hydroxy-CBZ is considered to reflect the activity of the pathway leading to the formation of the reactive metabolites,10–12 the metabolic profiles of CBZ were compared after HEK cell exposure to CBZ + SRT, both in the presence and in the absence of ketoconazole (Fig. 6, see Fig. S3 for details on assay methodology). CBZ-10,11-epoxide was the major metabolite peak only when cells were exposed to CBZ alone (Fig. 6A), whereas exposure to CBZ + SRT combined resulted in the appearance of a large peak corresponding to 2-hydroxy-CBZ (Fig. 6A1), which was undetectable in the absence of SRT (Fig. 6A) or in CBZ + SRT-exposed cells pretreated with ketoconazole (Fig. 6A2). As shown in Figure 6C1,C2, the time course of appearance of 2-hydroxy-CBZ in the culture of CBZ + SRT-exposed cells mirrored the rate of disappearance of CBZ. The time course of disappearance of CBZ in HEK cell cultures exposed to CBZ + SRT also mirrored the onset of cytotoxicity (Fig. 6B). Ketoconazole inhibited the bio-transformation (Fig. 6C3) and disappearance of CBZ from the culture and prevented the cytotoxic response (Fig. 6B1).
Discussion
This study demonstrates that neither CBZ nor SRT induces significant neurotoxicity when tested alone in vitro at concentrations as high as 50 μM in human neuronal cell lines. Conversely, when the two drugs were co-applied at much lower concentrations, a major cytotoxic reaction was observed, which could be documented not only in cultured human neurons but also in cultured human brain endothelial cells and human kidney embryonic cells. The cellular toxicity caused by exposure to these drugs in combination appeared to be mediated by production of reactive free radicals, because it was associated with increased nitrite generation and GSH depletion, and could be prevented by pretreating the cells with GSH and NAC. NAC is known to act as a precursor of GSH synthesis as well as an activator of cytosolic enzymes involved in GSH regeneration, and can also act as an antioxidant through a direct reaction between its reducing thiol groups and reactive oxygen species and free radicals.35
The protective effects of NAC against cytotoxicity induced by a variety of other agents, such as acetaminophen, appear to be primarily mediated by repletion of intracellular GSH reserves and consequent inhibition of reactive oxidized metabolites. NAC is also known to inhibit the pro-apoptotic protein Bax (upstream regulators of mitochondrial mediated apoptosis or programmed cell death) and downstream mediators such as caspases 3 and 9.36 Therefore, NAC may additionally maintain cellular homeostasis by effective inhibition of death cascades. In view of previous evidence linking CBZ-induced cellular damage to CYP-mediated production of reactive unstable metabolites,10–12,20 it could be hypothesized that the cytotoxic interaction observed in the present study was related to enhanced conversion of CBZ to toxic metabolites through CYP3A4, the primary CYP isoform involved in the metabolism of CBZ. This hypothesis was strongly supported by the finding that the neurotoxic reaction was potentiated in cells engineered to overexpress CYP3A4, and inhibited by pretreating the cells with the CYP3A4 inhibitor ketoconazole. More direct evidence of a pathogenetic role of reactive CBZ metabolites, such as iminoquinone, would require direct measurement of such metabolites, but this is unfeasible due to their extreme instability. An indirect estimate of the rate of formation of these metabolites, however, could be obtained by measuring stable precursors such 2-hydroxy-CBZ.10–12 The fact that this metabolite was not detectable in cells exposed to CBZ and SRT alone, but was present in appreciable amounts in the presence of the neurotoxic CBZ + SRT combination, provides probably the most compelling evidence that the cytotoxicity resulting from the interaction between the two drugs was mediated by increased formation of reactive CBZ metabolites via CYP3A4. This interpretation is further supported by the observation that the time course of the cytotoxic reaction mirrored closely the appearance of 2-hydroxy-CBZ in culture cells exposed to CBZ in combination with SRT.
The mechanism by which SRT could facilitate the formation of reactive CBZ metabolites in unclear. SRT is a relatively potent inhibitor of CYP2D6 and a weaker inhibitor of CYP3A4,20–22 but it may also inhibit other CYP enzymes such as CYP2C and CYP2A.20–22 Inhibition of CYP3A4, however, would be expected to occur at concentrations higher than those causing neurotoxicity when combined with CBZ in our in vitro systems.20–22 Because CBZ is metabolized by a variety of CYP isoforms in addition to CYP3A4,12 it is possible that SRT inhibited preferentially the non–CYP3A4-mediated metabolism of CBZ, thereby increasing its biotransformation along CYP3A4-mediated pathways. Because CYP3A4 is the primary enzyme involved in CBZ metabolism, however, it is difficult to envisage how inhibiting secondary pathways could modify the metabolic profile of CBZ to a major extent. On the other hand, information on CBZ metabolism is largely derived from studies in hepatocytes, and the possibility also exists that the contribution of non–CYP3A4-mediated pathways is greater in brain neuronal or endothelial cells than in the liver. Another possible mechanism by which SRT could enhance CBZ neurotoxicity is by increasing intracellular CBZ concentration through inhibition of P-gp and consequent antagonism of P-gp-mediated CBZ efflux. In fact, SRT is a potent inhibitor of P-gp,37,38 and has been found to increase the cytotoxicity of anticancer agents through this mechanism.39 CBZ is a known to be P-gp substrate in rodents,40 but its role as a P-gp substrate in humans has been questioned.40–42 An increased intracellular concentration of CBZ could lead to formation of greater amounts of reactive metabolites, but it would not explain the apparent qualitative changes in CBZ metabolic pathways induced by SRT in our cellular systems.
The potential clinical implications of the findings obtained in the present study remain to be established. Although cytotoxicity was observed at CBZ concentrations at the lower end of the clinically occurring plasma concentration range,26 the concentration of SRT was relatively high,21,28,29 even though consistent with the high SRT brain-to-plasma ratio reported from animal studies.30–32 Extrapolations of in vitro data to the in vivo situation is also difficult, due to differences in the cell systems involved and in the role of compensatory mechanisms, including endogenous antioxidant defense systems in the in vivo organism. Although SSRIs and AEDs such as CBZ are relatively often co-prescribed in patients with epilepsy,5 interactions between CBZ and SRT described to date in human subjects seem to be limited to case reports, suggesting that CBZ may increase SRT clearance43 and that SRT may increase plasma CBZ concentrations,44 even though the latter finding was not confirmed in a formal study.45 Despite the lack of published reports suggesting serious neurotoxic reactions in patients, we find that the adverse interaction reported in our study requires further investigation, both in preclinical models and whenever these drugs are combined in the clinical setting.
Supplementary Material
Acknowledgments
Supported by R01NS078307 (N.M. and D.J.), R01NS43284, R41MH093302, R21NS077236, R42MH093302, UH3TR000491, and R21HD057256 (D.J.). AHA-SDG 13SDG13950015 and NARSAD Brain-Behavior Research Foundation (C.G.).
Footnotes
Disclosure
None of the authors has any conflict of interest to disclose. We confirm that we have read the Journal’s position on issues involved in ethical publication and affirm that this report is consistent with those guidelines.
Additional Supporting Information may be found in the online version of this article: Figure S1. Relationship between cytotoxic responses (LIVE-DEAD assay) and exposure (15 min) to different concentrations of CBZ and SRT, alone and in combination, in human fetal brain–derived dopaminergic neurons.
Figure S2. Schematic diagram of the experimental design used to assess the effect of N-acetyl-L-cysteine (NAC) and of modulation of CYP3A4 activity on the cyto-toxicity induced by CBZ (17 μM) + SRT (5 μM) in human embryonic kidney (HEK) cells.
Figure S3. HPLC chromatograms showing the effect of CYP3A4 inhibition by ketoconazole on CBZ, SRT, and their metabolites.
Table S1. Precision of carbamazepine (CBZ), carbamaz-epine 10,11-epoxide (CBZ-E), 2-hydroxy carbamazepine (hydroxy-CBZ), sertraline (SRT), and desmethyl sertraline (desmethyl-SRT) quantification Data S1. Material and methods.
References
- 1.Kanner AM. Depression in epilepsy: prevalence, clinical semiology, pathogenic mechanisms, and treatment. Biol Psychiatry. 2003;54:388–398. doi: 10.1016/s0006-3223(03)00469-4. [DOI] [PubMed] [Google Scholar]
- 2.Kanner AM. Do epilepsy and psychiatric disorders share common pathogenic mechanisms? A look at depression and epilepsy. Clin Neurosci Res. 2004;4:31–37. [Google Scholar]
- 3.Cardamone L, Salzberg MR, O’Brien TJ, et al. Antidepressant therapy in epilepsy: can treating the comorbidities affect the underlying disorder? Br J Pharmacol. 2013;168:1531–1554. doi: 10.1111/bph.12052. [DOI] [PMC free article] [PubMed] [Google Scholar]
- 4.Lothe A, Didelot A, Costes N, et al. Comorbidity between temporal lobe epilepsy and depression: a MPPF-PET study. Epilepsia. 2006;47:280. doi: 10.1093/brain/awn194. [DOI] [PMC free article] [PubMed] [Google Scholar]
- 5.Malerba A, Ciampa C, De Fazio S, et al. Patterns of prescription of antiepileptic drugs in patients with refractory epilepsy at tertiary referral centres in Italy. Epilepsy Res. 2010;91:273–282. doi: 10.1016/j.eplepsyres.2010.08.002. [DOI] [PubMed] [Google Scholar]
- 6.Perucca E. Clinically relevant drug interactions with antiepileptic drugs. Br J Clin Pharmacol. 2006;61:246–255. doi: 10.1111/j.1365-2125.2005.02529.x. [DOI] [PMC free article] [PubMed] [Google Scholar]
- 7.Dresser GK, Spence JD, Bailey DG. Pharmacokinetic-pharma-codynamic consequences and clinical relevance of cytochrome P450 3A4 inhibition. Clin Pharmacokinet. 2000;38:41–57. doi: 10.2165/00003088-200038010-00003. [DOI] [PubMed] [Google Scholar]
- 8.Levy RH. Cytochrome-P450 isozymes and antiepileptic drug-interactions. Epilepsia. 1995;36:S8–S13. doi: 10.1111/j.1528-1157.1995.tb06007.x. [DOI] [PubMed] [Google Scholar]
- 9.Park BK, Boobis A, Clarke S, et al. Managing the challenge of chemically reactive metabolites in drug development. Nat Rev Drug Discov. 2011;10:292–306. doi: 10.1038/nrd3408. [DOI] [PubMed] [Google Scholar]
- 10.Ju C, Uetrecht JP. Detection of 2-hydroxyiminostilbene in the urine of patients taking carbamazepine and its oxidation to a reactive iminoquinone intermediate. J Pharmacol Exp Ther. 1999;288:51–56. [PubMed] [Google Scholar]
- 11.Pearce RE, Vakkalagadda GR, Leeder JS. Pathways of carbamazepine bioactivation in vitro I. Characterization of human cytochromes P450 responsible for the formation of 2- and 3-hydroxylated metabolites. Drug Metab Dispos. 2002;30:1170–1179. doi: 10.1124/dmd.30.11.1170. [DOI] [PubMed] [Google Scholar]
- 12.Pearce RE, Uetrecht JP, Leeder JS. Pathways of carbamazepine bioactivation in vitro: II. The role of human cytochrome P450 enzymes in the formation of 2-hydroxyiminostilbene. Drug Metab Dispos. 2005;33:1819–1826. doi: 10.1124/dmd.105.004861. [DOI] [PubMed] [Google Scholar]
- 13.Vignati L, Turlizzi E, Monaci S, et al. An in vitro approach to detect metabolite toxicity due to CYP3A4-dependent bioactivation of xenobiotics. Toxicology. 2005;216:154–167. doi: 10.1016/j.tox.2005.08.003. [DOI] [PubMed] [Google Scholar]
- 14.Dauchy S, Miller F, Couraud PO, et al. Expression and transcriptional regulation of ABC transporters and cytochromes P450 in hCMEC/D3 human cerebral microvascular endothelial cells. Biochem Pharmacol. 2009;77:897–909. doi: 10.1016/j.bcp.2008.11.001. [DOI] [PubMed] [Google Scholar]
- 15.Ghosh C, Puvenna V, Gonzalez-Martinez J, et al. Blood–brain barrier P450 enzymes and multidrug transporters in drug resistance: a synergistic role in neurological diseases. Curr Drug Metab. 2011;12:742–749. doi: 10.2174/138920011798357051. [DOI] [PMC free article] [PubMed] [Google Scholar]
- 16.Ghosh C, Marchi N, Desai NK, et al. Cellular localization and functional significance of CYP3A4 in the human epileptic brain. Epilepsia. 2011;52:562–571. doi: 10.1111/j.1528-1167.2010.02956.x. [DOI] [PMC free article] [PubMed] [Google Scholar]
- 17.Ghosh C, Hossain M, Puvenna V, et al. Expression and functional relevance of UGT1A4 in a cohort of human drug-resistant epileptic brains. Epilepsia. 2013;54:1562–1570. doi: 10.1111/epi.12318. [DOI] [PMC free article] [PubMed] [Google Scholar]
- 18.Marchi N, Gonzalez-Martinez J, Nguyen MT, et al. Transporters in drug-refractory epilepsy: clinical significance. Clin Pharmacol Ther. 2010;87:13–15. doi: 10.1038/clpt.2009.225. [DOI] [PMC free article] [PubMed] [Google Scholar]
- 19.Ghosh C, Marchi N, Hossain M, et al. A pro-convulsive carbamazepine metabolite: quinolinic acid in drug resistant epileptic human brain. Neurobiol Dis. 2012;46:692–700. doi: 10.1016/j.nbd.2012.03.010. [DOI] [PMC free article] [PubMed] [Google Scholar]
- 20.Bu HZ, Zhao P, Dalvie DK, et al. Identification of primary and sequential bioactivation pathways of carbamazepine in human liver microsomes using liquid chromatography/tandem mass spectrometry. Rapid Commun Mass Spectrom. 2007;21:3317–3322. doi: 10.1002/rcm.3220. [DOI] [PubMed] [Google Scholar]
- 21.Devane CL, Liston HL, Markowitz JS. Clinical pharmacokinetics of sertraline. Clin Pharmacokinet. 2002;41:1247–1266. doi: 10.2165/00003088-200241150-00002. [DOI] [PubMed] [Google Scholar]
- 22.Masubuchi Y, Kawaguchi Y. Time-dependent inhibition of CYP3A4 by sertraline, a selective serotonin reuptake inhibitor. Biopharm Drug Dispos. 2013;34:423–430. doi: 10.1002/bdd.1857. [DOI] [PubMed] [Google Scholar]
- 23.Cipriani A, Furukawa TA, Salanti G, et al. Comparative efficacy and acceptability of 12 new-generation antidepressants: a multiple-treatments meta-analysis. Lancet. 2009;373:746–758. doi: 10.1016/S0140-6736(09)60046-5. [DOI] [PubMed] [Google Scholar]
- 24.Mula M. Treatment of anxiety disorders in epilepsy: an evidence-based approach. Epilepsia. 2013;54:13–18. doi: 10.1111/epi.12101. [DOI] [PubMed] [Google Scholar]
- 25.Waheed SM, Ghosh A, Chakravarti R, et al. Nitric oxide blocks cellular heme insertion into a broad range of heme proteins. Free Radic Biol Med. 2010;48:1548–1558. doi: 10.1016/j.freeradbiomed.2010.02.038. [DOI] [PMC free article] [PubMed] [Google Scholar]
- 26.Patsalos PN, Berry DJ, Bourgeois BFD, et al. Antiepileptic drugs –best practice guidelines for therapeutic drug monitoring: a position paper by the subcommission on therapeutic drug monitoring. ILAE Commission on Therapeutic Strategies. Epilepsia. 2008;49:1239–1276. doi: 10.1111/j.1528-1167.2008.01561.x. [DOI] [PubMed] [Google Scholar]
- 27.Devane CL, Donovan JL, Liston HL, et al. Comparative CYP3A4 inhibitory effects of venlafaxine, fluoxetine, sertraline, and nefazodone in healthy volunteers. J Clin Psychopharmacol. 2004;24:4–10. doi: 10.1097/01.jcp.0000104908.75206.26. [DOI] [PubMed] [Google Scholar]
- 28.Mauri MC, Fiorentini A, Cerveri G, et al. Long-term efficacy and therapeutic drug monitoring of sertraline in major depression. Hum Psychopharmacol. 2003;18:385–388. doi: 10.1002/hup.502. [DOI] [PubMed] [Google Scholar]
- 29.Reis M, Aamo T, Spigset O, et al. Serum concentrations of antidepressant drugs in a naturalistic setting: compilation based on a large therapeutic drug monitoring database. Ther Drug Monit. 2009;31:42–56. doi: 10.1097/FTD.0b013e31819114ea. [DOI] [PubMed] [Google Scholar]
- 30.Doran A, Obach RS, Smith BJ, et al. The impact of P-glycoprotein on the disposition of drugs targeted for indications of the central nervous system: evaluation using the MDR1A/1B knockout mouse model. Drug Metab Dispos. 2005;33:165–174. doi: 10.1124/dmd.104.001230. [DOI] [PubMed] [Google Scholar]
- 31.Tremaine LM, Welch WM, Ronfeld RA. Metabolism and disposition of the 5-hydroxytryptamine uptake blocker sertraline in the rat and dog. Drug Metab Dispos. 1989;17:542–550. [PubMed] [Google Scholar]
- 32.Wang JS, Devane CL, Gibson BB, et al. Population pharmacokinetic analysis of drug–drug interactions among risperidone, bupropion, and sertraline in CF1 mice. Psychopharmacology. 2006;183:490–499. doi: 10.1007/s00213-005-0209-y. [DOI] [PubMed] [Google Scholar]
- 33.Shaw G, Morse S, Ararat M, et al. Preferential transformation of human neuronal cells by human adenoviruses and the origin of HEK 293 cells. FASEB J. 2002;16:869–871. doi: 10.1096/fj.01-0995fje. [DOI] [PubMed] [Google Scholar]
- 34.Kobayashi K, Yoshida A, Ejiri Y, et al. Increased expression of drug-metabolizing enzymes in human hepatocarcinoma FLC-4 cells cultured on micro-space cell culture plates. Drug Metab Pharmacokinet. 2012;27:478–485. doi: 10.2133/dmpk.dmpk-12-rg-016. [DOI] [PubMed] [Google Scholar]
- 35.Zhang Y, An Y, Jiang LP, et al. The role of oxidative stress in Sudan IV-induced DNA damage in human liver-derived HepG2 cells. Environ Toxicol. 2011;26:292–299. doi: 10.1002/tox.20558. [DOI] [PubMed] [Google Scholar]
- 36.Wu JY, Muldoon LL, Neuwelt EA. The chemoprotective agent N-acetylcysteine blocks cisplatin-induced apoptosis through caspase signaling pathway. J Pharmacol Exp Ther. 2005;312:424–431. doi: 10.1124/jpet.104.075119. [DOI] [PubMed] [Google Scholar]
- 37.Kapoor A, Iqbal M, Petropoulos S, et al. Effects of sertraline and fluoxetine on P-glycoprotein at barrier sites. In vivo and in vitro approaches. PLoS ONE. 2013;8:e56525. doi: 10.1371/journal.pone.0056525. [DOI] [PMC free article] [PubMed] [Google Scholar]
- 38.O’Brien FE, Dinan TG, Griffin BT, et al. Interactions between antidepressants and P-glycoprotein at the blood–brain barrier: clinical significance of in vitro and in vivo findings. Br J Pharmacol. 2012;165:289–312. doi: 10.1111/j.1476-5381.2011.01557.x. [DOI] [PMC free article] [PubMed] [Google Scholar]
- 39.Drinberg V, Bitcover R, Rajchenbach W, et al. Modulating cancer multidrug resistance by sertraline in combination with a nanomedicine. Cancer Lett. 2014;354:290–298. doi: 10.1016/j.canlet.2014.08.026. [DOI] [PubMed] [Google Scholar]
- 40.Ma AM, Wang CC, Chen YH, et al. P-glycoprotein alters blood–brain barrier penetration of antiepileptic drugs in rats with medically intractable epilepsy. Drug Des Devel Ther. 2013;7:1447–1454. doi: 10.2147/DDDT.S52533. [DOI] [PMC free article] [PubMed] [Google Scholar]
- 41.Dickens D, Yusof SR, Abbott NJ, et al. A multi-system approach assessing the interaction of anticonvulsants with P-gp. PLoS ONE. 2013;8:e64854. doi: 10.1371/journal.pone.0064854. [DOI] [PMC free article] [PubMed] [Google Scholar]
- 42.Zhang CB, Zuo Z, Kwan P, et al. In vitro transport profile of carbamazepine, oxcarbazepine, eslicarbazepine acetate, and their active metabolites by human P-glycoprotein. Epilepsia. 2011;52:1894–1904. doi: 10.1111/j.1528-1167.2011.03140.x. [DOI] [PubMed] [Google Scholar]
- 43.Khan A, Shad MU, Preskorn SH. Lack of sertraline efficacy probably due to an interaction with carbamazepine. J Clin Psychiatry. 2000;61:526–527. doi: 10.4088/jcp.v61n0712a. [DOI] [PubMed] [Google Scholar]
- 44.Joblin M, Ghose K. Possible interaction of sertraline with carba-mazepine. N Z Med J. 1994;107:43. [PubMed] [Google Scholar]
- 45.Rapeport WG, Coates PE, Dewland PM, et al. Absence of a sertraline-mediated effect on digoxin pharmacokinetics and electrocardiographic findings. J Clin Psychiatry. 1996;57:20–23. [PubMed] [Google Scholar]
Associated Data
This section collects any data citations, data availability statements, or supplementary materials included in this article.