Abstract
Organogenesis of the ovary is a highly orchestrated process involving multiple lineage determinations of ovarian surface epithelium, granulosa cells, and theca cells. While the sources of ovarian surface epithelium and granulosa cells are known, the origin(s) of theca progenitor cells have not been definitively identified. Here we show that theca cells derive from two sources: Wt1+ cells indigenous to the ovary and Gli1+ mesenchymal cells migrated from the mesonephros. These progenitors acquire theca lineage marker Gli1 in response to paracrine signals Desert hedgehog (Dhh) and Indian hedgehog (Ihh) from granulosa cells. Ovaries lacking Dhh/Ihh exhibit theca layer loss, blunted steroid production, arrested folliculogenesis, and failure to form corpora lutea. Production of Dhh/Ihh in granulosa cells requires Growth differentiation factor 9 (GDF9) from the oocyte. Our studies provide the first genetic evidence for the origins of theca cells and reveal a multicellular interaction critical for the formation of a functional theca.
Ovarian morphogenesis is a highly orchestrated process in which follicles, the basic unit of the ovary, form through an intricate communication between the oocyte, granulosa cells immediately surrounding the oocyte, and theca cells in the mesenchyme. Defects in this process have dire consequences for female reproductive health and fertility 1,2. The process of folliculogenesis starts with the breakdown of germ cell nests, in which an individual oocyte becomes encased by somatic granulosa cells. As the follicle continues to grow, it recruits precursors for the theca cell lineage and completes the process of follicle assembly 2,3. Theca cells and granulosa cells communicate through epithelial-mesenchymal crosstalk during the course of follicle development 4. Theca cells produce androgens, which is subsequently converted to estrogens by granulosa cells 2. Granulosa cell-derived estrogens in turn provide a local feedback loop in regulating androgen production in the theca cells 5. This unique interaction lays the foundation of the two-cell theory, and illustrates the significance of theca cells in follicular steroid production.Disorders in theca cell differentiation are implicated in ovarian diseases such as polycystic ovary syndrome (PCOS), premature ovarian failure, and ovarian cancers 6-8. Despite their critical involvement in ovarian development and ovarian pathology, the definitive origin of theca cells has not been identified 9-13.
Theca cells in the mouse ovary do not become morphologically distinguishable until one week after birth in follicles with two layers of granulosa cells (secondary follicles) 2. However, specification of the theca cell fate already occurs at around time of birth, as neonatal ovaries contain a specified stem/progenitor cell population for theca cells 14.The differentiated theca cells are located in the ovarian mesenchyme, which is separated from granulosa cells and oocytes by a basal membrane 2. Their histological proximity to granulosa cells led to the hypothesis that recruitment of theca cells from the stroma is regulated by factor(s) produced by granulosa cells 15.A candidate for this factor is Hedgehog (Hh) ligand, a morphogen responsible for lineage specification in many organs 16. In adult ovaries, Indian hedgehog (Ihh) and Desert hedgehog (Dhh) are detected in granulosa cells, and their downstream target Gli1 is expressed in the theca layer 17.In this study, we show that Gli1 expression starts to appear in the mesenchyme of neonatal ovary after birth, and the neonatal Gli1-positive cells represent a progenitor pool for adult theca cells. The Gli1-positive theca progenitor population consists of cells from two distinct sources: the fetal ovary and the mesonephros. The fetal ovary- and mesonephros-derived progenitor cells converge in the ovary after birth and commit to the lineage of theca cells by acquiring Gli1 expression. The expression of Gli1 in the theca progenitor cells is induced by Dhh and Ihh in granulosa cells. In the absence of Dhh and Ihh, theca progenitor cells fail to differentiate into androgen-producing theca cells and ovarian folliculogenesis is disrupted. Furthermore, the Hh ligand production in granulosa cells is regulated by oocyte-specific factor GDF9. Our results demonstrate that the establishment of theca cell lineage requires both granulosa cells and oocyte through multicellular interactions via GDF9 and Hh signaling.
Time course and cell type expression of Gli1 in the ovary
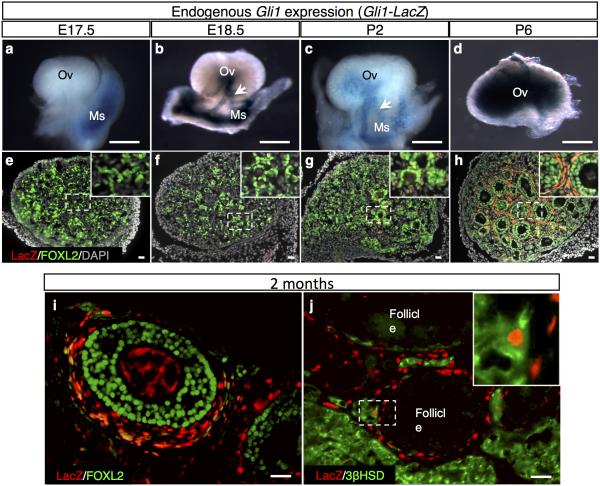
The expression of Gli1, indicated by the presence of beta-galactosidase in the Gli1-LacZ reporter mouse, was absent in the ovary before birth and became apparent in the ovary at postnatal day 2 (P2) (Fig. 1a-h). Before birth, Gli1-LacZ expression was restricted to the mesenchyme of the mesonephros immediately adjacent to the ovary (Supplementary Fig. 1), particularly in the mesonephric tubules that connect the rete ovarii of the ovary (Fig. 1b). Between birth and P2, the expression of Gli1 spread from mesonephric tubules into ovarian interstitium (Fig. 1b, c, g and supplementary Fig. 2). By P6, Gli1-LacZ-positive cells were found in the mesenchyme surrounding the FOXL2-positive granulosa cells (Fig. 1d, h). This pattern persisted in the adult ovary (Fig. 1i, j).
Figure 1. Time course analyses of Gli1 expression in the ovary.
a-j, Expression of Gli1-LacZ in the ovaries was detected by whole mount beta-galactosidase staining (a-d) or fluorescent immunohistochemistry for Gli1-positive cell marker LacZ, granulosa cell marker FOXL2, steroidogenic cell marker 3bHSD and nuclear counterstain DAPI at E17.5 (a, e), E18.5 (b, f), P2 (c, g), P6 (d, h) and 2 months (i, j). The insets are higher magnification of the outlined areas in e-h and j. Arrow, mesonephric tubules; E, embryonic day; Ov, ovary; Ms, mesonephros; P, postnatal day. n=3-5 for each Gli1-LacZ specimen. Scale bar: a-d, 500 mm; e-j, 25 mm.
Mesonephros-derived Gli1+ cells are a source of theca cells
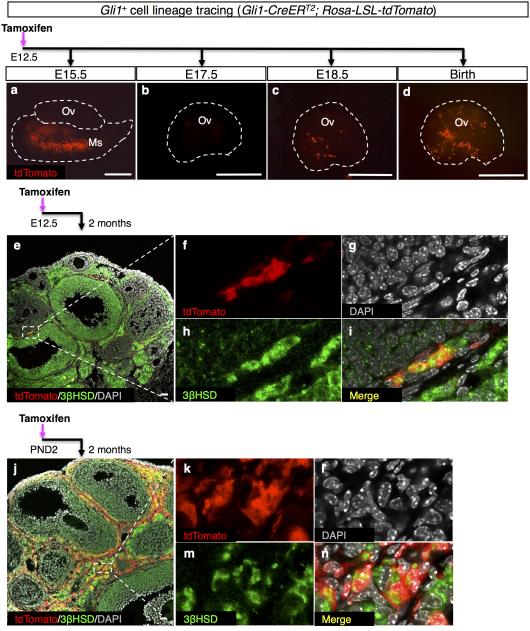
The close association of Gli1-positive cells in the mesonephros and the ovary suggests that Gli1-positive cells from the mesonephros could be a source of theca progenitors. To test this hypothesis, we utilized a tamoxifen-induced Rosa-LSL-tdTomato lineage-tracing model, in which Gli1-positive cells in the mesonephros were labeled exclusively during embryogenesis 18. We administered a single tamoxifen injection to pregnant mice carrying Gli1-CreERT2; Rosa-LSL-tdTomato embryos at E12.5, when Gli1 expression was restricted to the mesonephros 19. The specificity of this model was confirmed by the lack of fluorescence in control embryos (Supplementary Fig. 3). During fetal life, the tdTomato-positive cells were present specifically in the mesonephros but absent in the ovary (Fig. 2a, b), consistent with endogenous Gli1 expression pattern (Fig. 1a, e). The tdTomato-positive cells first appeared in the ovary just before birth (Fig. 2c) and a significant number of these cells were observed in the ovary at birth (Fig. 2d and Supplementary Fig. 4). This result demonstrates that the tdTomato-positive cells in the neonatal ovary were derived from the Gli1-positive cells in the fetal mesonephros. At two months of age, the mesonephros-derived Gli1-positive cells in the ovarian interstitium became steroidogenic theca cells positive for 3βHSD (Fig. 2e-i).
Figure 2. Lineage-tracing experiments for the Gli1-positive cells in the ovary and mesonephros.
a-n, Lineage-tracing of the Gli1-positive cells in the Gli1-CreERT2; Rosa-LSL-tdTomato embryos was induced by tamoxifen (TM) administration at E12.5 (mesonephros-derived, a-i), or at P2 (neonatal ovary-derived, j-n). The ovaries were examined at different stages of development for tdTomato, steroidogenic marker 3bHSD, and DAPI. The staining for 3βHSD was observed not only in theca cell layer but also in granulosa cells in large antral follicles. f-i and k-n are higher magnification images of the outlined areas in e and j in single fluorescence channels. n=3-6 for each Gli1-CreERT2; Rosa-LSL-tdTomato specimen. Scale bar: a-d, 500 mm; e&i, 25 mm.
When comparing the Gli1-positive cells in the ovary (Fig. 1d, h) with the contribution of Gli1-positive cells from the mesonephros (Fig. 2e-i), it became apparent that the mesonephros-derived Gli1-positive cells represent a small fraction of the ovarian Gli1-positive cell population. The majority of theca cells seem to come from the ovarian mesenchymal cells that become Gli1-positive (Fig. 1g, h). This hypothesis was supported by the findings that lineage-labeled ovarian Gli1-positive cells at P2 (Fig. 1c, g) became 3βHSD-positive cells in the theca compartment (Fig. 2j-n). Notably, ovarian Gli1-positive cells at P2 gave rise to nearly all cells in the theca layer in the adult ovary (Fig. 2j). These results suggest that a small percentage of the theca cells in the adult ovary are derived from the mesonephros whereas the majority of the theca cells must come from progenitor cells that originated in the ovarian mesenchyme.
Ovary-derived Wt1+ cells are the main source of theca cells
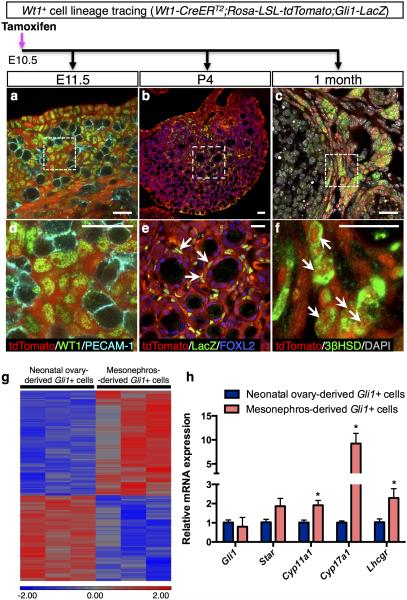
The progenitor cells in the gonadal primordium are thought to be the bona fide source of gonadal somatic cells 20. When the somatic cell progenitors first appear in the gonad, they express Wilms’ tumor 1 (Wt1), a transcription factor essential for gonadal formation 21,22.To determine if the gonad-derived Wt1-positive cells contribute to the theca cell lineage, we performed similar tamoxifen-induced lineage-tracing experiments by labeling the Wt1-postive cells in Wt1-CreERT2; Rosa-LSL-tdTomato gonads at the onset of sex determination (E10.5). Twenty-four hours after tamoxifen treatment, the lineage-labeled Wt1-positive cells were present in the somatic compartment of fetal ovaries overlapped with endogenous WT1 protein (Fig. 3a, d). At one month of age, the ovary-derived Wt1-positive cells were located in the ovarian interstitium surrounding the follicles and positive for 3βHSD (Fig. 3c, f). These results indicate that Wt1 marks a specific pool of steroidogenic precursors in the indifferent gonad before sexual differentiation occurs.To further investigate if these fetal ovary-derived Wt1-positive cells become Gli1-positive theca progenitor cells after birth (Fig. 1g, 1h), we examined the induction of Gli1-LacZ expression in the Wt1-positive cells. When the fetal ovary-derived Wt1-positive cells began to surround the primary follicles in the medulla of the ovary, they acquired the expression of Gli1, indicating that they have committed to the theca cell lineage (Fig. 3b, e).
Figure 3. Lineage-tracing experiments for the Wt1-positive cells in the ovary and transcriptome analysis of the mesonephros- and ovary-derived Gli1-positive cells.
a-c, Lineage-tracing of the fetal ovary-derived Wt1-positive cells in the Wt1-CreERT2; Rosa-LSL-tdTomato; Gli1-LacZ embryos was induced by tamoxifen (TM) administration at E10.5. The ovaries were analyzed at different stages of development (E11.5, P4, and 1 month) by fluorescent immunohistochemistry for tdTomato, WT1, germ cell marker PECAM-1, LacZ, granulosa cell marker FOXL2, steroidogenic marker 3bHSD, and DAPI. E= embryonic day; P= postnatal day. d-f, are higher magnification of the outlined areas in (a-c). Arrows indicate fetal ovary-derived Wt1-positive cells.n=3-4 for each specimen. Scale bar: 25 mm. g, Microarray analyses of 3 independent pools of the mesonephros-derived and the neonatal ovary-derived Gli1-positive cells. All cells were isolated from the adult ovaries of Gli1-CreERT2; Rosa-LSL-tdTomato mice at 2 months of age. h, qPCR analysis of Gli1 and markers of theca cell steroidogenesis (Star, Cyp11a1, Cyp17a1, and Lhcgr) in the mesonephros-derived (n=3) and the neonatal ovary-derived Gli1-positive cells (n=3). *P < 0.05; Two-tailed Student’s t-test. Values are presented as means±s.e.m.
Transcriptomes of ovary- and mesonephros-derived Gli1+ cells
Fetal ovary-derived Wt1-positive cells and mesonephros-derived Gli1-positive cells appear to represent two different populations of theca cells. Fetal ovary-derived Wt1-positive cells were found in the entire theca in the adult ovary, whereas mesonephros-derived Gli1-positive cells were located preferentially to the basal lamina (Supplementary Fig. 5), a region that contains predominantly steroidogenic cells 3. This observation leads to the hypothesis that these two cellular sources of progenitors represent unique populations in the theca. We isolated mesonephros-derived Gli1-positive cells (Fig. 2e) and neonatal ovary-derived Gli1-positive cells (Fig.2j) by FACS from 2 month-old mice, and compared their transcriptomes (Fig. 3g). The microarray analysis indicated that mesonephros-derived theca cells exhibit a transcriptome distinctly different from that of the ovary-derived Gli1 population. Many of the genes enriched in the mesonephros-derived theca cells were associated with steroidogenesis, including Star, Cyp11a1, Cyp17a1, and Lhcgr (Fig. 3h). The steroidogenic activity of these cells was also confirmed by immunostaining with 3βHSD (Supplementary Fig. 6). In contrast, the ovary-derived Gli1-positive cells exhibited higher expression of Esr1 (Estrogen receptor 1), Wt1, and genes implicated in cell growth and proliferation (Supplementary Table 1), consistent with their ubiquitous distribution within the theca layer.These results demonstrate that ovary-derived Gli1-positive cells represent a broad mesenchymal cell population(s), whereas the mesonephros-derived Gli1-positive cells contribute to the steroidogenic cell population in the theca.
Granulosa cells are sources of Hedgehog ligands Dhh and Ihh
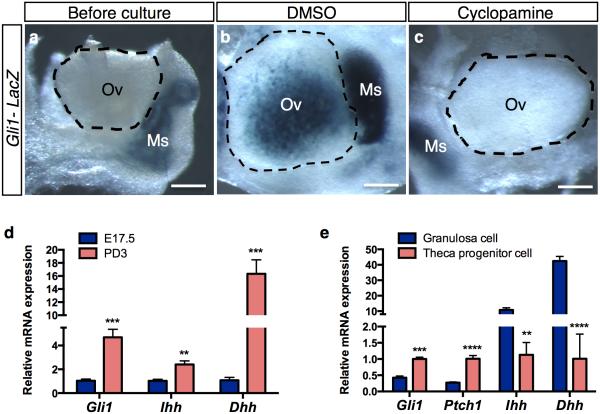
The identification of Gli1 as a theca cell lineage marker raises the question: what signal(s) specify theca cell lineage and induces Gli1 expression? Gli1 is a known downstream target of the Hh pathway 19. We first examined whether activation of the Hh pathway is responsible for inducing Gli1 expression by culturing fetal ovaries in the presence or absence of the Hh inhibitor cyclopamine 23. Cyclopamine treatment inhibited Gli1 expression in the ovaries compared to the controls (Fig. 4a-c), indicating that Gli1 expression is induced by the canonical Hh pathway. In search of the Hh ligands that may be responsible for activating the Hh pathway, we examined mRNA expression of Desert Hedgehog (Dhh), Indian Hedgehog (Ihh), and Sonic hedgehog (Shh) in the ovary before (E17.5) and after (PND3) the appearance of Gli1. Expression of Dhh and Ihh was low in the ovary before birth and significantly increased at PND3, corresponding to the onset of Gli1 expression (Fig. 4d). Expression of Shh was undetectable in ovaries at both stages (Supplementary Fig. 7). To identify which somatic cell type(s) produce Dhh and Ihh, we isolated theca progenitor cells (Gli1-CreERT2; Rosa-LSL-tdTomato) and granulosa cells (Foxl2-CreERT2; Rosa-LSL-tdTomato) from perinatal ovaries by FACS (Supplementary Fig. 8). We found that the Hh downstream targets Gli1 and Ptch1 were highly enriched in theca progenitor cells, whereas Hh ligands Dhh and Ihh were found predominantly in granulosa cells (Fig. 4e).These results implicate a novel regulation of theca cell differentiation by granulosa cells through the Hedgehog signaling pathway.
Figure 4. Dhh and Ihh in the granulosa cells are responsible for Gli1 expression in the theca progenitor cells.
a-c, Effects of the Hedgehog inhibitor cyclopamine on expression of Gli1-LacZ in the ovary. Gli1-LacZ ovaries (E18.5) were cultured in the presence or absence of cyclopamine (25 μM) for 3 days followed by LacZ staining (blue). Ov= ovary; Ms= mesonephros. n=5-6 for each specimen. Scale bar: 500 mm. d, qPCR analysis of Gli1, Ihh and Dhh mRNA expression in E17.5 (n=5) and PD3 (n=5) ovaries. e, qPCR analysis of Gli1, Ptch1, Ihh, and Dhh mRNA expression in granulosa cells (n=5) and theca progenitor cells (n=3). Cells isolated from a pair of ovaries were pooled as n of 1. (see Supplementary Fig. 8 for details). **P < 0.01; ***P < 0.001; ****P< 0.0001; Two-tailed Student’s t-test. Values in all graphs are presented as means±s.e.m.
Loss of Dhh and Ihh abolishes theca cell differentiation
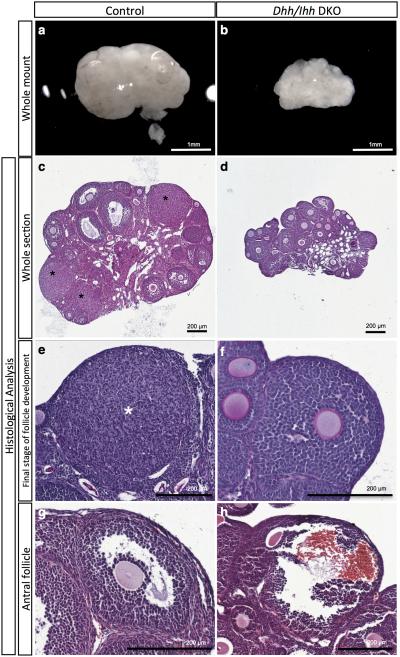
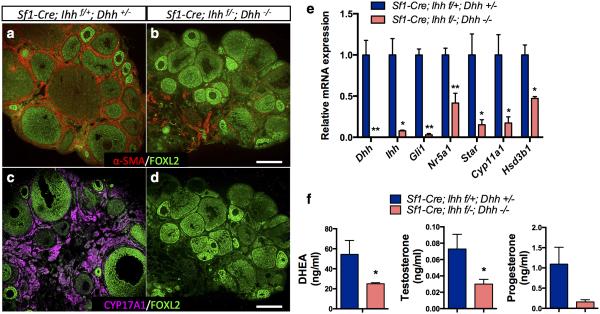
Female Dhh-deficient mice are fertile and exhibit normal ovarian development 24, suggesting that the other Hh ligands, such as Ihh, may compensate for the loss of Dhh during folliculogenesis. Most of the Ihh global deficient embryos die before birth 25, therefore precluding the analysis of the ovary in the adult. To investigate whether Dhh and Ihh together regulate theca cell development, we generated Dhh/Ihh double knockout mice (Hereafter referred as Dhh/Ihh DKO), in which both Dhh and Ihh were ablated from Sf1-positive gonadal somatic cells (Sf1-Cre; Ihh f/−; Dhh −/−) 26. Although Sf1-cre is known to be active in the pituitary, we do not expect that it affects pituitary functions based on the fact that Dhh and Ihh are not expressed in the pituitary 16,27. Ovaries deficient in either Dhh or Ihh alone exhibited normal folliculogenesis (Supplementary Fig. 9). However, Dhh/Ihh DKO ovaries were significantly smaller in size and irregular in shape compared to the control (Fig.5a, b). In contrast to the normal progression of folliculogenesis and the presence of corpora lutea in adult control ovaries, Dhh/Ihh DKO ovaries lacked corpora lutea, and follicles failed to progress beyond preantral follicle stage, suggesting that ovulation did not occur (Fig. 5c-f). Antral follicles were rarely found in the DKO ovaries and if they were present, they appeared cystic and hemorrhagic (Fig. 5g, h). In addition to a loss of theca, as determined by α-SMA, a marker for smooth muscle cells in the theca layer (Fig. 6a, b) 28, CYP17A1-positive androgen-producing theca cells were also absent in the mesenchyme of DKO ovaries (Fig. 6c, d). Furthermore, steroidogenic genes, including Nr5a1, Star, Cyp11a1, and Hsd3b1 (Fig. 6e), were significantly downregulated along with a decrease in serum levels of dehydroepiandrosterone (DHEA), testosterone, and progesterone in the DKO mice (Fig. 6f). These results altogether support the model that Dhh and Ihh from granulosa cells are responsible for the establishment of theca cell linage. In the absence of Dhh and Ihh, theca cell layer failed to form and preantral follicles were unable to develop further.
Figure 5. Loss of Dhh and Ihh results in defective folliculogenesis in the ovary.
a-h, Whole mount light-field microscopic images (a-b) and histological analysis of the ovaries (c-h) from control (Sf1-Cre; Ihh f/+; Dhh+/−) and Dhh/Ihh DKO mice (Sf1-Cre; Ihh f/−; Dhh −/−) at 2 months of age. c-d,whole ovarian sections with different stages of follicle development. e-f, the most advanced stage of follicle development in control (corpus luteum) and DKO ovaries (Preantral follicle). g-h, antral follicles from control and DKO ovaries (hemorrhagic). Asterisks indicate the presence of corpora lutea.n=7 for all control specimens and n=3 for the Dhh/Ihh DKO specimens. Scale bar: a-b, 1 mm; c-h, 200 mm.
Figure 6. Dhh and Ihh are required for theca cell development in the ovary.
a-d, Immunofluorescence of α-SMA in red (a, b), CYP17A1 in magenta (c, d) and FOXL2 in green in Dhh/Ihh DKO (n=3) and control ovaries (n=7). α-SMA is a marker for smooth muscle cell. CYP17A1 is a marker for androgen-producing theca cells and FOXL2 marks granulosa cells. Scale bar: 200 mm. e, qPCR analysis of gene expression for Hedgehog signaling components (Dhh, Ihh, and Gli1), and genes associated with steroidogenesis (Nr5a1, Star, Cyp11a1, and Hsd3b1) in control (n=4) and DKO ovaries (n=3). Two-tailed Student’s t-test was used. *P < 0.05; **P < 0.01. f, Serum levels of DHEA, testosterone and progesterone in control (n=7) and Dhh/Ihh DKO female mice (n=3). *P < 0.05. Two-tailed Student’s t-test was used and values in all graphs are presented as means±s.e.m.
Oocyte-derived GDF9 regulates Dhh /Ihh in granulosa cells
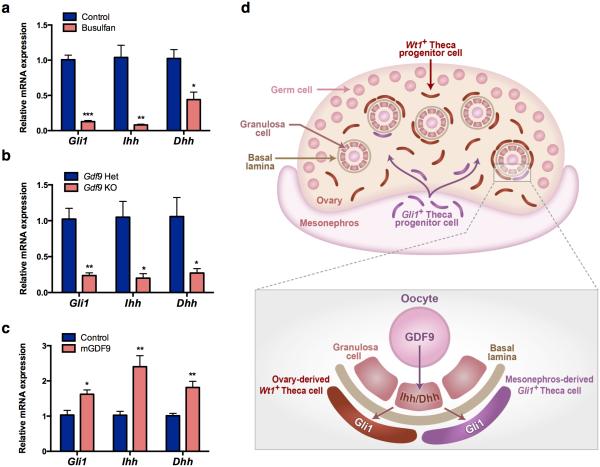
Next we investigated what signal induces the production of Hh ligands in the granulosa cells. Functions of granulosa cells are regulated not only systemically by hormone signals from the pituitary, but also locally via factors produced in the oocytes 1. Without the oocyte, follicle formation never occurs 29. To test if oocytes play a role in Hh ligand production, we treated pregnant females with busulfan, a chemotherapeutic drug known to induce oocyte death in the embryos 30,31. The specificity of in utero busulfan treatment on oocytes was confirmed by a complete abolishment of oocytes, coincident with normal establishment of FOXL2-positive granulosa cell population in ovaries of busulfan-treated pups (Supplementary Fig. 10). In the oocyte-depleted ovaries, expression of Dhh, Ihh, and Gli1 were significantly downregulated (Fig. 7a and Supplementary Fig. 10), suggesting that oocyte-derived factor(s) contributes to Dhh and Ihh production in granulosa cells. One potential candidate of such factor is Growth differentiation factor 9 (Gdf9), an oocyte-specific factor essential for folliculogenesis 1,32. In neonatal Gdf9 knockout ovaries, expression of Dhh and Ihh was significantly reduced, and Gli1 expression was also decreased (Fig. 7b). When recombinant GDF9 was supplemented to oocyte-depleted ovaries (Busulfan-treated) in culture, it increased mRNA expression of Ihh, Dhh, and subsequent Gli1 (Fig. 7c), further supporting the role of oocyte-derived GDF9 in stimulating Dhh and Ihh production in granulosa cells and subsequent appearance of Gli1-positive theca progenitor cells (Fig, 7d). To exclude the possibility that GDF9 might directly act on theca cells, we examined the expression of Gdf9 in the DKO ovaries and it was not different from those of control animals (Supplementary Fig. 11).
Figure 7. Gli1 expression in the theca progenitor cells is induced by oocyte-derived factor GDF9 through Hedgehog signaling in granulosa cells.
a, qPCR analysis of Gli1, Ihh and Dhh mRNA expression in the control (n=4) and busulfan-treated ovaries (n=3). Two ovaries were pooled as n of 1 and three times independent experiments were repeated. b, qPCR analysis of Gli1, Ihh and Dhh mRNA expression in control (n=3) and Gdf9 knockout ovaries (n=3). c, qPCR analysis of Gli1, Ihh and Dhh mRNA expression in the E18.5 oocyte-depleted ovaries (busulfan-treated) cultured with (n=5) or without (n=5) recombinant mouse GDF9 protein (60 ng/ml). The expression level in oocyte-depleted ovaries without GDF9 (Control) was set as 1. Two ovaries were pooled as n of 1 and two times independent experiments were repeated. *P < 0.05; **P < 0.01; ***P < 0.001; Two-tailed Student’s t-test. Values in all graphs are presented as means±s.e.m. d, Proposed model for the origins and establishment of theca cell lineage in the mouse ovary.
Discussion
We provide the first genetic evidence for the origins of theca progenitor cells: Wt1-positive cells intrinsic to ovary and Gli1-positive cells in the mesonephros, It is not clear why two sources of theca cell progenitors are required for follicle development and we speculate that this phenomenon may relate to temporal and spatial characteristics of follicle development. Two classes of primordial follicles are present in the ovary: the primordial follicles (first wave) that are activated immediately after birth in the medulla of the ovary, and the primordial follicles (second wave) that are gradually activated later in adulthood in ovarian cortex 33.Granulosa cell precursors that comprise each primordial follicle appear to be heterogeneous populations. The pre-granulosa cells that are specified during fetal stage contribute to the first wave of primordial follicles in the medulla of the ovary immediately after birth. On the other hand, the granulosa cells in the cortex of postnatal ovaries participate in the second wave of primordial follicles later in adulthood 34.Along this line of evidence, our finding demonstrated that theca cells also arise from two distinct sources. It is possible that the two sources of theca progenitor cells are involved in the two waves of follicular development. The mesonephros-derived Gli1-positive cells are first seen in the medulla of the neonatal ovary where the first wave of follicular development occurs. This observation suggests that the mesonephros-derived theca progenitor cells could be implicated in the initiation of the first wave of folliculogenesis. It is not clear whether the GDF9/Hedgehog signaling is controlling both classes of follicles, or a certain population. However, if GDF9/Hedgehog signaling controls only one class of follicles but not the other, one would assume that the other class of follicles should develop normally with the formation of a functional theca in the absence of GDF9 or Hedgehog signaling. In fact, in the Dhh/Ihh DKO ovaries, the theca layer failed to differentiate in all follicles, indicating that both classes of follicles are affected by the loss of Dhh and Ihh.
Although Dhh and Ihh appear to be downstream targets of GDF9, the ovarian phenotypes of Gdf9 KO ovaries differ from those observed in Dhh/Ihh dKO ovaries. The follicles in the Gdf9 KO ovaries arrest at primary stage, whereas follicles in Dhh/Ihh dKO ovaries develop beyond the primary stage and arrest at the preantral stage. The difference in phenotypes reveals two important findings: First, DHH/IHH signaling pathway plays a specific role in theca cell differentiation and second, GDF9, the factor responsible for the production of Dhh and Ihh, has a broader function in follicle development. The identities of other players that act downstream of GDF9 remains to be identified.
In contrast to the long-standing assumption that theca cells derive exclusively from within the ovarian stroma 13, we reveal an extra-ovarian source of Gli1-positive cells from the mesonephros that contributes to the adult theca cell lineage. In addition, we demonstrate that Wt1 marks a specific pool of steroidogenic precursors in the bipotential gonad before sexual differentiation occurs. These theca progenitor cells commit to theca cell lineage via signals from oocyte (GDF9) and granulosa cells (DHH and IHH). Oocyte-specific factor GDF9 stimulates Hh ligand production in granulosa cells, which in turn induces the differentiation of Gli1-positive theca progenitor cells (Fig. 7d). Given that disorders in theca cell differentiation are implicated in ovarian diseases such as polycystic ovary syndrome, premature ovarian failure and ovarian cancers 6-8,35,36, our discovery of the origins of theca cells and the mechanism underlying their appearance not only fill a critical void in basic ovarian biology, but also serve as novel entry points to understand how theca cell-related pathology affects female reproductive health.
Methods
Animals breeding
Gli1-LacZ (#008211), Gli1-CreERT2 (#007913), Wt1-CreERT2 (#010912), Foxl2-CreERT2 (#015854), Rosa-LSL-tdTomato (#007905), Dhh+/− (#002784), Ihh+/− (#004290) mice were purchased from the Jackson Laboratory (Bar Harbor, ME). Sf1-Cre and Ihh floxed/floxed mice were kind gifts from Dr. Keith Parker (UT Southwestern Medical Center) and Dr. Francesco DeMayo (Baylor College of Medicine), respectively. Female mice were housed with male mice overnight and checked for the presence of vaginal plug the next morning. The day when the vaginal plug was detected was considered embryonic day (E) 0.5. The day of birth was considered postnatal day 1 (P1).All animal procedures were approved by the National Institute of Environmental Health Sciences (NIEHS) Animal Care and Use Committee and are in compliance with a NIEHS-approved animal study proposal. All experiments were performed on at least three animals for each genotype.
Busulfan treatment
Pregnant CD-1 females were injected intraperitoneally (IP) at E10.5 with 40 mg/kg of busulfan (Sigma) dissolved in 50% DMSO, or an equivalent volume of 50% DMSO as the vehicle control.
Tamoxifen treatment
CreERT2 activity was induced by IP injection of 1 mg tamoxifen (T-5648, Sigma-Aldrich, St. Louis, MO) per mouse in corn oil, receptively. For the vehicle control, an equivalent volume of corn oil was injected. No overt teratological effects were observed after tamoxifen administration under these conditions.
Immunohistochemistry and histological analysis
For immunohistochemistry on frozen sections, ovaries were fixed in 4% paraformaldehyde in PBS at 4°C overnight, dehydrated through a sucrose gradient, embedded, and cryosectioned at 10 μm increments. After preincubating with 5% normal donkey serum in PBS for 1 hour, the sections were then incubated with either anti-FOXL2 (1:500, a gift from Dr. Dagmar Wilhelm, Monash University, Australia), anti-PECAM-1 (1:500, BD Biosciences, USA), anti-3βHSD (1:500, CosmoBio Co.Ltd, Japan), anti-β-galactosidase (1:1000, Abcam, USA), anti-TRA98 (1:1000, MBL international, USA), or anti-WT1 (1:300, Abcam, USA) primary antibodies in PBS-Triton X-100 solution with 5% normal donkey serum at 4°C overnight. The sections were then washed and incubated in the appropriate secondary antibody (1:500; Invitrogen, USA) before mounting in Vector Mount with DAPI (Vector Labs). For paraffin-embedded tissues, the sections were dewaxed and rehydrated in a series of alcohol to PBS. The slides were pretreated in 0.1 mM citric acid for 20 min in the microwave, incubated with anti-αSMA (1:500, Abcam, USA) and anti-CYP17A1 (1:100, Santa Cruz, USA). Slides were imaged under a Leica DMI4000 confocal microscope.For histological analysis, the samples were fixed in 4% paraformaldehyde in PBS at 4°C overnight, dehydrated through an ethanol gradient, and embedded in paraffin wax. Sections were stained with hematoxylin/eosin or PAS/ hematoxylin, and were scanned using Aperio ScanScope XT Scanner (Aperio Technologies, Inc., CA, USA) for digital image analysis.
LacZ staining
The LacZ staining solution was made by dissolving X-gal (Invitrogen, CA) into Dimethylformamide to make 40mg/ml stock solution. The working solution was further prepared by diluting the stock solution to 1mg/ml in pre-warmed tissue stain base solution (Chemicon, MA) 37. Fresh tissues were stained in the LacZ staining solution at 37°C for 2-3 hours followed by fixation in 4% paraformaldehyde/PBS at 4°C overnight. For further histological analysis, samples after LacZ staining were embedded in paraffin following the sectioning procedure listed above. The sections were counterstained with Fast Red (Sigma).
Gene expression analysis
Total RNA was isolated from ovaries using the PicoPure RNA isolation kit (Arcturus, Mountain View, CA) according to the manufacturer’s protocol. The cDNA preparation was synthesized using random hexamers and the Superscript II cDNA synthesis system (Invitrogen Corp., Carlsbad, CA) following the manufacturer’s instruction. Gene expression was analyzed by real-time PCR using Bio-Rad CFX96™ Real-Time PCR Detection system. Taqman gene-expression probes (Gli1: Mm00494654_m1, Ptch1: Mm00436026_m1, Ihh: Mm00439613_m1, Shh: Mm00436528_m1, Dhh: Mm01310203_m1, Foxl2: Mm00843544_m1, Star: Mm00441558_m1, Cyp11a1: Mm00490735_m1, Cyp17a1: Mm00484040_m1, Lhcgr: Mm00442931_m1, Hsd3b1: Mm01261921_mH, Gdf9: Mm00433565_m1, Nr5a1: Hs01018738_m1, Cyp19a1: Mm00484049_m1) were used to detect the fold changes of the transcripts. Fold changes in gene expression were determined by quantitation of cDNA from target (treated) samples relative to a calibrator sample (control). All real-time PCR analyses were performed in duplicate, and the results were reported from at least three independent experiments. The relative fold change of transcript was calculated using the mathematical model of Pfaffl 38 and was normalized to 18S rRNA (Mm03928990_g1), Gapdh (Mm99999915_g1) or Gata4 (Mm00484689_m1) as an endogenous reference.
Microarray analysis
Gene expression analysis was conducted using Affymetrix Mouse Genome 430 2.0 GeneChip® arrays (Affymetrix, Santa Clara, CA). Four microliters of total RNA (due to varying concentrations among samples) was amplified as directed in the WT-Ovation Pico RNA Amplification System protocol, and labeling with biotin following the Encore Biotin Module. 4.6 μg of amplified biotin-aRNAs were fragmented and hybridized to each array for 18 hours at 45°C in a rotating hybridization. Array slides were stained with streptavidin/phycoerythrin utilizing a double-antibody staining procedure and then washed for antibody amplification according to the GeneChip Hybridization, Wash and Stain Kit and user manual following protocol FS450-0004. Arrays were scanned in an Affymetrix Scanner 3000 and data was obtained using the GeneChip® Command Console Software (AGCC; Version 1.1). The microarray raw data were analyzed using the Partek Genomic Suite Software (St. Louis, Missouri). Two-way Anova was performed to determine the statistical significance between the means. The gene list was filtered with fold-change cutoff of 1.4 and an unadjusted p<0.05. Microarray data have been deposited in GEO under accession code GSE66104.
Organ culture
Ovaries from E18.5 embryos (Fig. 4a-c, Fig. 7a&c and Supplementary Fig. 10) were cultured for 3 days on Millicell-PC membrane inserts (0.4 μm pore size; 30 mm diameter; Millipore corp., Medford, MA) with medium filling only the lower chamber 39. 8-10 ovaries were placed on each membrane, with one drop of medium on each ovary. For culture with the Hh inhibitor, cyclopamine 23 (25 μM, Sigma) was added to the ovary culture at the beginning of the culture for 3 days. For culture with GDF9 recombinant protein 40, the protein (60 ng/ml) was added to the ovary culture at the last day of culture 24 hours prior to the collection.The medium for organ culture was DMEM/F12 (1:1) + L-Glutamine + 15mM HEPES (Invitrogen) supplemented with 50 μg/ml penicillin G/streptomycin sulfate, and 5% (vol/vol) fetal bovine serum (FBS). The culture medium was refreshed every other day, and after 3 days of culture, the ovaries were harvested for RNA isolation for qPCR analysis, or were fixed in 4% paraformaldehyde/PBS for histological analysis as described above.
Steroid Hormone Multiplex Immunoassay
Mice were not staged for estrus cycle at the time of sample collection. Serum samples were collected at various times, aliquoted and stored at −80°C until analyzed. Serum samples were assayed for DHEA, Estradiol, Progesterone, and Testosterone using the Steroid Hormone Panel kit (cat # N45CB-1) from MSD (Meso Scale Discovery, Gaithersburg, Maryland, USA) according to manufacturer’s protocols. The Steroid Hormone Panel utilizes a competitive immunoassay format. Briefly, a 96 well custom designed plate that had been precoated with capture antibodies on spatially distinct spots was blocked with blocking solution for 1 hr. at room temperature with constant shaking at 700 rpm. After washing 3x with PBS-T buffer, samples and standards were added to appropriate wells of the MSD plate and incubated for 2 hrs at RT with constant shaking. After incubation of the samples, a mixture of MSD SULFOTAG™ labeled tracers are added to each well. The tracers compete with analytes in the samples for binding on the immobilized antibodies generating a signal for each assay this is inversely proportional to the analyte concentration. After incubating with the tracers, the plate was washed again 3x with PBS-T, pat dried, and 150 μl of 1x Read Buffer was added to each well. The plate was immediately analyzed on the Sector Imager 2400 System (MSD). The instrument measures intensity of emitted light to afford a quantitative measure of DHEA, Estradiol, Progesterone, and Testosterone in the sample. Testosterone standard is not supplied with the MSD kit, it was purchased separately from Steraloids (cat # A6950) (Newport, RI, USA) and used in the range from 16 ng/mL to 0.1 ng/mL. All the samples were run on the same plate. The intra-array %CV (n=7) is 3.99 for DHEA, 7.63 for testosterone and 13.32 for progesterone.
Statistical analysis
Data were analyzed using Prism (Version 6, GraphPad Software) by two-tailed Student’s t-test. Values are presented as mean±s.e.m. A minimal of 3 biological replicates was used for each experiment.
Supplementary Material
Acknowledgments
We thank Dr. Keith Parker (UT Southwestern Medical Center) for the Sf1-Cre mice, Dr. Francesco DeMayo (Baylor College of Medicine) for the Ihh floxed/floxed mouse strain, and Dr. Dagmar Wilhelm (Monash University) for the anti-FOXL2 antibody. We thank the Comparative Medicine Branch, the Flow Cytometry Center, the Cellular & Molecular Pathology Branch (the Digital Imaging/Analysis Lab, the Clinical Pathology Lab and the Pathology Support Group), and the Molecular Genomics Core at NIEHS for the technical support. We also thank Dr. Mitch Eddy, Dr. Kenneth Korach and other lab members for their critical comments on the manuscript. This research was supported by the Intramural Research Program (ES102965) to H.H-C.Y of the NIH, National Institute of Environmental Health Sciences and NIH Graduate Partnerships Program and the Eunice Kennedy Shriver National Institute of Child Health and Human Development (R01 HD033438 to M.M.M.).
Footnotes
Competing Financial Interest Statement
The authors declare no competing financial interests.
Accession Codes
Microarray data have been deposited in GEO under accession code GSE66104.
References
- 1.Matzuk MM, Lamb DJ. The biology of infertility: research advances and clinical challenges. Nat Med. 2008;14:1197–1213. doi: 10.1038/nm.f.1895. doi:10.1038/nm.f.1895. [DOI] [PMC free article] [PubMed] [Google Scholar]
- 2.Edson MA, Nagaraja AK, Matzuk MM. The mammalian ovary from genesis to revelation. Endocr Rev. 2009;30:624–712. doi: 10.1210/er.2009-0012. doi:10.1210/er.2009-0012. [DOI] [PMC free article] [PubMed] [Google Scholar]
- 3.Hirshfield AN. Development of follicles in the mammalian ovary. Int Rev Cytol. 1991;124:43–101. doi: 10.1016/s0074-7696(08)61524-7. [DOI] [PubMed] [Google Scholar]
- 4.Nilsson E, Skinner MK. Cellular Interactions That Control Primordial Follicle Development and Folliculogenesis. Journal of the Society for Gynecologic Investigation. 2001;8:S17–S20. doi: 10.1016/s1071-5576(00)00099-x. doi:10.1177/107155760100800106. [DOI] [PubMed] [Google Scholar]
- 5.Roberts AJ, Skinner MK. Mesenchymal-epithelial cell interactions in the ovary: estrogen-induced theca cell steroidogenesis. Mol Cell Endocrinol. 1990;72:R1–5. doi: 10.1016/0303-7207(90)90242-z. [DOI] [PubMed] [Google Scholar]
- 6.Magoffin DA. The ovarian androgen-producing cells: a 2001 perspective. Rev Endocr Metab Disord. 2002;3:47–53. doi: 10.1023/a:1012700802220. [DOI] [PubMed] [Google Scholar]
- 7.Shiina Premature ovarian failure in androgen receptor-deficient mice. et al. Proc Natl Acad Sci U S A. 2006;103:224–229. doi: 10.1073/pnas.0506736102. doi:0506736102 [pii]10.1073/pnas.0506736102. [DOI] [PMC free article] [PubMed] [Google Scholar]
- 8.Wang PH, Chang C. Androgens and ovarian cancers. Eur J Gynaecol Oncol. 2004;25:157–163. [PubMed] [Google Scholar]
- 9.Erickson GF, Magoffin DA, Dyer CA, Hofeditz C. The ovarian androgen producing cells: a review of structure/function relationships. Endocr Rev. 1985;6:371–399. doi: 10.1210/edrv-6-3-371. [DOI] [PubMed] [Google Scholar]
- 10.Quattropani SL. Morphogenesis of the ovarian interstitial tissue in the neonatal mouse. The Anatomical record. 1973;177:569–583. doi: 10.1002/ar.1091770410. doi:10.1002/ar.1091770410. [DOI] [PubMed] [Google Scholar]
- 11.Peters H, Pedersen T. Origin of follicle cells in the infant mouse ovary. Fertil Steril. 1967;18:309–313. doi: 10.1016/s0015-0282(16)36303-8. [DOI] [PubMed] [Google Scholar]
- 12.Hirshfield A. Theca cells may be present at the outset of follicular growth. Biology of reproduction. 1991;44:1157–1162. doi: 10.1095/biolreprod44.6.1157. [DOI] [PubMed] [Google Scholar]
- 13.Young JM, McNeilly AS. Theca: the forgotten cell of the ovarian follicle. Reproduction. 2010;140:489–504. doi: 10.1530/REP-10-0094. doi:REP-10-0094 [pii]10.1530/REP-10-0094. [DOI] [PubMed] [Google Scholar]
- 14.Honda A, et al. Isolation, characterization, and in vitro and in vivo differentiation of putative thecal stem cells. P Natl Acad Sci USA. 2007;104:12389–12394. doi: 10.1073/pnas.0703787104. doi:10.1073/pnas.0703787104 . [DOI] [PMC free article] [PubMed] [Google Scholar]
- 15.Liu CF, Liu C, Yao HH. Building pathways for ovary organogenesis in the mouse embryo. Curr Top Dev Biol. 2010;90:263–290. doi: 10.1016/S0070-2153(10)90007-0. doi:S0070-2153(10)90007-0 [pii]10.1016/S0070-2153(10)90007-0. [DOI] [PMC free article] [PubMed] [Google Scholar]
- 16.Varjosalo M, Taipale J. Hedgehog: functions and mechanisms. Genes Dev. 2008;22:2454–2472. doi: 10.1101/gad.1693608. doi:22/18/2454 [pii]10.1101/gad.1693608. [DOI] [PubMed] [Google Scholar]
- 17.Wijgerde M, Ooms M, Hoogerbrugge JW, Grootegoed JA. Hedgehog signaling in mouse ovary: Indian hedgehog and desert hedgehog from granulosa cells induce target gene expression in developing theca cells. Endocrinology. 2005;146:3558–3566. doi: 10.1210/en.2005-0311. doi:en.2005-0311 [pii]10.1210/en.2005-0311. [DOI] [PubMed] [Google Scholar]
- 18.Liu C, Paczkowski M, Othman M, Yao HHC. Investigating the Origins of Somatic Cell Populations in the Perinatal Mouse Ovaries Using Genetic Lineage Tracing and Immunohistochemistry. Germline Development: Methods and Protocols. 2012;825:211–221. doi: 10.1007/978-1-61779-436-0_16. doi:Doi 10.1007/978-1-61779-436-0_16. [DOI] [PMC free article] [PubMed] [Google Scholar]
- 19.Barsoum I, Yao HH. Redundant and differential roles of transcription factors Gli1 and Gli2 in the development of mouse fetal Leydig cells. Biol Reprod. 2011;84:894–899. doi: 10.1095/biolreprod.110.088997. doi:10.1095/biolreprod.110.088997. [DOI] [PMC free article] [PubMed] [Google Scholar]
- 20.Gillman J. The development of the gonads in man, with a consideration of the role of fetal endocrines and the histogenesis of ovarian tumors. 1948.
- 21.Armstrong JF, Pritchard-Jones K, Bickmore WA, Hastie ND, Bard JB. The expression of the Wilms' tumour gene, WT1, in the developing mammalian embryo. Mech Dev. 1993;40:85–97. doi: 10.1016/0925-4773(93)90090-k. [DOI] [PubMed] [Google Scholar]
- 22.Kreidberg JA, et al. WT-1 is required for early kidney development. Cell. 1993;74:679–691. doi: 10.1016/0092-8674(93)90515-r. doi:0092-8674(93)90515-R [pii] [DOI] [PubMed] [Google Scholar]
- 23.Taipale J, et al. Effects of oncogenic mutations in Smoothened and Patched can be reversed by cyclopamine. Nature. 2000;406:1005–1009. doi: 10.1038/35023008. doi:10.1038/35023008. [DOI] [PubMed] [Google Scholar]
- 24.Bitgood MJ, Shen L, McMahon AP. Sertoli cell signaling by Desert hedgehog regulates the male germline. Curr Biol. 1996;6:298–304. doi: 10.1016/s0960-9822(02)00480-3. [DOI] [PubMed] [Google Scholar]
- 25.St-Jacques B, Hammerschmidt M, McMahon AP. Indian hedgehog signaling regulates proliferation and differentiation of chondrocytes and is essential for bone formation. Genes Dev. 1999;13:2072–2086. doi: 10.1101/gad.13.16.2072. [DOI] [PMC free article] [PubMed] [Google Scholar]
- 26.Bingham NC, Verma-Kurvari S, Parada LF, Parker KL. Development of a steroidogenic factor 1/Cre transgenic mouse line. Genesis. 2006;44:419–424. doi: 10.1002/dvg.20231. doi:10.1002/dvg.20231. [DOI] [PubMed] [Google Scholar]
- 27.Ingham PW, McMahon AP. Hedgehog signaling in animal development: paradigms and principles. Genes Dev. 2001;15:3059–3087. doi: 10.1101/gad.938601. doi:10.1101/gad.938601. [DOI] [PubMed] [Google Scholar]
- 28.Ren Y, Cowan RG, Harman RM, Quirk SM. Dominant activation of the hedgehog signaling pathway in the ovary alters theca development and prevents ovulation. Mol Endocrinol. 2009;23:711–723. doi: 10.1210/me.2008-0391. doi:me.2008-0391 [pii]10.1210/me.2008-0391. [DOI] [PMC free article] [PubMed] [Google Scholar]
- 29.McLaren A. Development of the mammalian gonad: the fate of the supporting cell lineage. Bioessays. 1991;13:151–156. doi: 10.1002/bies.950130402. doi:10.1002/bies.950130402 . [DOI] [PubMed] [Google Scholar]
- 30.Bucci LR, Meistrich ML. Effects of busulfan on murine spermatogenesis: cytotoxicity, sterility, sperm abnormalities, and dominant lethal mutations. Mutat Res. 1987;176:259–268. doi: 10.1016/0027-5107(87)90057-1. [DOI] [PubMed] [Google Scholar]
- 31.Hemsworth BN, Jackson1 H. Effect of 'busulphan' on the foetal gonad. Nature. 1962;195:816–817. doi: 10.1038/195816a0. [DOI] [PubMed] [Google Scholar]
- 32.Dong J, et al. Growth differentiation factor-9 is required during early ovarian folliculogenesis. Nature. 1996;383:531–535. doi: 10.1038/383531a0. doi:10.1038/383531a0. [DOI] [PubMed] [Google Scholar]
- 33.Zheng W, et al. Two classes of ovarian primordial follicles exhibit distinct developmental dynamics and physiological functions. Human molecular genetics. 2013 doi: 10.1093/hmg/ddt486. doi:10.1093/hmg/ddt486. [DOI] [PMC free article] [PubMed] [Google Scholar]
- 34.Mork L, et al. Temporal differences in granulosa cell specification in the ovary reflect distinct follicle fates in mice. Biol Reprod. 2012;86:37. doi: 10.1095/biolreprod.111.095208. doi:10.1095/biolreprod.111.095208. [DOI] [PMC free article] [PubMed] [Google Scholar]
- 35.McAllister JM, et al. Overexpression of a DENND1A isoform produces a polycystic ovary syndrome theca phenotype. Proc Natl Acad Sci U S A. 2014;111:E1519–1527. doi: 10.1073/pnas.1400574111. doi:10.1073/pnas.1400574111. [DOI] [PMC free article] [PubMed] [Google Scholar]
- 36.Husebye ES, Lovas K. Immunology of Addison's disease and premature ovarian failure. Endocrinol Metab Clin North Am. 2009;38:389–405. doi: 10.1016/j.ecl.2009.01.010. ix, doi:10.1016/j.ecl.2009.01.010. [DOI] [PubMed] [Google Scholar]
- 37.Franco HL, et al. Constitutive activation of smoothened leads to female infertility and altered uterine differentiation in the mouse. Biology of reproduction. 2010;82:991–999. doi: 10.1095/biolreprod.109.081513. doi:10.1095/biolreprod.109.081513. [DOI] [PMC free article] [PubMed] [Google Scholar]
- 38.Pfaffl MW. A new mathematical model for relative quantification in real-time RT-PCR. Nucleic Acids Res. 2001;29:e45. doi: 10.1093/nar/29.9.e45. [DOI] [PMC free article] [PubMed] [Google Scholar]
- 39.O'Brien MJ, Pendola JK, Eppig JJ. A revised protocol for in vitro development of mouse oocytes from primordial follicles dramatically improves their developmental competence. Biology of reproduction. 2003;68:1682–1686. doi: 10.1095/biolreprod.102.013029. doi:10.1095/biolreprod.102.013029. [DOI] [PubMed] [Google Scholar]
- 40.Peng J, et al. Growth differentiation factor 9:bone morphogenetic protein 15 heterodimers are potent regulators of ovarian functions. Proc Natl Acad Sci U S A. 2013;110:E776–785. doi: 10.1073/pnas.1218020110. doi:10.1073/pnas.1218020110. [DOI] [PMC free article] [PubMed] [Google Scholar]
Associated Data
This section collects any data citations, data availability statements, or supplementary materials included in this article.


