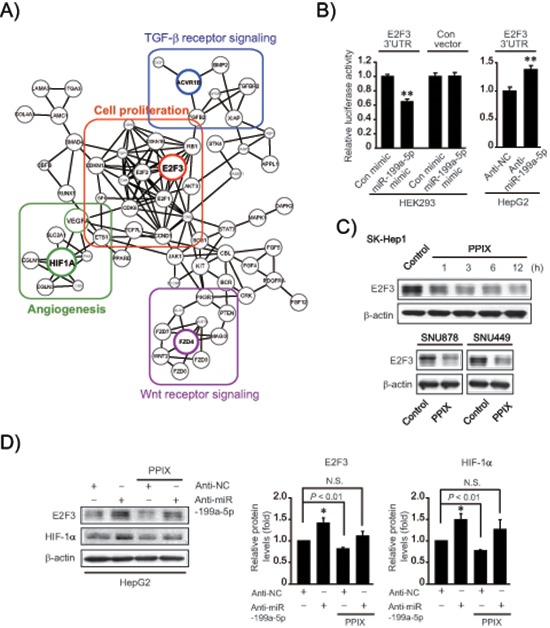
Figure 3. Inhibition of de novo synthesis of E2F3 by either miR-199a-5p or PPIX treatment.

(A) An integrative network using putative targets of miR-199a-5p, -519d, and -20b affected by PPIX. Sub-networks were grouped and each subset core gene was bordered and colored. (B) E2F3 3′-UTR luciferase assays. Indicated cells were transfected with control mimic (or anti-NC) or miR-199a-5p mimic (or anti-miR-199a-5p) in combination with E2F3 3′-UTR reporter construct. (C) Inhibition of E2F3 expression by PPIX treatment. Immunoblottings were done on the lysates of SK-Hep1 cells treated with 3 μM PPIX for the indicated times (upper). SNU878 or SNU449 cells were incubated with 3 μM PPIX for 3 h (lower). (D) The effect of anti-miR-199a-5p transfection on E2F3 and HIF-1α expression. HepG2 cells were treated with 3 μM PPIX for 3 h after transfection with anti-NC (control) or anti-miR-199a-5p for 72 h (left). The band intensities of E2F3 or HIF-1α relative to β-actin were quantified by scanning densitometry of the immunoblots (right). The data represent the mean ± S.E. from 3 different independent experiments (significantly different from vehicle-treated control, *P < 0.05; N.S., not significant).
