This study developed a new model for evaluating an induced pluripotent stem cell (iPSC) haplobank based on demographic and immunogenetic characteristics reflecting California. Creation of a haplobank of iPSC lines homozygous for a variety of human leukocyte antigen (HLA) types, representative of different geographic populations and ethnic groups, could simplify HLA matching and provide matches for reasonable percentages of target populations and extend iPSC-derived therapies beyond the autologous setting.
Summary
The development of a California-based induced pluripotent stem cell (iPSC) bank based on human leukocyte antigen (HLA) haplotype matching represents a significant challenge and a valuable opportunity for the advancement of regenerative medicine. However, previously published models of iPSC banks have neither addressed the admixed nature of populations like that of California nor evaluated the benefit to the population as a whole. We developed a new model for evaluating an iPSC haplobank based on demographic and immunogenetic characteristics reflecting California. The model evaluates haplolines or cell lines from donors homozygous for a single HLA-A, HLA-B, HLA-DRB1 haplotype. We generated estimates of the percentage of the population matched under various combinations of haplolines derived from six ancestries (black/African American, American Indian, Asian/Pacific Islander, Hispanic, and white/not Hispanic) and data available from the U.S. Census Bureau, the California Institute for Regenerative Medicine, and the National Marrow Donor Program. The model included both cis (haplotype-level) and trans (genotype-level) matching between a modeled iPSC haplobank and the recipient population following resampling simulations. We showed that serving a majority (>50%) of a simulated California population through cis matching would require the creation, redundant storage, and maintenance of almost 207 different haplolines representing the top 60 most frequent haplotypes from each ancestry group. Allowances for trans matching reduced the haplobank to fewer than 141 haplolines found among the top 40 most frequent haplotypes. Finally, we showed that a model optimized, custom haplobank was able to serve a majority of the California population with fewer than 80 haplolines.
Significance
Induced pluripotent stem cell (iPSC) technology offers the promise of cellular therapies for a wide variety of diseases and injuries. Should these clinical trials be successful, it will be necessary to consider what it would take to deliver these novel treatments to the large numbers of patients who will need them. The use of allogeneic iPSC cell lines for derivation of grafts for transplantation has been considered; however, in order to avoid graft rejection by the allogeneic host, immunological compatibility between graft and host need to be considered. Creation of a haplobank of iPSC lines homozygous for a variety of HLA types, representative of different geographic populations and ethnic groups, could simplify HLA matching and provide matches for reasonable percentages of target populations and extend iPSC-derived therapies beyond the autologous setting. To that end, the rationale for the current study was that the genetic diversity of California’s population might be a considerable advantage in establishing a representative “world bank” compared with banking from countries in which populations have more uniform ancestry.
Introduction
The perpetual renewal of pluripotent stem cell (PSC) lines makes them attractive sources for potential cell-based therapies. Among PSCs, induced pluripotent stem cells (iPSCs) offer the added advantage of selectable discrete genetic characteristics from adult donors [1, 2]. Although autologous personalized cell therapies using iPSCs are discussed frequently and are currently undergoing testing in at least one human clinical trial [3], they remain too time-consuming, technically difficult, and economically costly to represent reasonable therapeutic options for many patient populations. A tractable alternative would be the establishment of banks of iPSCs specifically selected to reduce immune system rejection [4–6].
The definition of an optimal level of genetic similarity between the cell line (i.e., the donor) and the recipient (i.e., the patient) remains challenging, and years of successful organ and hematopoietic stem cell transplantations have established the central role of human leukocyte antigen (HLA) genes. Matching for all HLA loci could result in nearly personalized iPSCs; however, it would be prohibitively expensive and technically challenging because of the large number of cell lines required. Taylor et al. proposed using cells from individuals who are homozygous for a subset of HLA genes as a way to decrease those numbers [6]. This suggestion was further expanded to a repository or a bank (haplobank) composed of iPSCs, each homozygous for a given HLA haplotype (haploline) [7].
Neither study addressed the multiethnic nature of both the supply and demand populations or considered alternative HLA gene-matching schemes (cis and trans) in the major histocompatibility complex region. We developed a model for evaluating a haplobank that integrates multiple ancestries in both supply and demand and uses alternative matching schemes in evaluating the benefit. We simulated a high-quality haplobank of human iPSC haplolines that are homozygous for a single HLA-A∼B∼DRB1 haplotype. Virtual haplobanks were generated using publically available HLA haplotype frequencies, and each haploline within the haplobank was assessed for its ability to provide matches against a representative California population. Finally, using model, optimized haplobanks, we demonstrated that a majority of the California population could be served using a minimal number of haplolines.
Materials and Methods
Simulating Supply and Demand
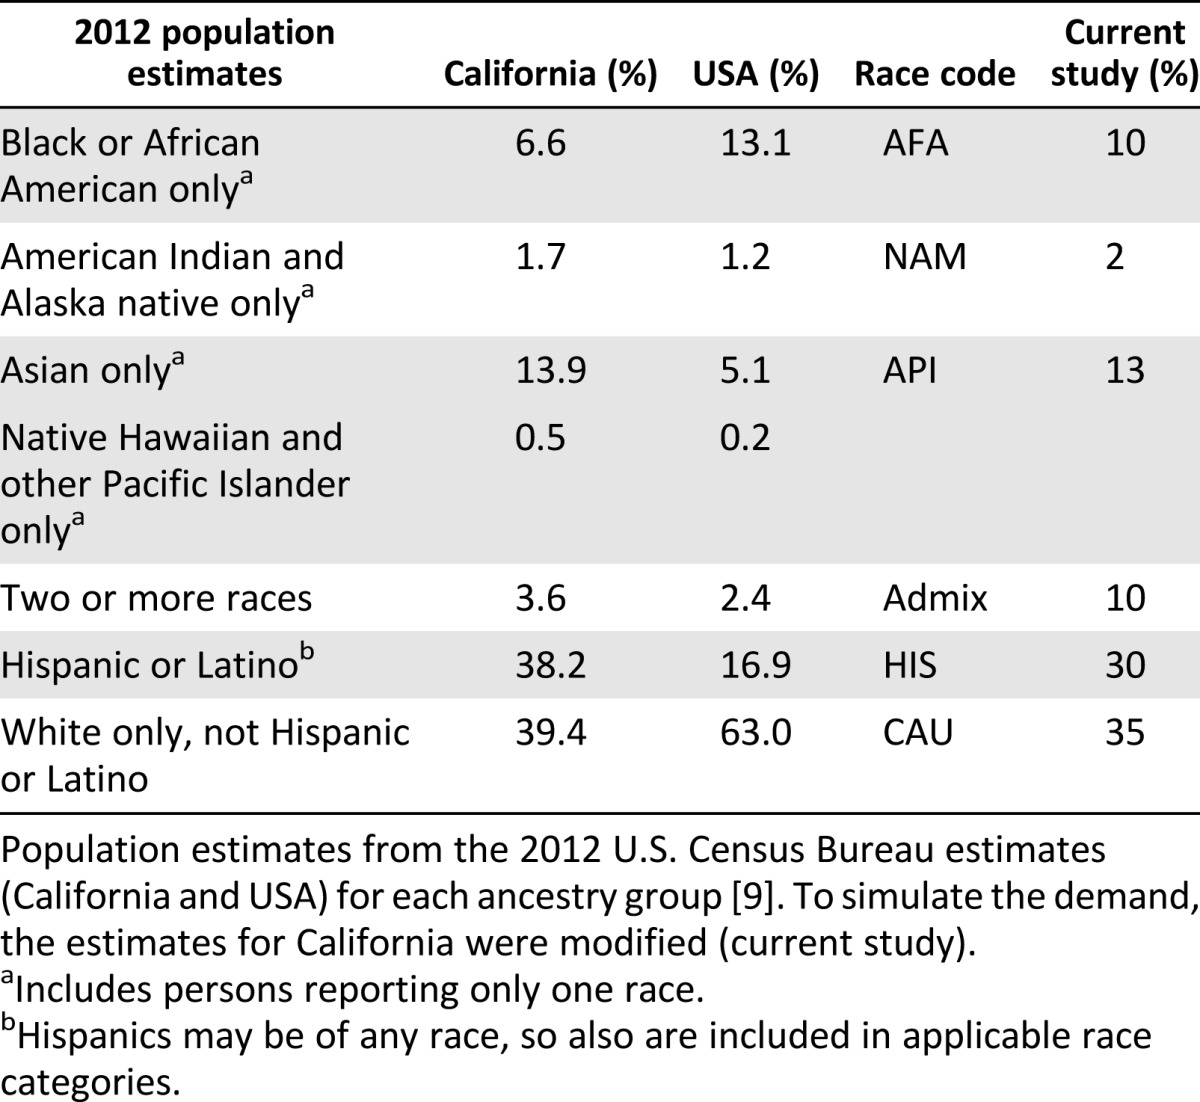
HLA haplotype frequencies for simulation were published by the National Marrow Donor Program (NMDP) [8]. Ancestry representation within the simulated population was adapted from the 2012 U.S. Census Bureau estimates for California [9] and from data provided by the California Institute of Regenerative Medicine (S. Talib) (Table 1). The haplobank and population included the following broad ancestry categories (in decreasing order of representation): white (non-Hispanic; CAU), Hispanic (HIS), Asian and Pacific Islanders (API), American Indian and Alaska native (NAM), and black or African American (AFA). Haplobanks were assembled by combining the top 20, 40, 60, 80, and 100 HLA-A∼B∼DRB1 haplotypes (haplolines) from each ancestry and filtered for nonredundant haplotypes. Populations of 10,000 diploid individuals were simulated by repeated random sampling of the NMDP haplotype frequencies using a random uniform number generator for indexing the cumulative sum of the haplotype frequencies [10, 11]. To account for interracial marriages, the simulation included random admixture among four of the subgroups (Admix; AFA, API, HIS, and CAU), as outlined in Table 1. Hardy Weinberg proportion is assumed otherwise.
Table 1.
Ancestry proportions used for population simulation
Calculating the Match Benefit
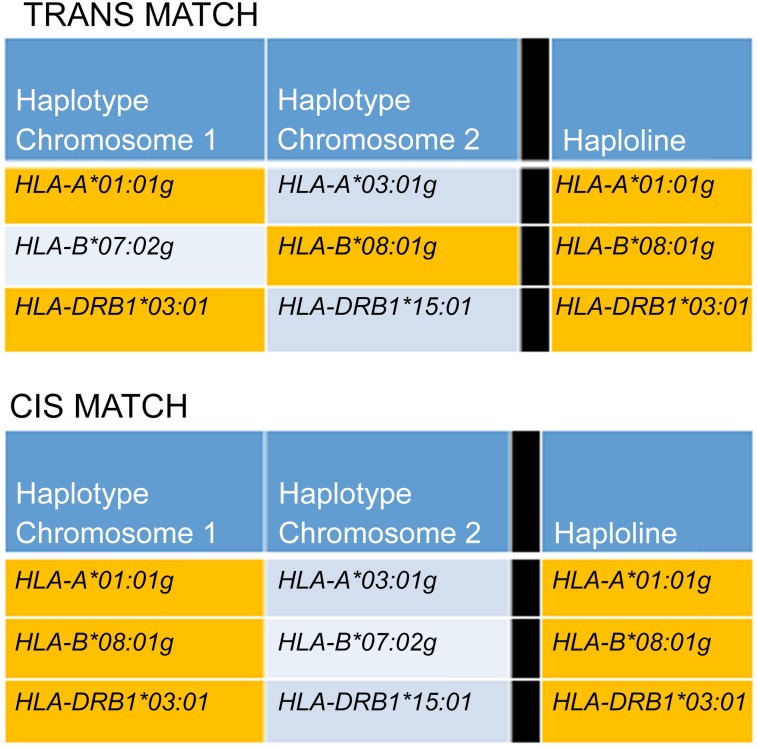
The matching benefit was measured by counting the occurrence of matching haplotypes between the haplolines in the haplobank and the individuals in the population. The model considered two types of matching: cis (haplotype level) and trans (genotype level) (Fig. 1). The matching types were differentiated by the phase of the loci within the haplotype. Consequently, for cis-level matching, all loci were in phase (i.e., located on the same chromosome) to be considered a match. For trans-level matching, the phase was disregarded, and the complete overlap of loci between the haploline and individual was necessary to be considered a match. Trans matching was inclusive, and any cis match would also be considered a trans match. In both cases, the model assumes that matching is achieved when at least one haplotype (cis) or all loci (trans) were shared between the haploline and the recipient.
Figure 1.
Matching schemes for evaluation of the benefit. The two matching schemes vary only in the loci phase being matched against. Matching loci are indicated by orange shading. For cis matching (bottom), all loci were in phase (present on a single chromosome) for a haploline match to be counted. For trans matching (top), the loci were not required to be in phase (present on either chromosome) for a match to be counted.
Parameters Measured and Simulations
The parameters measured for both cis and trans matches included the number of matches (Ki) expressed as a count or percentage of the total subjects for the ith haplotype. For cis matches, the per-haplotype expected match (fexp) was calculated as described previously [7]. First, the expected match for the ith haplotype in each ancestry was calculated using the following formula: fi = fi2 + 2fi (1 − fi). Second, expected matches from each of the five ancestries were weighted and summed according to the following formula, where p represents the proportion of the total population represented by the respective ancestry: fexp = pfiAFA + pfiAPI + pfiCAU + pfiHIS + pfiNAM. Simulations were run 100 times to generate confidence intervals for all parameters measured. All analyses were carried out in R, a free software environment for statistical computing and graphics (R Foundation, Vienna, Austria, http://www.r-project.org).
Results
Simulated Haplolines and Haplobanks
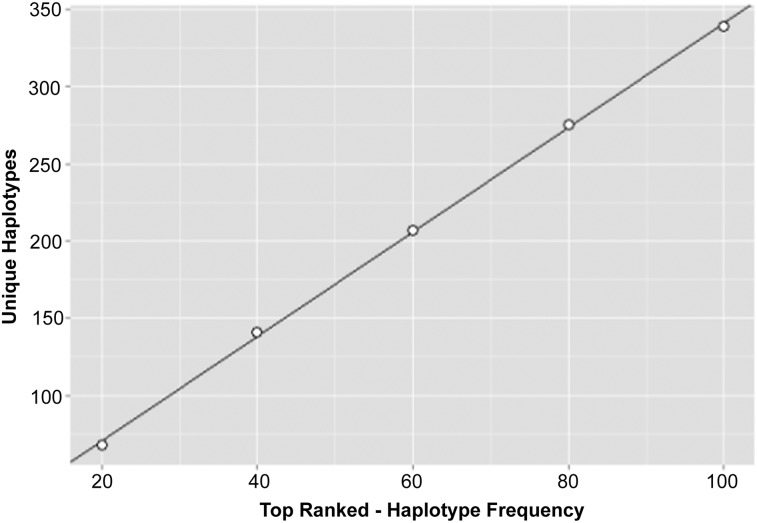
Haplobanks were assembled by choosing the top 20, 40, 60, 80 or 100 most frequent haplotypes from each ancestry. Redundant haplotypes were removed, and unique haplotypes were used as haplolines for the bank. There was a linear relationship between the number of haplolines per haplobank and the number of haplotypes pulled per ancestry (Fig. 2). However, the number of haplolines in the bank was not additive with respect to the number of haplotypes per ancestry chosen, such that the top 100 haplotypes from 5 ancestries resulted in 339 unique HLA-A∼B∼DRB1 haplolines rather than 500.
Figure 2.
Unique haplotypes per haplobank. The top 20, 40, 60, 80, or 100 haplotypes ranked by frequency (from largest to smallest) were pulled from each ancestry and combined to form haplobanks. Redundant haplotypes were removed, and the resultant number of unique haplotypes in the haplobank was graphed as a function of the number of haplotypes pulled (points). The line indicates linear regression of the points (slope = 3.4, r2 = .99).
Per-Haploline Benefit
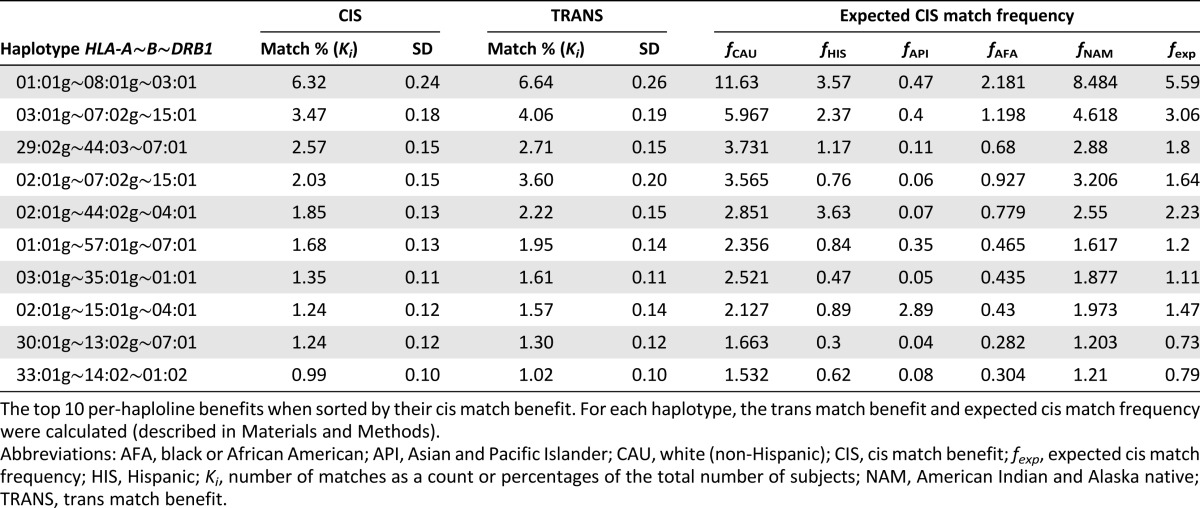
The cis and trans matching benefits (described in the “Methods” section) of the haplolines were calculated relative to each subject in the population to assess each haploline’s match potential. Cis matching restricts all alleles from both the donor and the recipient to a single chromosome (in phase). Trans matching removed the in-phase restriction, treating each allele as if it was on a unique chromosome. Allowing for haploline matching of unphased loci increased the proportion of subjects served by a given haploline. Table 2 outlines the top 10 ranked haplolines relative to their cis benefit. The phased HLA-A∼B∼DRB1 haplotype 01:01g∼08:01g∼03:01, for example, demonstrated the largest benefit, serving 6.32% of the simulation population on average. However, allowing for unphased matching increased the benefit to 6.64%, an increase of 3.2% (3,191 subjects) relative to the population being served.
Table 2.
Top 10 cis and trans matched haplolines
Per-Haplobank Benefit
Although individual haplolines were evaluated for their benefit, the per-haplobank benefit was determined to assess the ability of entire haplobanks to benefit the population as a whole. Consequently, haplolines were not evaluated individually but as part of a group.
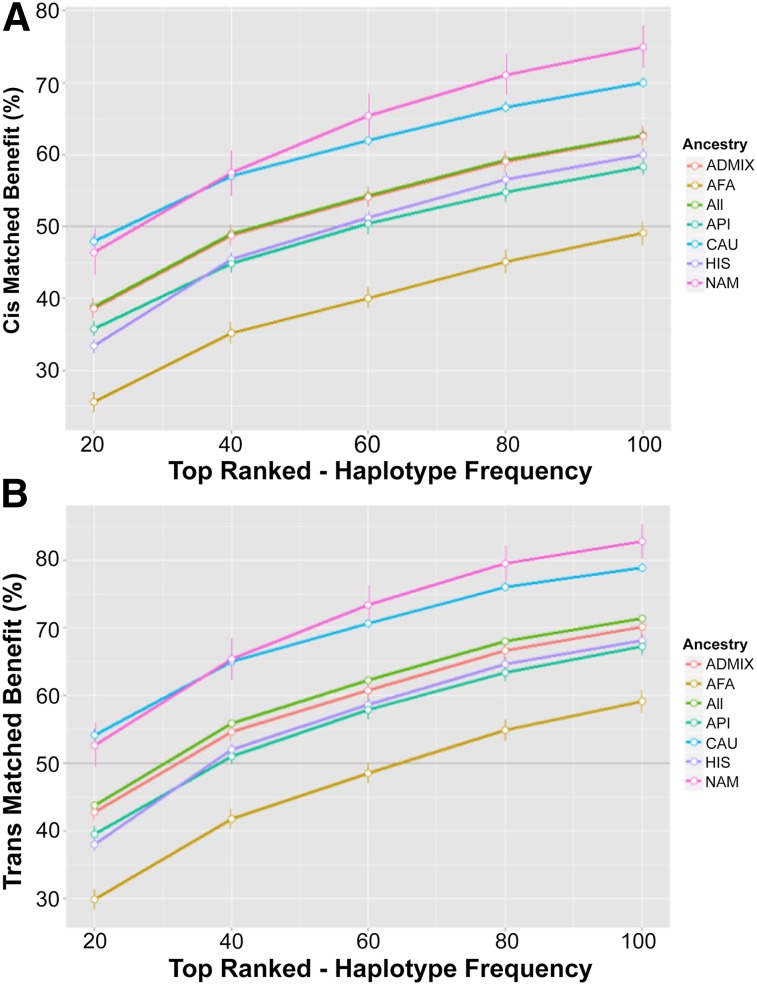
The ability of a haplobank to meet the demand of the simulated population varied depending on the ancestry being served (Fig. 3). The CAU and the NAM groups stood to receive the most benefit from these haplobanks (Fig. 4). Considering only cis matches, a haplobank consisting of the top 20 haplotypes pulled from each of the 5 ancestries would match 48.0% of the CAU group and 46.4% of the NAM group but only 25.6% of the AFA group (Fig. 3A). The overall benefit for the entire population using the same haplobank was 38.8% (Fig. 3A).
Figure 3.
Per-haplobank benefit. The cis (A) or trans (B) average benefit for each haplobank was plotted against the number of haplotypes pulled for each haplobank. Error bars represent the standard deviation from 100 simulations. Dark gray line highlights 50% benefit. Abbreviations: AFA, black or African American; API, Asian and Pacific Islander; CAU, white (non-Hispanic); HIS, Hispanic; NAM, American Indian and Alaska native.
Figure 4.
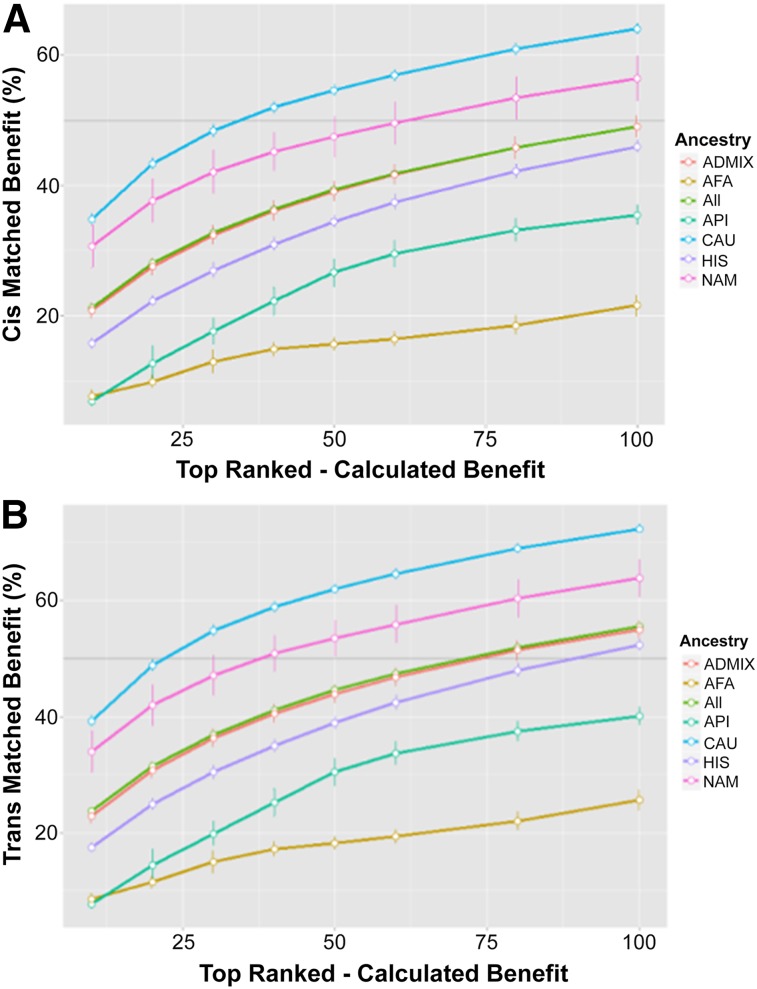
Top-ranked haplolines. Haplolines were ranked according to their individual benefit. The top 10, 20, 30, 40, 50, 60, 80, or 100 haplolines were combined into haplobanks, and the cis (A) and trans (B) benefits were recalculated. The total average benefit was plotted against the number of ranked haplolines in the haplobank. Error bars represent the standard deviation from 100 simulations. Dark gray line highlights 50% benefit. Abbreviations: AFA, black or African American; API, Asian and Pacific Islander; CAU, white (non-Hispanic); HIS, Hispanic; NAM, American Indian and Alaska native.
Allowing for increases in match potential through trans matching, the haplobank benefits increased, meeting the demands of more than 50% of both the CAU and NAM groups in the population with only the top 20 most frequent haplotypes (Fig. 3B). The overall benefit for the population increased to 43.8%. A haplobank assembled from the top 100 haplotypes from each of the 5 ancestries significant increases the ability of the haplobank to serve the population. This bank would serve almost 80% of the CAU group and more than 80% of the NAM group, whereas the overall population benefit would exceed 71%, serving a large majority of the California population.
Highest Ranked Haplobanks
Although a haplobank consisting of the top 100 haplotypes from each of the 5 ancestries might be an attractive option, such a bank would require the collation, maintenance, propagation, and redundant storage of more than 339 different haplolines. Moreover, serving a majority of the California population (>50%) would require a minimum of 207 haplolines through cis matching and 141 haplolines through trans matching, representing the top 60 and 40 haplotypes, respectively, from each ancestry.
Taking advantage of the per-haploline benefit, the highest ranked haplolines were chosen to create custom haplobanks. These custom haplobanks maximize the benefit to the population with a minimal number of cells. Custom haplobanks were assembled from the top 10, 20, 30, 40, 50, 60, 80, and 100 ranked haplolines, and the cis (Fig. 4A) and trans (Fig. 4B) matching benefits were recalculated.
Using only the top-ranked haplolines in the haplobank exceeds the matching performance for the similar number of top haplotypes. The top 100 ranked haplolines, for example, were able to meet the needs of more than 50% of the CAU, NAM, and Admix ancestries, with an overall cis benefit of 49.0% and trans benefit of 55.6%. Consequently, a haplobank could meet the demand of a majority of the California population with fewer than 80 haplolines (Fig. 4B).
Discussion
We applied a probabilistic model using five ancestries and calculations based on the paradigm of cis and trans HLA matching achieved by simulated homozygous iPSC lines derived from donors who are homozygous for HLA-A∼B∼DRB1. We provided a basis for constructing cell banks of fewer than 80 lines that could meet the needs of the majority (>50%) of the California population. The study was designed for the California population, and it is the first study that addresses the multiethnic aspects of the California population, including the admixed potential of recipients. Although this study restricted the population ancestral make-up to best model California, it could be extended to the nation as a whole. Having chosen the top haplotypes from various ancestries available through the National Marrow Donor Program, it is expected that a California bank would also serve a large portion of the U.S. and perhaps other countries.
The study clearly differentiates cis and trans matching and shows that the selection of the “best” haplolines depends primarily on the (compound) frequency of the HLA haplotype in the recipient population, but those contributions to the bank also depend on the intrinsic trans potential of the haplotype and the presence of other haplolines in the bank. Our mathematical model has technical limits, particularly related to the frequencies of HLA haplotypes [12–14]. Being particularly robust for the most frequent haplotypes, the exponentially decreasing distribution of the haplotype frequency is common, whatever the ancestry [15].
High-resolution matching at HLA-A, HLA-B, HLA-C, HLA-DRB1 and HLA-DQB1 is taken as a conservative working hypothesis to minimize rejection. It is an accepted standard of a long-standing, well-studied field of hematopoietic stem cell transplantation in which HLA matching can be a crucial determinant of the success of the cell therapy [16–18]. However, a wealth of literature exists that underscores the limitations of HLA matching in transplantation. Non-HLA genetic and nongenetic determinants are known to confer risk of rejection [15, 18]. Autologous derived stems cells, for example, particularly iPSCs, can also be immunogenic or can stimulate autoimmune reactions [20, 21]. Depending on the circumstance, such as in urgent situations, alternative donors and various levels of compatibility may be warranted [22]. Going forward, integrating a patient’s immunological landscape with the known immunobiology of iPSCs will be the key to ensuring successful application of stem cell therapies in the clinic.
Acknowledgments
We thank Methodomics for technical support. This work was commissioned by the California Institute for Regenerative Medicine.
Author Contributions
D.J.P. and P.-A.G.: conception and design, data collection, data analysis and interpretation, manuscript writing; C.L.G., J.L., A.T., N.D., and S.T.: conception and design, final approval of mansucript.
Disclosure of Potential Conflicts of Interest
The authors indicated no potential conflicts of interest.
References
- 1.Takahashi K, Tanabe K, Ohnuki M, et al. Induction of pluripotent stem cells from adult human fibroblasts by defined factors. Cell. 2007;131:861–872. doi: 10.1016/j.cell.2007.11.019. [DOI] [PubMed] [Google Scholar]
- 2.Takahashi K, Yamanaka S. Induction of pluripotent stem cells from mouse embryonic and adult fibroblast cultures by defined factors. Cell. 2006;126:663–676. doi: 10.1016/j.cell.2006.07.024. [DOI] [PubMed] [Google Scholar]
- 3.Charron D. Allogenicity & immunogenicity in regenerative stem cell therapy. Indian J Med Res. 2013;138:749–754. [PMC free article] [PubMed] [Google Scholar]
- 4.Kiskinis E, Eggan K. Progress toward the clinical application of patient-specific pluripotent stem cells. J Clin Invest. 2010;120:51–59. doi: 10.1172/JCI40553. [DOI] [PMC free article] [PubMed] [Google Scholar]
- 5.Lui KO, Waldmann H, Fairchild PJ. Embryonic stem cells: Overcoming the immunological barriers to cell replacement therapy. Curr Stem Cell Res Ther. 2009;4:70–80. doi: 10.2174/157488809787169093. [DOI] [PubMed] [Google Scholar]
- 6.Taylor CJ, Bolton EM, Pocock S, et al. Banking on human embryonic stem cells: Estimating the number of donor cell lines needed for HLA matching. Lancet. 2005;366:2019–2025. doi: 10.1016/S0140-6736(05)67813-0. [DOI] [PubMed] [Google Scholar]
- 7.Gourraud PA, Gilson L, Girard M, et al. The role of human leukocyte antigen matching in the development of multiethnic “haplobank” of induced pluripotent stem cell lines. Stem Cells. 2012;30:180–186. doi: 10.1002/stem.772. [DOI] [PubMed] [Google Scholar]
- 8.Gragert L, Madbouly A, Freeman J, et al. Six-locus high resolution HLA haplotype frequencies derived from mixed-resolution DNA typing for the entire US donor registry. Hum Immunol. 2013;74:1313–1320. doi: 10.1016/j.humimm.2013.06.025. [DOI] [PubMed] [Google Scholar]
- 9. U.S. Census Bureau. State & County QuickFacts: California. Available at: http://quickfacts.census.gov/qfd/states/06000.html. Accessed April 30, 2014.
- 10.Eberhard HP, Madbouly AS, Gourraud PA, et al. Comparative validation of computer programs for haplotype frequency estimation from donor registry data. Tissue Antigens. 2013;82:93–105. doi: 10.1111/tan.12160. [DOI] [PubMed] [Google Scholar]
- 11.Maiers M, Gragert L, Madbouly A, et al. 16(th) IHIW: Global analysis of registry HLA haplotypes from 20 million individuals: Report from the IHIW Registry Diversity Group. Int J Immunogenet. 2013;40:66–71. doi: 10.1111/iji.12031. [DOI] [PMC free article] [PubMed] [Google Scholar]
- 12.Fallin D, Schork NJ. Accuracy of haplotype frequency estimation for biallelic loci, via the expectation-maximization algorithm for unphased diploid genotype data. Am J Hum Genet. 2000;67:947–959. doi: 10.1086/303069. [DOI] [PMC free article] [PubMed] [Google Scholar]
- 13.Gourraud PA, Génin E, Cambon-Thomsen A. Handling missing values in population data: Consequences for maximum likelihood estimation of haplotype frequencies. Eur J Hum Genet. 2004;12:805–812. doi: 10.1038/sj.ejhg.5201233. [DOI] [PubMed] [Google Scholar]
- 14.Gourraud PA, Lamiraux P, El-Kadhi N, et al. Inferred HLA haplotype information for donors from hematopoietic stem cells donor registries. Hum Immunol. 2005;66:563–570. doi: 10.1016/j.humimm.2005.01.011. [DOI] [PubMed] [Google Scholar]
- 15.Pappas DJ, Tomich A, Garnier F, et al. Comparison of high-resolution human leukocyte antigen haplotype frequencies in different ethnic groups: Consequences of sampling fluctuation and haplotype frequency distribution tail truncation. Hum Immunol. 2015 doi: 10.1016/j.humimm.2015.01.029. [Epub ahead of print] [DOI] [PubMed] [Google Scholar]
- 16.Petersdorf EW. Optimal HLA matching in hematopoietic cell transplantation. Curr Opin Immunol. 2008;20:588–593. doi: 10.1016/j.coi.2008.06.014. [DOI] [PMC free article] [PubMed] [Google Scholar]
- 17.Shaw BE, Arguello R, Garcia-Sepulveda CA, et al. The impact of HLA genotyping on survival following unrelated donor haematopoietic stem cell transplantation. Br J Haematol. 2010;150:251–258. doi: 10.1111/j.1365-2141.2010.08224.x. [DOI] [PubMed] [Google Scholar]
- 18.Warren EH, Zhang XC, Li S, et al. Effect of MHC and non-MHC donor/recipient genetic disparity on the outcome of allogeneic HCT. Blood. 2012;120:2796–2806. doi: 10.1182/blood-2012-04-347286. [DOI] [PMC free article] [PubMed] [Google Scholar]
- 19.Spierings E. Minor histocompatibility antigens: Past, present, and future. Tissue Antigens. 2014;84:347–60. doi: 10.1111/tan.12445. [DOI] [PubMed] [Google Scholar]
- 20.Charron D, Suberbielle-Boissel C, Al-Daccak R. Immunogenicity and allogenicity: A challenge of stem cell therapy. J Cardiovasc Transl Res. 2009;2:130–138. doi: 10.1007/s12265-008-9062-9. [DOI] [PubMed] [Google Scholar]
- 21.Scheiner ZS, Talib S, Feigal EG. The potential for immunogenicity of autologous induced pluripotent stem cell-derived therapies. J Biol Chem. 2014;289:4571–4577. doi: 10.1074/jbc.R113.509588. [DOI] [PMC free article] [PubMed] [Google Scholar]
- 22.Ruggeri A, Ciceri F, Gluckman E, et al. Alternative donors hematopoietic stem cells transplantation for adults with acute myeloid leukemia: Umbilical cord blood or haploidentical donors? Best Pract Res Clin Haematol. 2010;23:207–216. doi: 10.1016/j.beha.2010.06.002. [DOI] [PubMed] [Google Scholar]


