

Abstract
Childhood obesity is an established risk factor for metabolic disease. The influence of obesity on bone development, however, remains controversial, and may depend on the pattern of regional fat deposition. Therefore, we examined the associations of regional fat compartments of the calf and thigh with weight-bearing bone parameters in girls. Data from 444 girls aged 9–12 years from the “Jump-In: Building Better Bones” study were analyzed. Peripheral quantitative computed tomography (pQCT) was used to assess bone parameters at metaphyseal and diaphyseal sites of the femur and tibia along with subcutaneous adipose tissue (SAT, mm2) and muscle density (mg/cm3), an index of skeletal muscle fat content. As expected, SAT was positively correlated with total body fat mass (r = 0.87–0.89, p < 0.001) and muscle density was inversely correlated with total body fat mass (r = −0.24 to −0.28, p < 0.001). Multiple linear regression analyses with SAT, muscle density, muscle cross-sectional area, bone length, maturity, and ethnicity as independent variables showed significant associations between muscle density and indices of bone strength at metaphyseal (β = 0.13–0.19, p < 0.001) and diaphyseal (β = 0.06–0.09, p < 0.01) regions of the femur and tibia. Associations between SAT and indices of bone strength were non-significant at all skeletal sites (β = 0.03–0.05, p > 0.05), except the distal tibia (β = 0.09, p = 0.03). In conclusion, skeletal muscle fat content of the calf and thigh is inversely associated with weight-bearing bone strength in young girls.
Keywords: bone strength, skeletal muscle fat content, muscle quality, female, peripheral quantitative computed tomography (pQCT)
Introduction
Childhood obesity is associated with metabolic complications such as impaired glucose regulation, hypertension, dyslipidemia, fatty liver disease, and systemic low-grade inflammation.(1,2) Whether obesity positively or negatively impacts skeletal development remains unclear. While some studies in children and adolescents have reported a positive relationship between fat and bone,(3–5) recent studies have shown that the bones of obese children are adapted to lean mass, and that excess body mass in the form of fat either had no additional effect or was inversely related to bone parameters.(6–10) Obese children have been shown to have lower volumetric bone mineral density (vBMD, mg/cm3) and geometric parameters relative to their body mass,(9,10) which suggests a mismatch between gains in body mass and appropriate skeletal adaptations during growth. Thus, obesity may contribute to suboptimal bone development and put obese children, who are already overrepresented in childhood fracture cases,(11,12) at greater risk for factures later in life. Given the conflicting findings surrounding the fat-bone link and an expected increase in the prevalence of obesity and osteoporosis,(13) it is imperative to better understand the relationship between fat and bone.
Strong evidence in children and adults suggests a link between the pattern of regional adiposity, particularly visceral abdominal adipose tissue (VAT) and fat within skeletal muscle, and impaired glucose tolerance, insulin resistance, and type 2 diabetes mellitus (T2DM).(14–17) The relationship between these so-called “pathogenic” fat depots and bone, however, is unclear. Studies in adolescent girls and young women have shown that VAT is inversely associated with bone structure and strength.(18,19) Furthermore, studies in older adults have shown that greater fat content within skeletal muscle predicts hip fracture(20,21) and is inversely associated with vBMD of the tibia.(22) In a recent study of the relationship between regional fat deposition and bone in young children, Pollock and colleagues(23) showed that VAT was inversely associated with total body bone mineral content (BMC) in prepubertal boys and girls. Moreover, overweight prepubertal children with prediabetes had lower total body BMC than children without prediabetes.(23) Thus, a negative relationship between bone and pathogenic fat depots such as VAT and fat within skeletal muscle may exist in children as it does in adults. Few studies have tested this proposition, and to our knowledge, no studies have investigated the relationship of skeletal muscle fat content with weight-bearing bone status in youth.
The purpose of this study was to examine the associations of skeletal muscle fat content and subcutaneous adipose tissue (SAT) of the calf and thigh with bone parameters at metaphyseal and diaphyseal regions of the femur and tibia in girls. A unique feature of the study was the use of peripheral quantitative computed tomography (pQCT) to differentiate tissues based on attenuation characteristics, which are directly related to tissue composition and density.(24,25) Controlled studies using chemical phantoms (surrogate “limbs” of known lipid concentration) and tissue biochemical studies using muscle biopsy samples have demonstrated that lower muscle density (mg/cm3), which can be assessed using pQCT, is a valid measure of greater fat content in skeletal muscle.(24,25) pQCT can also assess vBMD and bone geometry, the major determinants of bone strength.(26) Yerges-Armstrong and colleagues(22) used pQCT to assess soft tissue composition of the calf and vBMD of the tibia in older Afro-Caribbean men and reported that SAT was not associated with vBMD, whereas an index of skeletal muscle fat content was inversely associated with vBMD. Based on these observations, we hypothesized that calf and thigh skeletal muscle fat content would be inversely associated with weight-bearing bone parameters, whereas SAT would not be associated with bone parameters in young girls.
Methods
Participants
Cross-sectional data were analyzed for 444 healthy girls, aged 9–12 years, who were participants in the “Jump-In: Building Better Bones” study.(10,27) Girls who were in school grade 4 or 6 were recruited from 14 elementary and 4 middle schools around Tucson, Arizona. Exclusion criteria included learning disabilities (identified by schools) that made it impossible to complete questionnaires or otherwise unable to comply with assessment protocols; medications known to affect bone, medical conditions, or a disability that limited participation in physical exercise as defined by the Committee on Sports Medicine and Fitness;(28) excluded (or excused) from participation in physical education; and the inability to read and understand English. The protocol was approved by the University of Arizona Human Subjects Protection Committee and the study was conducted in accordance with the Helsinki Declaration. All guardians and girls provided written informed consent.
Covariates
Guardians completed a questionnaire that inquired about participant ethnicity and race. Measures of height and body mass were obtained to the nearest 0.1 cm and 0.1 kg, respectively. Non-dominant femur length (nearest mm) was measured from the base of the patella to the inguinal crease. Non-dominant tibia length (nearest mm) was measured from the proximal end of the medial border of the tibial plateau to the distal edge of the medial malleolus. Coefficients of variation (CVs) for femur and tibia lengths were 0.34% and 0.51%, respectively (n = 444). Maturity was assessed from self-report (with assistance available) of breast development based on Tanner stages. The questionnaire presents illustrations of stages of development and has been validated(29) and shown to agree with physician exam and grading. Although Tanner staging is common in developmental studies, its ability to accurately assess maturation is limited.(30) Consequently, we also used an alternate index of maturation (maturity offset), based on estimated years from peak height velocity (PHV) using Mirwald’s equation(31) which was derived from data from a six-year longitudinal study in boys and girls.(32) These equations incorporate interactions between height, weight, sitting height, leg length, and chronological age to derive a maturity offset value. The following equation from Mirwald and colleagues(31) was used to estimate maturity offset in our sample of females: Maturity Offset = −9.376 + 0.0001882·Leg Length and Sitting Height interaction + 0.0022·Age and Leg Length interaction + 0.005841·Age and Sitting Height interaction − 0.002658·Age and Weight interaction + 0.07693·Weight by Height ratio. A negative maturity offset value represents years before PHV whereas a positive maturity offset value represents years after PHV. In Mirwald’s sample, the maturity offset equation for girls explained 89% of the variance in years from PHV.(31)
Bone and soft tissue composition
Bone geometry and vBMD were assessed at the 4% and 20% femur and 4% and 66% tibia sites relative to the respective distal growth plates of the non-dominant limb using pQCT (XCT 3000; STRATEC Medizintechnik GmbH, Pforzheim, Germany, Division of Orthometrix; White Plains, NY). Scout scans were performed to locate the distal growth plates, with the scanner programmed to subsequently find the sites of interest. Operators were trained for pQCT data acquisition and analyses following guidelines provided by Bone Diagnostics, Inc. (Fort Atkinson, WI). A single operator performed all pQCT scans and a second investigator (JNF) performed all scan analyses using Stratec software, Version 6.0. At the distal metaphyseal regions of the femur and tibia, Contour mode 3 (169 mg/cm3) was used to measure total bone and Peel mode 4 (650 mg/cm3 with a 10% peel) was used to ensure that only trabecular bone remained. Because of the difficulties in interpreting metaphyseal bone density measurements from a single slice,(33) three pQCT slices were averaged at the distal 4% femur and tibia regions. At the diaphyseal 20% femur and 66% tibia sites, Contour mode 1 (710 mg/cm3) and Cort mode 2 (710 mg/cm3) were used. Further details on image processing, calculations, and analysis, including descriptions of Contour, Peel, and Cort modes are published elsewhere.(34) Slice thicknesses were 2.3 mm and voxel sizes were set at 0.4 mm. Scanner speed was set at 25 mm/second. The metaphyseal regions were chosen to represent skeletal sites predominantly comprised of trabecular bone, whereas the diaphyseal regions were chosen to represent skeletal sites predominantly comprised of cortical bone. Cortical parameters were not assessed at metaphyseal regions because the spatial resolution of the pQCT device used in this study is not sufficient to analyze cortical shells less than 2 mm.(35) pQCT bone parameters measured at distal metaphyseal regions of the femur and tibia were trabecular vBMD (mg/cm3), trabecular area (mm2), and bone strength index (BSI, mg2/mm4), while bone parameters measured at diaphyseal regions of the femur and tibia were cortical vBMD (mg/cm3), cortical area (mm2), endosteal circumference (mm), periosteal circumference (mm), cortical thickness (mm), and strength-strain index (SSI, mm3). BSI is calculated as the product of the metaphyseal total area and total vBMD squared: Bone strength index (BSI, mg2/mm4) = Total area × Total vBMD2.(36) Stratec software (version 6.0) offers the calculation of diaphyseal SSI, which is based on the integrated product of the geometric properties (i.e., section modulus) with the material properties of bone: Strength-strain index (SSI, mm3) = Σi = 1; n [((ri2 × a)/rmax) × (cortical vBMD/ND)].(34) Section modulus is calculated as (ri2 × a)/rmax where a is the area of a voxel (mm2), r is the distance of a voxel from the center of gravity (mm), and rmax is the maximum distance of a voxel from the center of gravity (mm). The material properties of bone are calculated as the quotient of measured cortical density (cortical vBMD, mg/cm3) and normal physiological cortical density (ND, 1200 mg/cm3). BSI estimates the bone’s ability to withstand compression at metaphyseal regions, while SSI is used to estimate the bone’s ability to resist torsion and bending forces at diaphyseal regions. CVs previously reported in our laboratory(10,27) were <1.1% for vBMD, bone geometry, and indices of bone strength (BSI, SSI).
Regional soft tissue composition was assessed at the 20% femur (thigh) and 66% tibia (calf) sites relative to the respective distal growth plates of the non-dominant limb using pQCT. Edge detection and threshold techniques were used to separate tissues (i.e., adipose, muscle, and bone) based on attenuation characteristics, which are directly related to tissue composition and density.(24,25) Images were filtered prior to being analyzed using Contour mode 3 (−101 mg/cm3) and Peel mode 2 (40 mg/cm3) to separate adipose (<40 mg/cm3) and muscle/bone (≥40 mg/cm3), respectively. Images were subsequently filtered with a 7 × 7 image filter that clearly defined the edge of the muscle and eliminated all bone above 120 mg/cm3, ensuring that muscle density was a direct result of the soft tissue within the edge of the muscle. Although this technique does not distinguish between intra- and extra-myocellular fat compartments, controlled studies have clearly established that a lower muscle density is an indicator of a higher skeletal muscle fat content.(24,25) Thus, we used muscle density as a composite index of fat content within the intra- and extra-myocellular stores. Soft tissue parameters obtained at the calf and thigh regions included muscle cross-sectional area (MCSA, mm2), muscle density (mg/cm3), and SAT (mm2). CVs for MCSA, muscle density, and SAT at the calf region were 1.4%, 0.9%, and 3.4%, respectively, while CVs for the same parameters at the thigh region were 1.2%, 0.4%, 4.2%, respectively. Total body mass, total body fat mass, and percent total body fat were obtained from whole body DXA scans using the GE Lunar Prodigy (software version 5.60.003) fan-beam densitometer (GE Lunar Corp, Madison, WI, USA). Subjects were positioned following standard GE/Lunar protocols. DXA CVs and precision in our laboratory have been reported.(37)
Statistical analysis
Data were checked for outliers and normality using histograms and all variables were tested for skewness and kurtosis. BSI and SSI were moderately skewed. We ran both log transformed and untransformed analyses and all results were similar; thus, we report the untransformed data for clarity. Tertiles were used to divide the sample into three groups (thirds) based on total body fat mass and ANOVA was used to detect differences in SAT and muscle density of the calf and thigh among total body fat mass groups. Bivariate correlations were computed using Pearson’s r for continuous and Spearman’s rho for categorical variables to examine relationships between maturity offset, ethnicity, and anthropometric characteristics and pQCT measures of fat, muscle, and bone strength. To examine the independent associations of SAT and muscle density with bone parameters, multiple linear regression was used to regress bone parameters on SAT and muscle density, while controlling for MCSA, bone length, maturity offset, and ethnicity. To protect against colinearity between MSCA and total body lean mass, which are highly correlated (femur: r = 0.86; tibia: r = 0.88), only MCSA was included in regression models, since past work has shown that bone strength in children should be interpreted relative to the loads (mainly skeletal muscle forces) typically imposed on the skeleton.(38) Tertiles were subsequently used to divide the sample into thirds based on SAT and muscle density assessed at the calf and thigh regions. Differences in bone strength among thirds of SAT and muscle density were tested using ANCOVA, after adjusting for MCSA, bone length, maturity offset, and ethnicity. Outcome values were normalized to the middle group by setting the middle group values to 1.0 and lower and higher values to <1.0 and >1.0, respectively. Normalization of values was necessary due to the differences in units among pQCT variables. Bonferroni post hoc tests were used to adjust for multiple comparisons. Covariates included in the regression and ANCOVA analyses were chosen based on known biological and biomechanical relations to bone parameters described previously.(10) We repeated all analyses substituting maturity offset with Tanner stage and also conducted analyses within maturity offset and Tanner stage categories [maturity offset < 0 years from PHV and ≥ 0 years from PHV; Tanner stage I (pre-pubertal), Tanner stage II–III (early pubertal)]. All results were similar, thus, we only report analyses that included maturity offset based on its greater association with indices of bone strength in this sample.(10) All analyses were performed using The Statistical Package for the Social Sciences for Windows, Version 18.0 (SPSS, Chicago, IL, USA).
Results
Descriptive characteristics are shown in Table 1. Sample ethnicity was 22% Hispanic and 78% non-Hispanic. Sample race was 89% white, 6% Asian, 3% black or African American, 0.5% Native American or Alaska Native, 1% Native Hawaiian or other Pacific Islander, and 0.5% others. Based on U.S. National Center for Health Statistics/Centers for Disease Control and Prevention percentiles for body mass index (BMI, kg/m2),(39) 3% of the sample was underweight (BMI <5th percentile), 75% of the sample was healthy weight (BMI 5th–85th percentile), 15% of the sample was overweight (BMI 85th–95th percentile), and 7% of the sample was obese (BMI >95th percentile). Tanner stage distributions for the total sample were 31% prepubertal (stage I, n = 139) and 69% early pubertal (stages II–III, n = 305). Maturity offset values indicated that girls were on average 1.1 years from PHV, with a range from 3.2 years prior to PHV to 1.4 years post PHV.
Table 1.
Sample descriptive characteristics
| Total sample (n = 444) | |
|---|---|
| Age (years) | 10.7 ± 1.1 |
| Menarche (%; Post) | 10 |
| Tanner stage (%; 1/2/3) | 31/34/35 |
| Maturity offset (years) | −1.1 ± 1.0 |
| Body mass (kg) | 39.3 ± 9.6 |
| Height (cm) | 144.9 ± 9.2 |
| Femur length (cm) | 34.2 ± 2.9 |
| Tibia length (cm) | 33.3 ± 2.6 |
| BMI (kg/m2) | 18.5 ± 3.1 |
| Lean mass (kg) | 25.8 ± 4.8 |
| Fat mass (kg) | 11.2 ± 5.8 |
| Fat mass (%) | 27.8 ± 8.2 |
| Thigh SAT (mm2) | 2627.0 ± 1437.7 |
| Thigh muscle density (mg/cm3) | 76.3 ± 1.4 |
| Femur BSI (mg2/mm4) | 95.6 ± 26.6 |
| Femur SSI (mm3) | 1352.1 ± 367.5 |
| Calf SAT (mm2) | 1515.0 ± 770.4 |
| Calf muscle density (mg/cm3) | 78.9 ± 1.2 |
| Tibia BSI (mg2/mm4) | 52.0 ± 14.1 |
| Tibia SSI (mm3) | 1181.1 ± 318.5 |
Values are presented as mean ± SD or percent.
SAT = subcutaneous adipose tissue; BSI = bone strength index; SSI = strength-strain index.
At both the calf and thigh regions, SAT was positively correlated with total body fat mass (r = 0.87–0.89, p < 0.001), while muscle density was inversely correlated with total body fat mass (r = −0.24 to −0.28, p < 0.001). Unadjusted values of calf and thigh SAT and muscle density are shown in Fig. 1 by thirds of DXA total body fat mass. Calf and thigh SAT increased (all p values < 0.001) across levels of total body fat mass. Calf and thigh muscle density decreased across levels of total body fat mass, indicating that higher skeletal muscle fat content was associated with higher total body fat mass. At both the calf and thigh regions, significant differences in muscle density were found between the highest and middle thirds of total body fat mass (all p values < 0.01) and between the highest and lowest thirds of total body fat mass (all p values < 0.001).
Fig. 1.
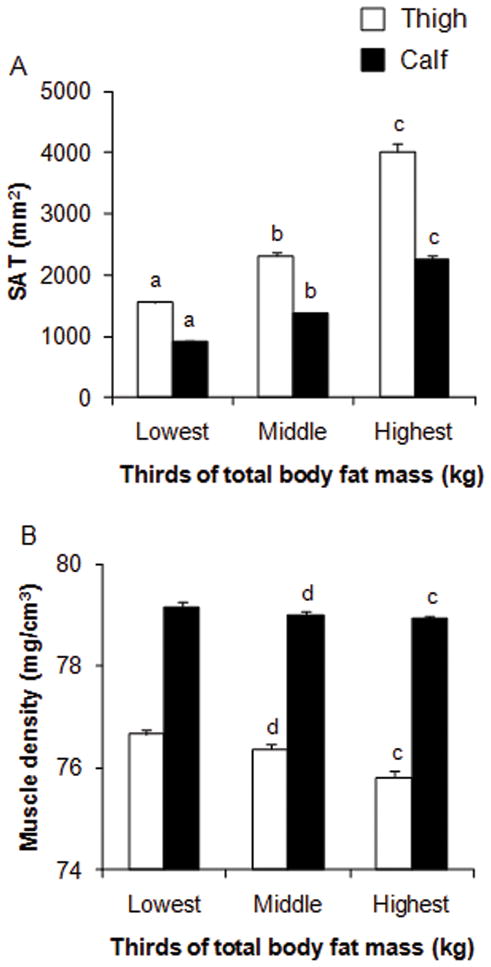
Subcutaneous adipose tissue (A) (SAT, mm2) and muscle density (B) (mg/cm3) of the calf and thigh by thirds of total body fat mass (kg) in young girls. Values are unadjusted means ± SE. Tertiles were defined as ≤7.2, 7.3 to 11.6, and ≥11.7 kg, respectively. Group differences were analyzed using ANOVA. Bonferroni post hoc tests were used to adjust for multiple comparisons. a Significantly (p < 0.001) different from middle group. b Significantly (p < 0.001) different from highest group. c Significantly (p < 0.001) different from lowest group. d Significantly (p < 0.01) different from highest group.
Unadjusted bivariate correlations (Pearson’s r) showed that SAT was inversely correlated with muscle density (r = −0.23 to −0.24, all p values < 0.001) at both the calf and thigh regions. SAT and MCSA of the calf and thigh were moderately correlated (r = 0.37–0.42, p < 0.001), while correlations were lower between muscle density and MCSA of the calf (r = 0.05, p > 0.05) and thigh (r = 0.21, p < 0.001). There were moderate to strong correlations between maturity and anthropometric characteristics and pQCT measures of SAT, MCSA, and indices of bone strength (BSI, SSI) (Table 2). Lower correlations were found between maturity and anthropometric characteristics and muscle density (Table 2).
Table 2.
Bivariate correlations between anthropometric characteristics, maturity, ethnicity and pQCT measures of fat, muscle, and indices of bone strength (BSI, SSI) in young girls
| Height | Body mass | BMI | Femur length | Tibia length | Maturity | Ethnicity | |
|---|---|---|---|---|---|---|---|
| Thigh SAT | 0.23a | 0.72a | 0.85a | 0.22a | 0.22a | 0.34a | 0.03 |
| Thigh muscle density | 0.15a | −0.07 | −0.21a | 0.20a | 0.11a | 0.14a | −0.06 |
| Thigh MCSA | 0.61a | 0.78a | 0.65a | 0.56a | 0.52a | 0.67a | −0.01 |
| 4% Femur BSI | 0.53a | 0.62a | 0.47a | 0.45a | 0.46a | 0.59a | 0.01 |
| 20% Femur SSI | 0.82a | 0.78a | 0.49a | 0.76a | 0.73a | 0.82a | 0.06 |
| Calf SAT | 0.20a | 0.70a | 0.83a | 0.17a | 0.21a | 0.29a | 0.01 |
| Calf muscle density | 0.10a | −0.09 | −0.20a | 0.10a | 0.05 | 0.10a | −0.09 |
| Calf MCSA | 0.69a | 0.85a | 0.69a | 0.58a | 0.59a | 0.76a | −0.03 |
| 4% Tibia BSI | 0.53a | 0.65a | 0.51a | 0.46a | 0.45a | 0.57a | −0.01 |
| 66% Tibia SSI | 0.77a | 0.78a | 0.53a | 0.71a | 0.69a | 0.77a | 0.03 |
SAT = subcutaneous adipose tissue (mm2); MCSA = muscle cross-sectional area (mm2); BSI = bone strength index (mg2/mm4); SSI = strength-strain index (mm3).
Significant, p < 0.05; Pearson’s r for continous and Spearman’s rho for categorical variables.
Multiple linear regression with muscle density, SAT, MCSA, bone length, maturity offset, and ethnicity as independent variables showed significant associations between muscle density and trabecular vBMD (p < 0.05) and BSI (p < 0.001) at metaphyseal regions of the femur and tibia (Table 3). In contrast, associations between muscle density and trabecular area were non-significant (Table 3). Thus, the inverse relationship between skeletal muscle fat content and BSI was predominantly due to lower trabecular vBMD, and not trabecular area, at distal metaphyseal regions of the femur and tibia. Positive associations were observed between muscle density and cortical vBMD at diaphyseal regions of the femur (β = 0.17, p < 0.001) and tibia (β = 0.08, p = 0.090) whereas associations between muscle density and endosteal and periosteal circumferences at diaphyseal regions of femur and tibia were lower and non-significant (all p values > 0.05) (Table 3). Nonetheless, the modest reciprocal associations between endosteal and periosteal circumferences and muscle density resulted in stronger associations between muscle density and cortical area and cortical thickness at diaphyseal regions of the femur and tibia (Table 3). Taken together, the positive associations between muscle density and cortical vBMD, area, and thickness resulted in significant associations between muscle density and SSI at diaphyseal regions of the femur (β = 0.06, p = 0.009) and tibia (β = 0.09, p = 0.002) (Table 3). Associations between SAT and bone parameters were non-significant at all skeletal sites (all p values > 0.05), except metaphyseal BSI of the tibia (β = 0.09, p = 0.029) (Table 3). Analyses within maturity categories [maturity offset < 0 years from PHV (PRE) and ≥ 0 years from PHV (POST); and Tanner stage I (prepubertal), Tanner stages II–III (early pubertal)] gave similar results and did not markedly change the magnitude or direction of the observed relationships between SAT and muscle density and indices of bone strength (data not shown).
Table 3.
Indepenent associations of muscle density and subcutaneous adipose tissue with bone parameters at metaphyseal and diaphyseal regions of the femur and tibia in young girls
| Dependent variables | Muscle density (mg/cm3)
|
SAT (mm2)
|
Adjusted R2 value | ||
|---|---|---|---|---|---|
| β | p | β | p | ||
| 4% Femur | |||||
| Trabecular vBMD (mg/cm3) | 0.11 | 0.020 | 0.06 | 0.280 | 0.15 |
| Trabecular area (mm2) | −0.06 | 0.080 | −0.04 | 0.298 | 0.57 |
| Bone strength index (mg2/mm4) | 0.13 | <0.001 | 0.05 | 0.237 | 0.49 |
| 20% Femur | |||||
| Cortical vBMD (mg/cm3) | 0.17 | <0.001 | 0.04 | 0.505 | 0.05 |
| Cortical area (mm2) | 0.06 | 0.030 | 0.04 | 0.231 | 0.72 |
| Endosteal circumference (mm) | −0.03 | 0.495 | 0.03 | 0.407 | 0.44 |
| Periosteal circumference (mm) | 0.01 | 0.906 | 0.04 | 0.230 | 0.65 |
| Cortical thickness (mm) | 0.08 | 0.079 | 0.01 | 0.771 | 0.20 |
| Strength-strain index (mm3) | 0.06 | 0.009 | 0.04 | 0.152 | 0.78 |
| 4% Tibia | |||||
| Trabecular vBMD (mg/cm3) | 0.26 | <0.001 | 0.07 | 0.124 | 0.18 |
| Trabecular area (mm2) | −0.06 | 0.049 | −0.06 | 0.112 | 0.59 |
| Bone strength index (mg2/mm4) | 0.19 | <0.001 | 0.09 | 0.029 | 0.50 |
| 66% Tibia | |||||
| Cortical vBMD (mg/cm3) | 0.08 | 0.090 | −0.01 | 0.804 | 0.14 |
| Cortical area (mm2) | 0.08 | 0.003 | 0.04 | 0.239 | 0.73 |
| Endosteal circumference (mm) | −0.02 | 0.655 | 0.03 | 0.535 | 0.26 |
| Periosteal circumference (mm) | 0.05 | 0.083 | 0.06 | 0.059 | 0.69 |
| Cortical thickness (mm) | 0.10 | 0.006 | 0.06 | 0.151 | 0.51 |
| Strength-strain index (mm3) | 0.09 | 0.002 | 0.03 | 0.396 | 0.71 |
Standardized β coefficient and p values are presented for muscle density (mg/cm3) and subcutaneous adipose tissue (SAT, mm2). Adjusted R2 values are presented for each full regression model.
Model covariates = muscle density, subcutaneous adipose tissue, muscle cross-sectional area, bone length, maturity, and ethnicity.
Comparisons of indices of bone strength across thirds of muscle density and SAT of the calf and thigh were performed using ANCOVA, after adjusting for MCSA, bone length, maturity offset, and ethnicity (Fig. 2). BSI at distal metaphyseal sites of the femur and tibia was 5.8% (p < 0.01) and 9.0% (p < 0.001) lower, respectively, in the lowest compared with the highest third of muscle density. Similarly, SSI at the diaphyseal sites of the femur and tibia was 3.5% (p < 0.05) and 4.7% (p < 0.01) lower, respectively, in the lowest compared with the highest third of muscle density. No significant differences in indices of bone strength were found across any levels of SAT (all p values > 0.05).
Fig. 2.

Estimated marginal means ± SE for femur and tibia bone strength index (BSI, mg2/mm4) and strength-strain index (SSI, mm3) by thirds of subcutaneous adipose tissue (A) (SAT, mm2) and muscle density (B) (mg/cm3) of the calf and thigh. Outcome values were normalized to the middle group by setting the middle group values to 1.0 and lower and higher values to <1.0 and >1.0, respectively. Normalization of values was necessary due to the differences in units among pQCT outcome variables. Group differences were evaluated by ANCOVA using MCSA, bone length, maturity offset, and ethnicity as covariates. a Significantly (p < 0.001) different from highest group. b Significantly (p < 0.01) different from highest group. c Significantly (p < 0.05) different from lowest group.
Discussion
Skeletal muscle fat deposition is an important aspect of body composition that is altered in obesity and is associated with metabolic complications such as impaired glucose tolerance and insulin resistance.(14–17) Observations in older adults that greater fat content in skeletal muscle predicts hip fracture(20,21) and is inversely related with vBMD(22) have stimulated interest in better understanding the relationship between regional fat deposition and bone status. To our knowledge, this is the first study to investigate the relationship between local skeletal muscle fat content (calf and thigh) and weight-bearing bone status in youth. We found that higher skeletal muscle fat content of the calf and thigh was inversely associated with weight-bearing bone strength (BSI, SSI) in young girls, independent of other key determinants of bone parameters in youth (i.e., muscle area, bone length, maturity, and ethnicity), whereas subcutaneous fat was a weaker determinant of bone strength. Moreover, the inverse relationship between skeletal muscle fat content and BSI was due to lower trabecular vBMD, and not trabecular area, at metaphyseal regions of the femur and tibia, whereas the inverse relationship between skeletal muscle fat content and SSI at diaphyseal regions of the femur and tibia was due to deficits in cortical vBMD, area, and thickness.
Only one other study(22) has examined the relationship between skeletal muscle fat distribution and weight-bearing bone parameters of the tibia. In that study, Yerges-Armstrong and colleagues,(22) used pQCT to show that higher calf muscle fat content in older Afro-Caribbean men was inversely related to trabecular and cortical vBMD of the tibia. Our findings are consistent with those of Yerges-Armstrong and colleagues.(22) A limitation of their study was that the independent associations of skeletal muscle fat content with bone geometric parameters (i.e., trabecular/cortical area, endosteal/periosteal circumference, and cortical thickness) were not reported. Since vBMD and bone geometry are the major determinants of bone strength,(26) it would be important to include measures of bone geometry in future studies. Nonetheless, our findings, together with Yerges-Armstrong and colleagues,(22) suggest that greater skeletal muscle fat content may have negative consequences for bone status in youth and older adults.
Our findings suggest that skeletal muscle fat content is inversely associated with trabecular vBMD at metaphyseal regions of the femur and tibia. These findings are of interest given that we previously reported that lower trabecular vBMD at metaphyseal regions of the femur and tibia is associated with prior fracture in this sample.(27) Taken together, these findings suggest that greater skeletal muscle fat content may be a risk factor for skeletal fragility and fracture during growth. We also found a persistent, albeit weak association between SAT and bone strength, which is consistent with findings of Yerges-Armstrong and colleagues(22) and the results previously reported in our sample for total body fat mass.(10) These findings suggest that total body fat and subcutaneous fat are weak determinants of bone strength after adjusting for important covariates with known biological and biomechanical relations to bone parameters in youth (i.e., muscle area, bone length, maturity, and ethnicity).
Potential mechanisms exist for both a positive and negative fat-bone relationship,(40) although mounting evidence suggests that central adiposity and insulin resistance have negative consequences for bone and may be involved in the pathogenesis of osteoporosis.(41) Hormones secreted from intra-abdominal adipocytes pass through the liver before entering the general circulation,(42) which has implicated VAT tissue in the pathogenesis of T2DM and may explain why recent studies in prepubertal children,(23) adolescent girls,(18) and young women(19) found inverse relationships between VAT and bone parameters. Several lines of evidence suggest that insulin resistance is the common link between the inverse association between greater skeletal muscle fat content and bone. First, patients with T2DM have a higher incidence of fragility fractures.(43) Second, studies in children and adults have revealed a strong link between fat within skeletal muscle, particularly intramyocellular fat stores, and impaired glucose tolerance, insulin resistance, and T2DM.(14–17) Indeed, fatty infiltration of skeletal muscle results in the accumulation of intracellular lipid metabolites (i.e., long-chain fatty acyl-CoA, diacylglycerol, and ceramide),(44) which have been shown to directly impair signaling pathways implicated in insulin resistance and T2DM.(42) Third, osteoblasts express a functional insulin receptor and binding of insulin to the insulin receptor on osteoblasts is necessary for bone development.(45) Indeed, Fulzele and colleagues(45) recently showed that mice lacking the insulin receptor on osteoblasts have compromised bone development due to deficient numbers of osteoblasts. In toto, these findings suggest that fat infiltration within skeletal muscle elevates intracellular lipid metabolites, which may act to impair insulin signaling, osteoblast function, and bone formation. The inverse relationship between skeletal muscle fat content and bone parameters may also be a result of reduced muscle quality and physical inactivity which could contribute to decreased skeletal loading, a critical osteogenic stimulus throughout life.(26) Further studies are needed to elucidate the mechanisms underlying the inverse relationship between skeletal muscle fat content and bone status.
The present study was not without limitations. First, the cross-sectional design makes it impossible to establish a causal relationship between skeletal muscle fat content and reduced bone strength. Secondly, the study was limited to pre- and early-pubertal girls, and the results may not generalize to other populations. Most previous studies have used a single CT slice of the midthigh to assess adipose compartments. Our study obtained single slices at the 20% femur and 66% tibia sites relative to the respective distal growth plates of the non-dominant limb. These regions have smaller depots of adipose tissue than at the midthigh, a potential limitation, although strong correlations among adipose compartments of the calf and thigh have been reported using magnetic resonance imaging (MRI).(46) A final limitation is that the pQCT device used in this study does not distinguish between intra- and extra-myocellular fat compartments. Nevertheless, a more accurate measure of intramyocellular fat content would have likely led to an even stronger inverse association between fat content within skeletal muscle and bone strength. While it is desirable to measure both compartments, they are undoubtedly intercorrelated and correlated with total fat content. Sinha et al.,(14) using 1H nuclear magnetic resonance spectroscopy, showed that both intra- and extra-myocellular fat stores are significantly increased in obese compared with non-obese youth and that insulin resistance is significantly correlated with both intra- (r = 0.72) and extra-myocellular (r = 0.68) fat content. In addition, VAT was shown to be significantly associated with both intra- (r = 0.73) and extra-myocellular (r = 0.86) fat content.(14) Taken together, these findings suggest that both intra- and extra-myocellular fat stores are related to central adiposity and insulin resistance, and composite indices of both intra- and extra-myocellular fat stores should provide useful indices of fat content within skeletal muscle. While MRI has better contrast resolution than pQCT, its high cost prevents its use in large samples. pQCT, because of its relative low cost, fast speed, and low radiation dose, has promise for application in future large-scale studies. These features make pQCT uniquely suited to safely estimate regional fat compartments of the calf and thigh in addition to assessing vBMD and bone geometry, the major determinants of bone strength.(26) Future applications of this technique should help to further clarify the relationship between skeletal muscle fat content and bone.
In conclusion, we found that skeletal muscle fat content of the calf and thigh was associated with lower bone strength at metaphyseal and diaphyseal regions of the femur and tibia in girls, independent of key determinants of bone parameters in youth (i.e., muscle area, bone length, maturity, and ethnicity). In contrast, subcutaneous fat of the calf and thigh was a weaker determinant of bone strength. Importantly, these findings are consistent with those observed in older adults(22) and suggest that greater skeletal muscle fat content may be a marker for suboptimal bone development in females, at least, as early as the peri-pubertal years. Additional studies are needed to characterize the possible mechanisms underlying the inverse relationship between skeletal muscle fat content and bone status.
Acknowledgments
Grant Support: NIH: HD050775; Clinical Trials #: NCT00729378; Registration Date: 07/17/08
We appreciate the participation and support of principals, teachers, parents and students from the schools in the Catalina Foothills and Marana School Districts. We also wish to thank the radiation technicians, program coordinators, and all other members of the Jump-In Study team for their contributions. The project described was supported by Award Number HD-050775 (SG) from the National Institute of Child Health and Human Development. JF is supported by NIH NIGMS T32 GM-08400: Graduate Training in Systems and Integrative Physiology.
Footnotes
CONFLICTS OF INTEREST: None of the authors have a conflict relevant to this study.
The content is solely the responsibility of the authors and does not necessarily represent the official views of the National Institute of Child Health and Human Development or the National Institutes of Health.
The authors have nothing to disclose.
Contributor Information
Joshua N. Farr, Email: jfarr@email.arizona.edu.
Janet L. Funk, Email: jfunk@email.arizona.edu.
Zhao Chen, Email: zchen@email.arizona.edu.
Jeffrey R. Lisse, Email: lisse@email.arizona.edu.
Robert M. Blew, Email: rblew@email.arizona.edu.
Vinson R. Lee, Email: vinsonl@email.arizona.edu.
Monica Laudermilk, Email: ladybug@email.arizona.edu.
Timothy G. Lohman, Email: lohman@email.arizona.edu.
Scott B. Going, Email: going@email.arizona.edu.
References
- 1.Weiss R, Dziura J, Burgert TS, et al. Obesity and the metabolic syndrome in children and adolescents. N Engl J Med. 2004;350:2362–2374. doi: 10.1056/NEJMoa031049. [DOI] [PubMed] [Google Scholar]
- 2.Cali AM, Caprio S. Obesity in children and adolescents. J Clin Endocrinol Metab. 2008;93:S31–36. doi: 10.1210/jc.2008-1363. [DOI] [PMC free article] [PubMed] [Google Scholar]
- 3.Leonard MB, Shults J, Wilson BA, Tershakovec AM, Zemel BS. Obesity during childhood and adolescence augments bone mass and bone dimensions. Am J Clin Nutr. 2004;80:514–523. doi: 10.1093/ajcn/80.2.514. [DOI] [PubMed] [Google Scholar]
- 4.Clark EM, Ness AR, Tobias JH. Adipose tissue stimulates bone growth in prepubertal children. J Clin Endocrinol Metab. 2006;91:2534–2541. doi: 10.1210/jc.2006-0332. [DOI] [PMC free article] [PubMed] [Google Scholar]
- 5.Sayers A, Tobias JH. Fat mass exerts a greater effect on cortical bone mass in girls than boys. J Clin Endocrinol Metab. 2010;95:699–706. doi: 10.1210/jc.2009-1907. [DOI] [PMC free article] [PubMed] [Google Scholar]
- 6.Petit MA, Beck TJ, Shults J, et al. Proximal femur bone geometry is appropriately adapted to lean mass in overweight children and adolescents. Bone. 2005;36:568–576. doi: 10.1016/j.bone.2004.12.003. [DOI] [PubMed] [Google Scholar]
- 7.Janicka A, Wren TA, Sanchez MM, et al. Fat mass is not beneficial to bone in adolescents and young adults. J Clin Endocrinol Metab. 2007;92:143–147. doi: 10.1210/jc.2006-0794. [DOI] [PubMed] [Google Scholar]
- 8.Pollock NK, Laing EM, Baile CA, et al. Is adiposity advantageous for bone strength? A peripheral quantitative computed tomography study in late adolescent females. Am J Clin Nutr. 2007;86:1530–1538. doi: 10.1093/ajcn/86.5.1530. [DOI] [PubMed] [Google Scholar]
- 9.Ducher G, Bass SL, Naughton GA, et al. Overweight children have a greater proportion of fat mass relative to muscle mass in the upper limbs than in the lower limbs: implications for bone strength at the distal forearm. Am J Clin Nutr. 2009;90:1104–1111. doi: 10.3945/ajcn.2009.28025. [DOI] [PubMed] [Google Scholar]
- 10.Farr JN, Chen Z, Lisse JR, Lohman TG, Going SB. Relationship of total body fat mass to weight-bearing bone volumetric density, geometry, and strength in young girls. Bone. 2010;46:977–984. doi: 10.1016/j.bone.2009.12.033. [DOI] [PMC free article] [PubMed] [Google Scholar]
- 11.Goulding A, Jones IE, Taylor RW, Manning PJ, Williams SM. More broken bones: a 4-year double cohort study of young girls with and without distal forearm fractures. J Bone Miner Res. 2000;15:2011–2018. doi: 10.1359/jbmr.2000.15.10.2011. [DOI] [PubMed] [Google Scholar]
- 12.Goulding A, Grant AM, Williams SM. Bone and body composition of children and adolescents with repeated forearm fractures. J Bone Miner Res. 2005;20:2090–2096. doi: 10.1359/JBMR.050820. [DOI] [PubMed] [Google Scholar]
- 13.Zhao LJ, Jiang H, Papasian CJ, et al. Correlation of obesity and osteoporosis: effect of fat mass on the determination of osteoporosis. J Bone Miner Res. 2008;23:17–29. doi: 10.1359/JBMR.070813. [DOI] [PMC free article] [PubMed] [Google Scholar]
- 14.Sinha R, Dufour S, Petersen KF, et al. Assessment of skeletal muscle triglyceride content by (1)H nuclear magnetic resonance spectroscopy in lean and obese adolescents: relationships to insulin sensitivity, total body fat, and central adiposity. Diabetes. 2002;51:1022–1027. doi: 10.2337/diabetes.51.4.1022. [DOI] [PubMed] [Google Scholar]
- 15.Pan DA, Lillioja S, Kriketos AD, et al. Skeletal muscle triglyceride levels are inversely related to insulin action. Diabetes. 1997;46:983–988. doi: 10.2337/diab.46.6.983. [DOI] [PubMed] [Google Scholar]
- 16.Phillips DI, Caddy S, Ilic V, et al. Intramuscular triglyceride and muscle insulin sensitivity: evidence for a relationship in nondiabetic subjects. Metabolism. 1996;45:947–950. doi: 10.1016/s0026-0495(96)90260-7. [DOI] [PubMed] [Google Scholar]
- 17.Goodpaster BH, Krishnaswami S, Harris TB, et al. Obesity, regional body fat distribution, and the metabolic syndrome in older men and women. Arch Intern Med. 2005;165:777–783. doi: 10.1001/archinte.165.7.777. [DOI] [PubMed] [Google Scholar]
- 18.Russell M, Mendes N, Miller KK, et al. Visceral fat is a negative predictor of bone density measures in obese adolescent girls. J Clin Endocrinol Metab. 2010;95:1247–1255. doi: 10.1210/jc.2009-1475. [DOI] [PMC free article] [PubMed] [Google Scholar]
- 19.Gilsanz V, Chalfant J, Mo AO, et al. Reciprocal relations of subcutaneous and visceral fat to bone structure and strength. J Clin Endocrinol Metab. 2009;94:3387–3393. doi: 10.1210/jc.2008-2422. [DOI] [PMC free article] [PubMed] [Google Scholar]
- 20.Lang T, Koyama A, Li C, et al. Pelvic body composition measurements by quantitative computed tomography: association with recent hip fracture. Bone. 2008;42:798–805. doi: 10.1016/j.bone.2007.12.002. [DOI] [PubMed] [Google Scholar]
- 21.Lang T, Cauley JA, Tylavsky F, et al. Computed tomographic measurements of thigh muscle cross-sectional area and attenuation coefficient predict hip fracture: the health, aging, and body composition study. J Bone Miner Res. 2010;25:513–519. doi: 10.1359/jbmr.090807. [DOI] [PMC free article] [PubMed] [Google Scholar]
- 22.Yerges-Armstrong LM, Miljkovic I, Cauley JA, et al. Adipose tissue and volumetric bone mineral density of older Afro-Caribbean men. J Bone Miner Res. 2010;25:2221–2228. doi: 10.1002/jbmr.107. [DOI] [PMC free article] [PubMed] [Google Scholar]
- 23.Pollock NK, Bernard PJ, Wenger K, et al. Lower bone mass in prepubertal overweight children with prediabetes. J Bone Miner Res. 2010;25:2484–2493. doi: 10.1002/jbmr.184. [DOI] [PMC free article] [PubMed] [Google Scholar]
- 24.Goodpaster BH, Kelley DE, Thaete FL, He J, Ross R. Skeletal muscle attenuation determined by computed tomography is associated with skeletal muscle lipid content. J Appl Physiol. 2000;89:104–110. doi: 10.1152/jappl.2000.89.1.104. [DOI] [PubMed] [Google Scholar]
- 25.Kelley DE, Slasky BS, Janosky J. Skeletal muscle density: effects of obesity and non-insulin-dependent diabetes mellitus. Am J Clin Nutr. 1991;54:509–515. doi: 10.1093/ajcn/54.3.509. [DOI] [PubMed] [Google Scholar]
- 26.Seeman E, Delmas PD. Bone quality--the material and structural basis of bone strength and fragility. N Engl J Med. 2006;354:2250–2261. doi: 10.1056/NEJMra053077. [DOI] [PubMed] [Google Scholar]
- 27.Farr JN, Tomas R, Chen Z, et al. Lower trabecular volumetric BMD at metaphyseal regions of weight-bearing bones is associated with prior fracture in young girls. J Bone Miner Res. 2011;26:380–387. doi: 10.1002/jbmr.218. [DOI] [PMC free article] [PubMed] [Google Scholar]
- 28.American Academy of Pediatrics. Medical conditions affecting sports participation. Pediatrics. 2001;107:1205–1209. doi: 10.1542/peds.107.5.1205. [DOI] [PubMed] [Google Scholar]
- 29.Morris NM, Udry RJ. Validation of a self-administered instrument to assess stage of adolescent development. J Youth Adolesc. 1980;9:271–280. doi: 10.1007/BF02088471. [DOI] [PubMed] [Google Scholar]
- 30.Sherar LB, Baxter-Jones AD, Mirwald RL. Limitations to the use of secondary sex characteristics for gender comparisons. Ann Hum Biol. 2004;31:586–593. doi: 10.1080/03014460400001222. [DOI] [PubMed] [Google Scholar]
- 31.Mirwald RL, Baxter-Jones AD, Bailey DA, Beunen GP. An assessment of maturity from anthropometric measurements. Med Sci Sports Exerc. 2002;34:689–694. doi: 10.1097/00005768-200204000-00020. [DOI] [PubMed] [Google Scholar]
- 32.Bailey DA, McKay HA, Mirwald RL, Crocker PR, Faulkner RA. A six-year longitudinal study of the relationship of physical activity to bone mineral accrual in growing children: The University of Saskatchewan Bone Mineral Accrual Study. J Bone Miner Res. 1999;14:1672–1679. doi: 10.1359/jbmr.1999.14.10.1672. [DOI] [PubMed] [Google Scholar]
- 33.Lee DC, Gilsanz V, Wren TA. Limitations of peripheral quantitative computed tomography metaphyseal bone density measurements. J Clin Endocrinol Metab. 2007;92:4248–4253. doi: 10.1210/jc.2007-0126. [DOI] [PubMed] [Google Scholar]
- 34.Stratec Medizintchnik XCT 3000 manual, software version 6.0. Pforzheim; Germany: 2004. [Google Scholar]
- 35.Augat P, Gordon CL, Lang TF, Iida H, Genant HK. Accuracy of cortical and trabecular bone measurements with peripheral quantitative computed tomography (pQCT) Phys Med Biol. 1998;43:2873–2883. doi: 10.1088/0031-9155/43/10/015. [DOI] [PubMed] [Google Scholar]
- 36.Kontulainen SA, Johnston JD, Liu D, et al. Strength indices from pQCT imaging predict up to 85% of variance in bone failure properties at tibial epiphysis and diaphysis. J Musculoskelet Neuronal Interact. 2008;8:401–409. [PubMed] [Google Scholar]
- 37.Going S, Lohman T, Houtkooper L, et al. Effects of exercise on bone mineral density in calcium-replete postmenopausal women with and without hormone replacement therapy. Osteoporos Int. 2003;14:637–643. doi: 10.1007/s00198-003-1436-x. [DOI] [PubMed] [Google Scholar]
- 38.Petit MA, Beck TJ, Kontulainen SA. Examining the developing bone: What do we measure and how do we do it? J Musculoskelet Neuronal Interact. 2005;5:213–224. [PubMed] [Google Scholar]
- 39.Kuczmarski RJ, Ogden CL, Grummer-Strawn LM, et al. CDC growth charts: United States. Adv Data. 2000;8:1–27. [PubMed] [Google Scholar]
- 40.Reid IR. Relationships between fat and bone. Osteoporos Int. 2008;19:595–606. doi: 10.1007/s00198-007-0492-z. [DOI] [PubMed] [Google Scholar]
- 41.Rosen CJ, Klibanski A. Bone, fat, and body composition: evolving concepts in the pathogenesis of osteoporosis. Am J Med. 2009;122:409–414. doi: 10.1016/j.amjmed.2008.11.027. [DOI] [PubMed] [Google Scholar]
- 42.Shulman GI. Cellular mechanisms of insulin resistance. J Clin Invest. 2000;106:171–176. doi: 10.1172/JCI10583. [DOI] [PMC free article] [PubMed] [Google Scholar]
- 43.Janghorbani M, Van Dam RM, Willett WC, Hu FB. Systematic review of type 1 and type 2 diabetes mellitus and risk of fracture. Am J Epidemiol. 2007;166:495–505. doi: 10.1093/aje/kwm106. [DOI] [PubMed] [Google Scholar]
- 44.Shaw CS, Clark J, Wagenmakers AJ. The effect of exercise and nutrition on intramuscular fat metabolism and insulin sensitivity. Annu Rev Nutr. 2010;30:13–34. doi: 10.1146/annurev.nutr.012809.104817. [DOI] [PubMed] [Google Scholar]
- 45.Fulzele K, Riddle RC, DiGirolamo DJ, et al. Insulin receptor signaling in osteoblasts regulates postnatal bone acquisition and body composition. Cell. 2010;142:309–319. doi: 10.1016/j.cell.2010.06.002. [DOI] [PMC free article] [PubMed] [Google Scholar]
- 46.Larson-Meyer DE, Smith SR, Heilbronn LK, et al. Muscle-associated triglyceride measured by computed tomography and magnetic resonance spectroscopy. Obesity (Silver Spring) 2006;14:73–87. doi: 10.1038/oby.2006.10. [DOI] [PMC free article] [PubMed] [Google Scholar]