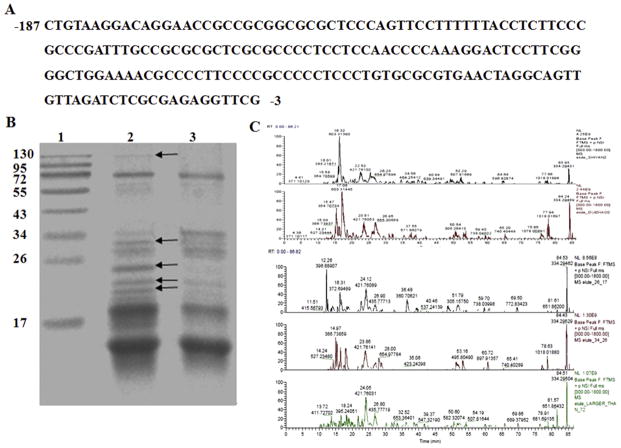
Fig. 4.
Mass spectrometry analysis of DNA-binding proteins purified using an affinity column. A. The primary promoter element of hnRNP K. B. Purified samples were separated on 15% SDS-PAGE: Lane 1 Molecular mass marker; Lane 2 Sample; Lane 3 Control. The unique protein bands that were present only in the sample were marked by arrows and the bands numbered 1, 2, 3 and 4 (the last two bands). C. Q Exactive MS analysis of the unique bands on SDS-PAGE gel.

