

Abstract
N,N-diethylaminobenzaldehyde (DEAB) is a commonly used “selective” inhibitor of aldehyde dehydrogenase isoenzymes in cancer stem cell biology due to its inclusion as a negative control compound in the widely utilized Aldefluor assay. Recent evidence has accumulated that DEAB is not a selective inhibitory agent when assayed in vitro versus ALDH1, ALDH2 and ALDH3 family members. We sought to determine the selectivity of DEAB toward ALDH1A1, ALDH1A2, ALDH1A3, ALDH1B1, ALDH1L1, ALDH2, ALDH3A1, ALDH4A1 and ALDH5A1 isoenzymes and determine the mechanism by which DEAB exerts its inhibitory action. We found that DEAB is an excellent substrate for ALDH3A1, exhibiting a Vmax/KM that exceeds that of its commonly used substrate, benzaldehyde. DEAB is also a substrate for ALDH1A1, albeit an exceptionally slow one (turnover rate ~0.03 min−1). In contrast, little if any turnover of DEAB was observed when incubated with ALDH1A2, ALDH1A3, ALDH1B1, ALDH2 or ALDH5A1. DEAB was neither a substrate nor an inhibitor for ALDH1L1 or ALDH4A1. Analysis by enzyme kinetics and QTOF mass spectrometry demonstrates that DEAB is an irreversible inhibitor of ALDH1A2 and ALDH2 with apparent bimolecular rate constants of 2900 and 86,000 M−1 s−1, respectively. The mechanism of inactivation is consistent with the formation of quinoid-like resonance state following hydride transfer that is stabilized by local structural features that exist in several of the ALDH isoenzymes.
Keywords: Aldehyde dehydrogenase, Enzyme kinetics, Inhibition
1. Introduction
Aldehydes are highly reactive compounds that are produced from a variety of endogenous and exogenous sources, including cellular metabolites, xenobiotic metabolism and environmentally derived pollutants. Although certain aldehydes are critical for biological functions, many are cytotoxic and/or carcinogenic due to the highly reactive nature of their carbonyl group. Detoxification of aldehydes generally occurs either via oxidation to the corresponding carboxylic acid or reduction to the alcohol. The aldehyde dehydrogenase (ALDH) superfamily catalyzes the NAD(P)+-dependent oxidation of aldehydes to their respective carboxylic acid. The human genome encodes for at least 19 distinct ALDH genes. The distribution and expression levels of the various ALDHs is dependent on tissue type, with some ALDHs constitutively expressed in most tissues while others demonstrate more limited spatial or temporal expression patterns. Mutations in ALDH genes can lead to aberrant aldehyde oxidation and have been linked to a number of disorders, including Sjögren-Larsson syndrome (ALDH3A2), γ-hydroxybutyric aciduria (ALDH5A1), and type II hyperprolinemia (ALDH4A1), and may also contribute to more complex diseases such as alcoholism, Alzheimer’s disease, and various cancers [1–3]. The roles of a number of ALDH isoenzymes in cancers and the potential for targeting these enzymes for drug development has recently been reviewed [4].
The majority of ALDH’s catalyze the irreversible, NAD(P)+-dependent oxidation of an aldehyde to its corresponding carboxylic acid, with only ALDH6A1 generating the CoA thioester product. There is significant overlap in substrate utilization between some isoenzymes, especially those in the ALDH1 and ALDH3 classes. The structure of human ALDHs are similar, functioning as either homodimers or homotetramers, with each monomer comprised of at least three structural domains; a catalytic domain, a cofactor binding domain, and an oligomerization domain [5]. Using the ALDH1A1 sequence as reference, Cys303 in the active site performs a nucleophilic attack on the carbonyl carbon of the aldehyde, forming a covalent thiohemiacetal intermediate [6]. Hydride transfer to NAD(P)+ produces the reduced cofactor and acyl enzyme intermediate, which is hydrolyzed by a water molecule activated by Glu269 [7] (Fig. 1). These active site residues are conserved in active ALDH isoenzymes. In general, many ALDH enzymes follow an ordered mechanism of substrate addition with cofactor binding and release as the initial and final steps, but there are differences in the rate-limiting step among the different ALDH enzymes. For example, the rate-limiting step for ALDH1A1 is cofactor dissociation [8], the deacylation step for ALDH2 [9], and hydride transfer for ALDH3A1 [8–10]. Despite similarities in structure and function, the isoenzymes of the ALDH family of proteins have evolved to recognize different spectrums of aldehyde substrates due to differences in the size and shape of their respective substrate binding sites [5,11]. These differences have permitted the development of some selective activators and inhibitors for various isoenzymes as therapeutics. For example, disulfiram (commercial: Antabuse) is an inhibitor of both ALDH1A1 and ALDH2, and this drug can be used to treat alcoholism [5] and possibly cocaine addiction [12]. Alda-1 is a selective activator of ALDH2 and may offer cardiac protection following ischemic events by decreasing cytotoxic aldehyde levels [13]. More knowledge on the structural and kinetic differences between the ALDH isoenzymes is needed to produce selective and potent small molecule activators and inhibitors for more of the ALDH enzymes.
Fig. 1.
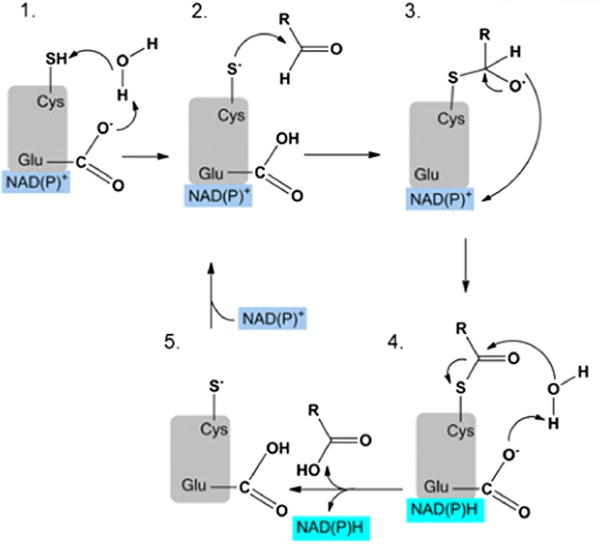
Mechanism of aldehyde oxidation based on ALDH2 active site residues: (1) catalytic cysteine (Cys302) activated by water-mediated proton abstraction by glutamate (Glu268), (2) nucleophilic attack on the carbonyl carbon of the aldehyde by Cys302, (3) formation of a tetrahedral thiohemiacetal intermediate and hydride transfer to the cofactor NAD(P)+, (4) hydrolysis of thioester intermediate and release of carboxylic acid product and reduced cofactor, and (5) regeneration of activated enzyme by binding cofactor.
Over 20 years ago, cytosolic ALDH (ALDH1) had been shown to be elevated in hematopoietic stem cell (HSC) and could be used for HSC isolation [14,15]. This increase in ALDH1 expression had been linked to cyclophosphamide resistance in various leukemia cell lines [16]. The first cancer stem cells (CSC) were identified in 1994 for acute myeloid leukemia [17] and nearly a decade later, CSCs in solid tumors were discovered [18]. Since then, CSC have been identified in a number of cancers and these sub-populations of tumor cells have critical roles in tumorigenesis and self-renewal. As with HSC, ALDH’s have been identified as possible biomarkers for numerous CSC [19,20]. A commonly used method to identify and isolate stem cells is via the Aldefluor Assay (Stemcell Technologies, Inc.) that measures ALDH activity in live cells. This assay takes advantage of the conversion of the ALDH substrate BODIPY-aminoacetaldehyde (BAAA) to the charged product BOD-IPY-aminoacetate, which accumulates in cells and enhances their fluorescence. An inhibitor of ALDH activity, N,N-diethylaminobenzaldehyde (DEAB), is supplied as a negative control for this assay. DEAB was developed as a reversible, competitive inhibitor of ALDH enzymes to replace more toxic, irreversible inhibitors like disulfiram. At the time of development DEAB was found to be a potent inhibitor of cytosolic ALDH (ALDH1) but not mitochondrial ALDH (ALDH2) [21]. Consequently, the Aldefluor Assay was thought to identify cellular ALDH1A1 activity, suggesting that the ALDH1A1 isoenzyme was responsible for the vast majority of ALDH activity seen in stem cells. However recent studies have reported that DEAB inhibits other ALDH isoenzymes and therefore the Aldefluor Assay will detect stem cells with other ALDH isoenzyme activity, including ALDH1A2, ALDH1A3, and ALDH2 [22,23].
In this report, we used purified recombinant proteins to examine the effect of DEAB on the activity of nine ALDH isoenzymes. DEAB was found to be an excellent substrate for ALDH3A1. DEAB is also a substrate for ALDH1A1, ALDH1A3, ALDH1B1, ALDH5A1 but the turnover rates are so slow that it behaves as an inhibitor for more rapidly metabolized substrate aldehydes. No appreciable turnover of DEAB was observed with either ALDH1A2 or ALDH2, where DEAB behaves as a covalent inhibitor for both isoenzymes. DEAB appears neither to be a substrate nor an inhibitor for either ALDH1L1 or ALDH4A1. Enzyme kinetics and mass spectrometry were used to develop a mechanism by which DEAB exerts its inhibitory effect on these ALDH isoenzymes.
2. Materials and methods
2.1. Materials
Reagents, including acetaldehyde, propionaldehyde, NAD+, and buffers were all purchased from Sigma Aldrich unless where otherwise noted.
2.2. ALDH expression and purification
ALDH1A1, ALDH1A2, ALDH1A3, ALDH1B1, ALDH2, and ALDH3A1 were produced and purified as previously described [24–26]. Production of ALDH1B1 and ALDH1A3 in Escherichia coli yielded very little protein, limiting their use. The carboxyl terminus of rat ALDH1L1 was generously provided by Sergey Krupenko in the pRSET expression plasmid. The full length cDNA for human ALDH4A1 and ALDH5A1 were generously provided by Daria Mochly-Rosen. ALDH4A1 was subcloned into the pET-28a expression plasmid and ALDH5A1 into pTrcHis-Topo. ALDH1L1, ALDH4A1, and ALDH5A1 were expressed and purified as previously described for ALDH3A1[25] with the following modifications: (1) for ALDH1L1 and ALDH5A1 the growth medium contained 100 lg/mL ampicillin, (2) cells were lysed via 3 passages through a microfluidizer (DivTech Equipment), and (3) a single passage on a nickel-NTA column was used for purification. Purified enzymes were frozen in liquid nitrogen and stored at −80 °C in concentrations of 0.5–8.0 mg/mL.
2.3. Wavelength scans to monitor DEAB oxidation
Wavelength scans were performed on the Cary 300 Bio UV-vis spectrophotometer to monitor changes in absorbance that could indicate DEAB was acting as a substrate. Scans were performed in 1-mL quartz cuvettes and unless where noted contained 500 nM enzyme, 10 μM DEAB, and 200 μM NAD+ in 50 mM sodium BES pH 7.5 at 25 °C. To confirm enzyme activity, a known substrate for each enzyme was added after completion of the scan to verify that the enzyme and assay conditions were functional.
2.4. Enzyme kinetics with DEAB as a substrate
To monitor ALDH1A1 and ALDH3A1 activity using DEAB as a substrate, it was necessary to determine both what wavelength to monitor and the differential molar extinction coefficient between DEAB and NADH at that wavelength. As the reaction time progressed, we observed a decrease in absorbance at 360 nm due to loss of DEAB and an increase in absorbance at 300 nm and 340 nm due to increases in product formation, diethylaminobenzoic acid and NADH, respectfully. The largest molar extinction coefficient difference between DEAB and NADH was seen at 360 nm and this wavelength was used for these kinetic assays (molar extinction coefficient of 30,160 M−1 cm−1). For ALDH3A1, the data was fitted to the substrate inhibition curve using SigmaPlot (StatSys v12.3) and the values represent the average of three independent experiments (each n = 3).
2.5. DEAB inhibition and IC50 determination
DEAB inhibition and IC50 curves were assayed spectrophotometrically by monitoring the formation of NADH at 340 nm (molar extinction coefficient of 6220 MT−1 cm−1) on a Beckman DU-640 or Cary 300 Bio UV-vis spectrophotometer using purified recombinant ALDH1A1, ALDH1A2, ALDH1A3, ALDH1B1, ALDH1L1, ALDH2, ALDH4A1, and ALDH5A1. All assays were performed at 25 °C Following a two minute incubation of enzyme with DEAB and NAD+, the reactions were initiated by adding substrate. With the exception of ALDH1L1, ALDH4A1 and ALDH5A1, reactions were. performed in a solution containing 100–200 nM enzyme, 200 μM NAD+, 1% DMSO, and 100–200 μM propionaldehyde in 50 mM sodium BES pH 7.5. For ALDH4A1, reactions contained 20 mM propionaldehyde and 1.5 mM NAD+. For ALDH5A1, reactions contained 2 mM propionaldehyde and 1.5 mM NAD+. For ALDH1L1, reactions contained 500 nM enzyme, 4 mM propionaldehyde and 500 μM NADP+. For enzymes that showed inhibition by DEAB, IC50 values for propionaldehyde oxidation were calculated by varying the concentration of DEAB from 0 to 20 μ.M. Higher concentrations of DEAB were not used due to interference at 340 nm. However there was little to no interference at lower DEAB concentrations. Data were fit to the four parameter EC50 equation using SigmaPlot (StatSys v12.3) and the values represent the average of three independent experiments (each n = 3).
2.6. Mode of inhibition for ALDH1A1
For ALDH1A1, the mode of inhibition was determined via steady-state kinetics by co-varying DEAB and acetaldehyde concentrations at fixed concentration of NAD+ and assayed spectrophotometrically by monitoring the formation of NADH at 340 nm (molar extinction coefficient of 6220 M−1 cm−1) on a Beckman DU-640. Reactions contained 150 nM ALDH1A1, 1% DMSO, 100–800 μM acetaldehyde (Km = 180 μM), 0–25 nM DEAB, and 500 μM NAD+ (Km = 55 μM) in 50 mM sodium BES, pH 7.5 at 25 °C. All data were fit to competitive, noncompetitive, uncompetitive, and mixed inhibition models using tight binding inhibition programs in SigmaPlot (StatSys v12.3). The appropriate model was selected through analysis of goodness-of-fit and the residuals of those fits. The values represent the average of three independent experiments (each n = 3) using at least two protein preps.
2.7. Kinetics of irreversible inhibition for ALDH1A2 and ALDH2
For ALDH1A2, solutions containing 100 nM enzyme, 0.1–2.0 μM DEAB, and 1.5 mM NAD+ in 50 mM sodium BES, pH 7.5 were incubated at 25 °C. For ALDH2, solutions containing 100 nM enzyme, 100–400 nM DEAB, and 1.5 mM NAD+ in 50 mM sodium BES, pH 7.5 were incubated at 25 °C. At the designated time point, the remaining enzyme activity was determined spectrophotometrically by adding a saturating amount of propionaldehyde (1.0 mM) and monitoring NADH production at 340 nm on a Beckman DU-640. This concentration of propionaldehyde is sufficient to prevent any additional DEAB-dependent inactivation of both ALDH1A2 and ALDH2, thereby obviating the need for sample dilution prior to assay. The apparent bimolecular rate constants for inactivation were determined using traditional linear analysis of covalent enzyme inactivation [27]:
The values represent the average ± SE of three independent experiments, with ALDH1A2 at n = 2 and ALDH2 at n = 3. To assess whether treatment of DEAB leads to irreversible covalent modification of ALDH2 and ALDH1A2, 10 μM of each enzyme was pre-incubated with 100 μM DEAB in the presence or absence of 1 mM NAD+ for 30 min (1 mL total reaction volume). Samples (20μL) were removed for enzyme activity determination in 1 mL assays. The samples were then dialyzed separately against 4 L of 30 mM BES, pH 7.5 for four hours. The dialysis buffer used for the NAD+-containing incubation also contained 1 mM NAD+. Control reactions contained 10 μM ALDH2 or ALDH1A2 were identically treated to a 30 min incubation in the absence of DEAB and dialyzed in separate 4 L containers. Dehydrogenase activity was measured from 20 μL aliquots before and after dialysis using 1.5 mM NAD+ and 1 mM propionaldehyde in a 1 mL assay volume. The post-dialysis measurements were normalized to control by adjusting for the concentration of protein in each sample.
2.8. Mass spectrometry
Complexes for analysis by mass spectrometry were formed from 2.5–10.0 μM of the ALDH isoenzyme with 10 μM DEAB with or without 100–500 μM NAD+ and incubated for 1 h at room temperature in 10 mM HEPES, pH 7.5. Samples (0.5–5 μL) were injected using an Agilent 1200SL HPLC with a low rate of 0.3 mL/min consisting of 70% H2O and 30% acetonitrile with 0.1% formic acid into an Agilent 6520 quadrupole-time of flight (Q-TOF) mass spectrometer operating in TOF mode. The spectra were extracted and deconvoluted using MassHunter and Bioconfirm software.
3. Results
DEAB shows a characteristic absorbance peak near 360 nm, while the oxidized product N,N-diethylaminobenzoic acid shows an absorbance peak at 300 nm (Fig. 2). If DEAB is a substrate for members of the aldehyde dehydrogenase, it should be possible to monitor the decrease in absorbance at 360 nm and an increase in absorbance at 300 nm. The changes near these absorbance bands will be convolution of the decrease of DEAB, increase of the product acid and the increase in NADH due to its less prominent absorption band at 340 nm (6220 M−1 cm−1). The extinction coefficient for DEAB at 360 nm is 34,380 M−1 cm−1 and the extinction coefficient for diethylaminobenzoic acid at 300 nm is 20,370 MT−1 cm−1. In addition, there are some changes in the absorbance features over time, even in the absence of enzyme (Fig. 3). However, in the presence of five of the nine ALDH enzymes tested, there is an observable increase in the rate of oxidation, indicating that DEAB can act as a substrate for these isoenzymes. For incubations between DEAB and ALDH1A1, the scan shows a loss in absorbance at 360 nm, indicating disappearance of DEAB, plus an increase in absorbance at 300 nm, corresponding to the appearance of the carboxylic acid product (Fig. 4A). With 500 nM ALDH1A1, oxidation of a large percentage of the 10 μM DEAB had occurred in 3.5 h. The strong absorption of DEAB at 360 nm partially masks NADH formation at 340 nm. Monitoring the change in absorbance at 360 nm (molar extinction coefficient of 30,160 MT−1 cm−1), we calculated the ALDH1A1 turnover rate of DEAB at 0.028 ± 0.002 per min. DEAB was turned over very rapidly by ALDH3A1 using only 25 nM enzyme, indicating that it is a very good substrate for this isoenzyme (Fig. 4B). However, with ALDH2 there was only a moderate change in the traces after 4 h, similar to DEAB incubated in the absence of enzyme (Fig. 4C). Wavelength scans for ALDH1A2 and ALDH4A1 were similar to ALDH2, suggesting that DEAB is either an extremely slow substrate or is not turned over by these three isoenzymes. DEAB is a very slow substrate for ALDH1B1 (Fig. 4D) and the wavelength scans for ALDH1A3 and ALDH5A1 were similar to ALDH1B1. For all nine isoenzyme scans, there was no change in absorbance noted from 400 to 600 nm, and even after a 16 h scan, the enzymes were still active and capable of propionaldehyde oxidation.
Fig. 2.
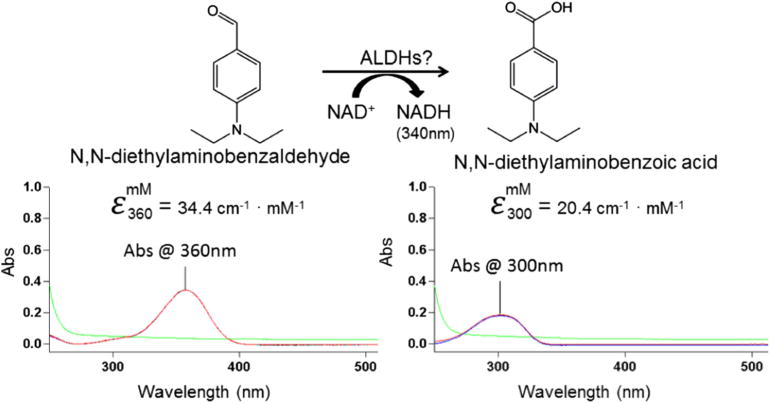
Absorption characteristics of diethylaminobenzaldehyde and diethylaminobenzoic acid. The substrate and product of the reaction absorb at different wavelengths, allowing the reaction to be monitored. For both diethylaminobenzaldehyde and diethylaminobenzoic acid, 10 μM of compound was used. The green trace represents the buffer BES and 100 μM NAD+. (For interpretation of the references to color in this figure legend, the reader is referred to the web version of this article.)
Fig. 3.
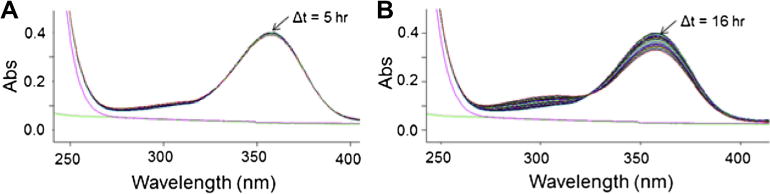
Oxidation of DEAB in the absence of enzyme. Wavelength scans indicate that DEAB oxidizes to its acid at a slow rate in a 50 mM Na+-BES pH 7.5 at 25 °C, the buffer conditions used for wavelength scn assays with the enzymes. No NAD+ is present. The green line represents a water trace while the magenta line is BES alone (no DEAB). Over time, there was a decrease at 360 nm corresponding to DEAB and an increase at 300 nm corresponding to diethylaminobenzaldehyde. (For interpretation of the references to color in this figure legend, the reader is referred to the web version of this article.)
Fig. 4.
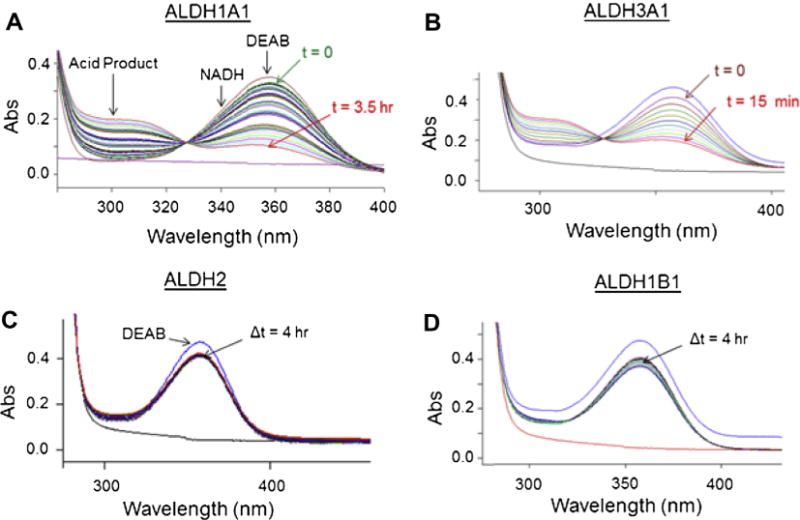
Wavelength scans of ALDH1A1, ALDH3A1, ALDH2, and ALDH1B1 with DEAB. For ALDH1A1 and ALDH2, and ALDH1B1 reactions containing 500 nM enzyme, 200 μM NAD+, and 10 μM DEAB were monitored from 200–600 nm. (A) For ALDH1A1, a gradual decrease at 360 nm and increase at 300 nm is seen, corresponding to substrate lose and product formation, respectfully. (B) For ALDH3A1, the reaction contained 25 nM enzyme, 200 μM NAD+, and 10 μM DEAB and rapid DEAB oxidation occurs. (C) For ALDH2, there is little change in the spectrographic trace after 4 h. (D) ALDH1B1 had more DEAB oxidation then ALDH2 but turnover was still low. For all reactions, no absorption changes were seen above approximately 400 nm.
Wavelength scans indicated that DEAB was turned over by ALDH3A1 much more rapidly than by the other ALDH isoenzymes tested. Kinetic analysis of the saturation profile for DEAB was best fit to the Michaelis–Menton equation modified for substrate inhibition, producing a Km of 5.6 ± 0.7 μM and a Kis of 38.8 ± 3.3 μM (Fig. 5). For comparison, the Km of the commonly used substrate benzaldehyde is 50-fold higher at 280 μM (Table 1).
Fig. 5.
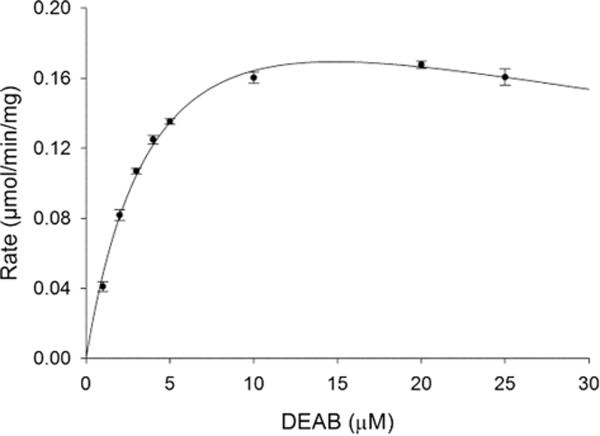
Substrate saturation curve for ALDH3A1 with DEAB as a substrate. This curve represents one of three experiments, each n = 3, it to the substrate inhibition equation.
Table 1.
Kinetic parameters for ALDH3A1 oxidation of DEAB.
| Substrate | KM (mM) | kcat (min−1) | kcat/KM |
|---|---|---|---|
| Benzaldehyde | 280 ± 20 | 1400 ± 60 | 4.9 ± 0.3 |
| DEAB | 5.6 ± 0.7 | 130 ± 20 | 24 ± 1 |
Although DEAB is a substrate for ALDH1A1, ALDH1A3, ALDH1B1, and ALDH5A1, it is turned over at such a slow rate it is effectively an inhibitor for the oxidation of other substrate aldehydes such as acetaldehyde and propionaldehyde. DEAB inhibited six of nine ALDH isoenzymes tested and all had IC50 values less than 15 μM (Table 2). Under the conditions of the experiments, it was a more potent inhibitor for ALDH1A1 (IC50 = 57 ± 5 nM) compared to the other isoenzymes (Fig. 6A). DEAB displayed a competitive mode of inhibition toward ALDH1A1 with respect to varied acetaldehyde with a Ki of 9.8 ± 3.1 nM (Fig. 6B). During IC50 calculations for ALDH2, it was discovered that the IC50 values were dependent on order of addition and incubation times, no inhibition was observed up to 50 μM (maximum concentration used) when the reaction was initiated by adding enzyme, but 160 ± 30 nM following a two minute pre-incubation of enzyme with DEAB and NAD+ and initiating with propionaldehyde. Under these conditions, for both enzymes the propionaldehyde concentration was at least 20-fold greater than Km, but saturation with propionaldehyde did not lead to recovery of full enzymatic activity, suggesting that DEAB is covalently modifying ALDH2. ALDH1A2 behaved in a similar manner. When treated as a covalent irreversible inhibitor, the apparent bimolecular rate constants for inhibition of ALDH1A2 and ALDH2 were 2900 ±160 M−1 s−1 and 85,800 ± 4200 M−1 s−1, respectively (Fig. 7).
Table 2.
Effect of DEAB on ALDH isoenzymes.
| Substrate | IC50 (μM) mean/SEM | Comments | |
|---|---|---|---|
| ALDH1A1 | Yes | 0.057 ±0.005 | Competitive tight inhibition Ki = 10 ± 3 nM |
| ALDH1A2 | No | 1.2 ± 0.1 | Covalent inhibitorapparent bimolecular rate 2900 ± 160 M−1 s−1 |
| ALDH1A3 | Yes (slow) | 3.0 ± 0.3 | |
| ALDH1B1 | Yes (slow) | 1.2 ± 0.1 | |
| ALDH1L1 | No | NI* | |
| ALDH2 | No | 0.16 ± 0.03 | Covalent inhibitor apparent bimolecular rate 86,000 ± 4200 M−1 s−1 |
| ALDH3A1 | Yes | NA# | Km = 5.6 μM |
| ALDH4A1 | No | NI* | |
| ALDH5A1 | Yes (slow) | 13 ± 0.5 |
NI denotes no detectable inhibition.
NA denotes not applicable as an inhibitor.
Fig. 6.
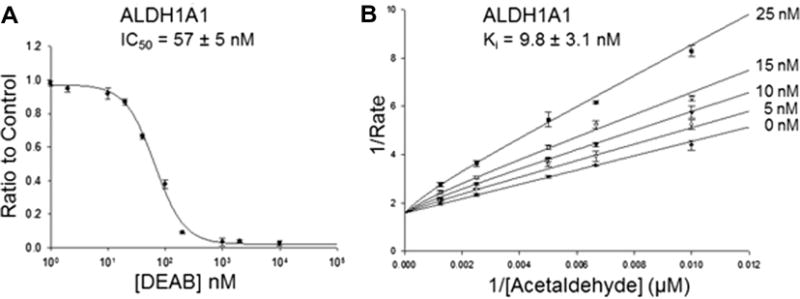
Characterization of ALDH1A1 with DEAB (A) IC50 curve of DEAB with 150 nM ALDH1A1. (B) Lineweaver–Burk plot to determine the Ki of DEAB for ALDH1A1. Each plot represents one of three experiments, with each point representing the average ± SE of three independent readings.
Fig. 7.
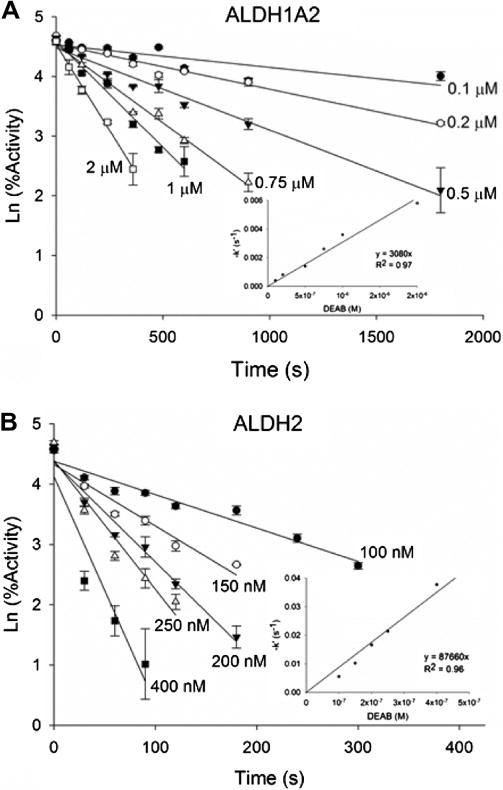
Time dependent inhibition of human (A) ALDH1A2 and (B) ALDH2 with DEAB. For each enzyme, the primary plots show the ln (percentage activity) vs time. The slopes were used to generate the secondary plots, −k′ versus DEAB concentration. The bimolecular rate constant for inhibition for each enzyme was calculated from the slope of the line of the secondary plot. Each plot represents one of three experiments, with ALDH1A2 at n = 2 and ALDH2 at n = 3.
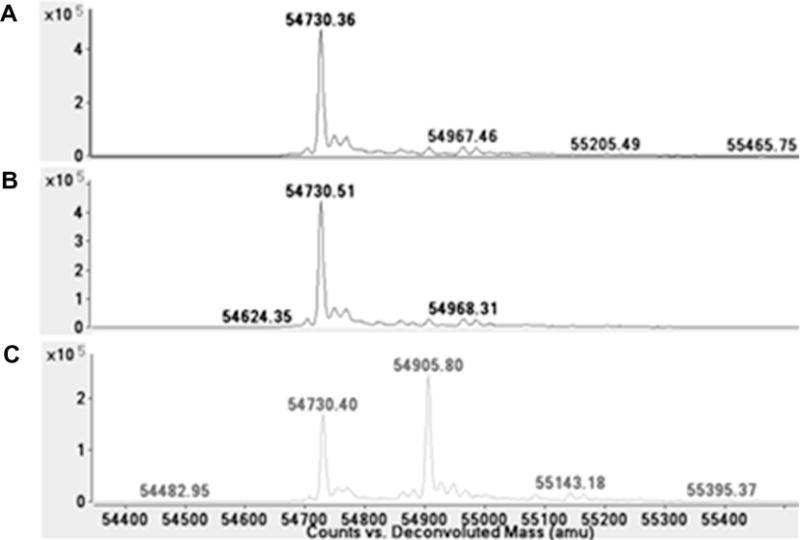
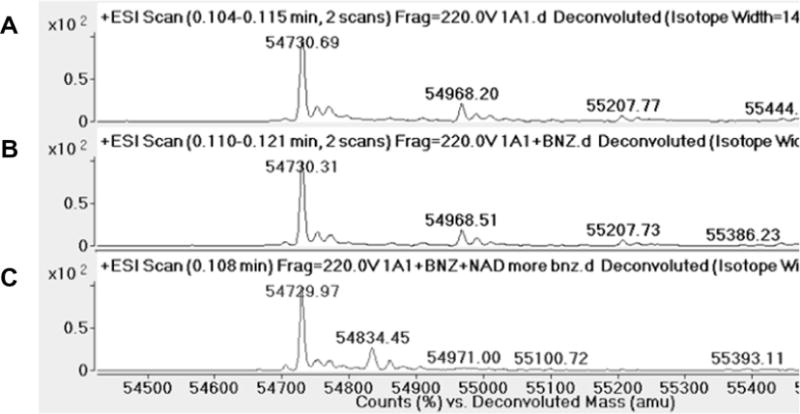
Mass spectrometry was used to determine whether DEAB was covalently binding to the ALDH enzymes. Quadrupole TOF MS of ALDH1A1, ALDH1A2, ALDH1B1, and ALDH2 confirmed that there was an increase in mass of 175 Da, corresponding to DEAB binding with the loss of two protons. With 5 μM ALDH2 alone (Fig. 8A) or incubated with 10 μM DEAB without NAD+ (Fig. 8B) there was a major peak at 54,445 plus a much smaller peak at 54,357, a difference of 87 Da likely corresponding to loss of the N-terminal serine during protein production. ALDH2 incubated with both DEAB and 500 μM NAD+ resulted in a major peak at 54,620 and much smaller peaks at 54,533, 54,445, and 54,357 (Fig. 8C). The peaks at 54,620 and 54,533 represent a shift of 176 Da from 54,445 and 54,357, respectfully, and correspond to DEAB binding to the two major ALDH2 species present in the sample. A similar shift was seen using 2.5 μM MALDH1B1,10 μM DEAB, and 500 μM NAD+ (data not shown). ALDH1B1 alone or incubated with DEAB yielded a major peak at 56,592 and a much smaller peak at 57,200, this latter peak may represent an enzyme species modified by two glutathione molecules. However, incubation of ALDH1B1, DEAB, and NAD+ shifted the major peak to 56,768 with much smaller peaks at 56,592, corresponding to unmodified protein, and 57,375. Both the ALDH2 and ALDH1B1 data indicate that NAD+ must be present for DEAB to modify the enzyme in a manner detectable by mass spectrometry. After a one hour incubation with a 2- to 4-fold molar excess of DEAB, most of the enzyme present had been modified. DEAB also covalently modifies ALDH1A1 in the presence of NAD+ but is not complete (Fig. 9). These shifts in peaks corresponding to DEAB binding with a loss of 2 protons are similar to what is seen with ALDH1A1 and a known substrate benzaldehyde. Using 5 μM ALDH1A1, 1.5 mM NAD+, and 2.5 mM benzaldehyde, there is a 104 Da shift corresponding to the substrate binding to ALDH1A1 with the loss of 2 hydrogens in the presence of enzyme, cofactor, and substrate (Fig. 10). Association of DEAB with ALDH1A1, ALDH1B1, and ALDH2 was dependent on NAD+, but the requirement for NAD+ was not absolute for ALDH1A2. Using 5.0 μM ALDH1A2, 10 μM DEAB, and 500 μM NAD+, enzyme alone yielded a major peak at 56,592 and a much smaller peak at 56,830 (Fig. 11A). When ALDH1A2 is incubated with DEAB, the major peak is still at 56,592 but a large peak is also seen at 56,768, corresponding to DEAB binding to approximately one-third of the ALDH1A2 present, with smaller peaks at 56,830 and 57,007 (Fig. 11B). Following incubation of ALDH1A2, DEAB, and NAD+, the major peak was seen at 56,768, with smaller peaks at 56,592 and 57,006 (Fig. 11C). These results imply that DEAB may bind to ALDH1A2 independent of the presence of coenzyme. However, it may be possible that oxidized coenzyme co-purifies with ALDH1A2. To determine whether NAD+ is present from the ALDH1A2 protein purification, 500 μM propionaldehyde was added to 18 μM ALDH1A2 without additional NAD+ and monitored for 15 min. There was no change at 340 nm, indicating that NADH is not being produced in this reaction. This suggests that NAD+ is, at a minimum, not present at the molar ratio levels suggested by mass spectrometry, since reactions using only 5 μM NAD+ produce an observable change at 340 nm. To confirm covalent modification and investigate the requirement for NAD+ to inactivate ALDH2 and ALDH1A2, the enzymes were incubated in the presence of DEAB with and without NAD+ and then dialyzed for 4 h against a 4000-fold excess of buffer. Relative to control samples incubated in the absence of DEAB, neither the ALDH2 nor the ALDH1A2 samples regained enzymatic activity when DEAB and NAD+ were present in the incubation, consistent with irreversible, covalent modification (Fig. 12). In contrast to the level of inactivation observed with DEAB and NAD+, incubation of enzyme plus DEAB alone, resulted in only partial inactivation of both ALDH2 and ALDH1A2. Dialysis had no impact on the level of inactivation for ALDH2, but the ALDH1A2sample recovered 75%ofthe control activity, suggesting the latter modification is, in part, reversible (Fig. 12).
Fig. 8.
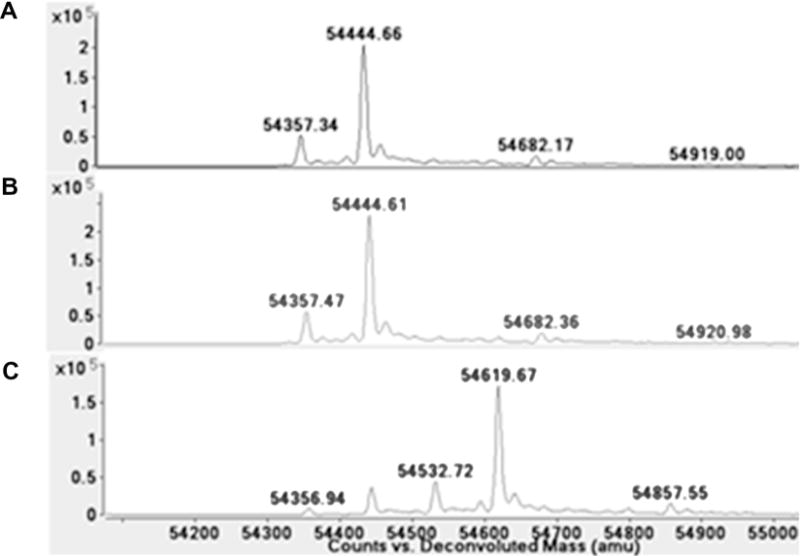
Modification of human ALDH2 with DEAB. Deconvoluted spectrum of (A) ALDH2, (B) ALDH2 incubated with 2-fold molar excess of DEAB, and (C) ALDH2 incubated with 2-fold molar excess of DEAB and saturating NAD+.
Fig. 9.
Modification of human ALDH1A1 with DEAB. Deconvoluted spectrum of (A) ALDH1A1, (B) ALDH1A1 incubated with 10-fold molar excess of DEAB, and (C) ALDH1A1 incubated with 10-fold molar excess of DEAB and saturating NAD+.
Fig. 10.
Modification of human ALDH1A1 with benzaldehyde. Deconvoluted spectrum of (A) ALDH1A1, (B) ALDH1A1 incubated with 500-fold molar excess of benzaldehyde, and (C) ALDH1A1 incubated with 500-fold molar excess of benzaldehyde and saturating NAD+.
Fig. 11.
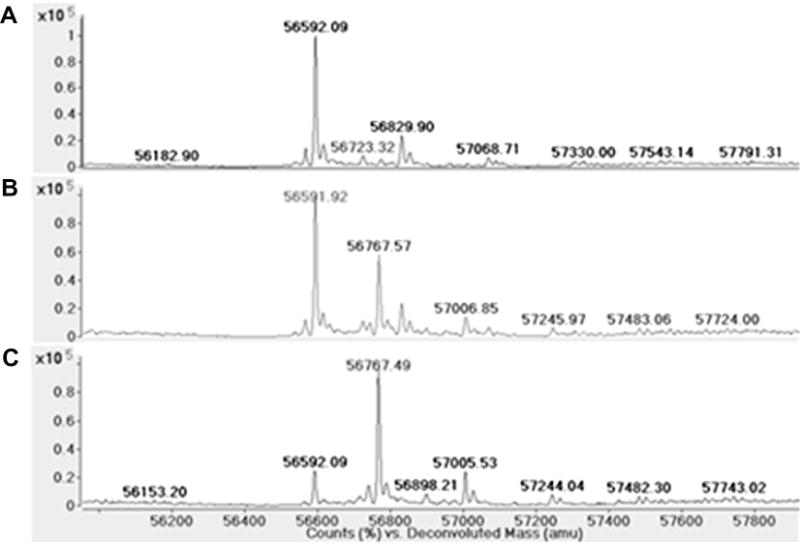
Modification of human ALDH1A2 with DEAB. Deconvoluted spectrum of (A) ALDH1A2, (B) ALDH1A2 incubated with 2-fold molar excess of DEAB, and (C) ALDH1A2 incubated with 2-fold molar excess of DEAB and saturating NAD+.
Fig. 12.
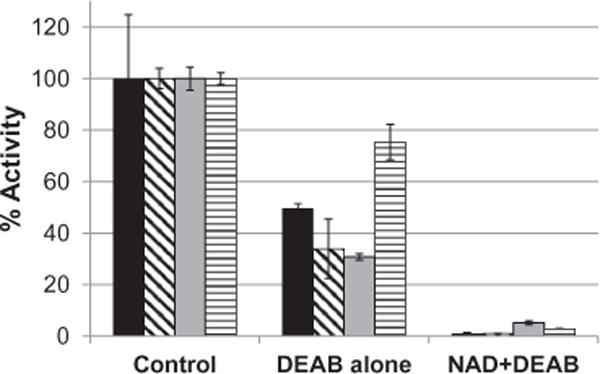
Effects of Dialysis on DEAB-induced inhibition. ALDH1A2 and ALDH2 were pre-incubated for 30 min with DEAB in the presence or absence of NAD+. Solutions were dialyzed for 4 h against a 4000-fold excess of buffer and the activity post-dialysis compared to the levels prior to dialysis. ALDH2 prior to dialysis (■), ALDH2 following dialysis (▧), ALDH1A2 prior to dialysis (□), ALDH1A2 following dialysis (▤).
4. Discussion
A number of isoenzymes in the aldehyde dehydrogenase superfamily have been linked to both normal and cancer stem cells. The Aldefluor assay relies on their aldehyde oxidation abilities to identify and segregate stem cells with high levels of ALDH activity. Inhibition of ALDHs by DEAB, an aldehyde, is used as a control. The concept of substrates as inhibitors is not new. A number of organophosphorus compounds are esters that inhibit cholinesterase by acetylating the enzyme in a process similar to its normal substrate acetylcholine. As discussed by Aldridge, the only difference between a substrate (acetylcholine) and an inhibitor (i.e. dimethylphosphates) is the rate of reaction [28]. In this paper, we have shown that DEAB is both a substrate and an inhibitor for certain ALDH isoenzymes and that the rate of reaction, namely hydrolysis, determines whether the compound behaves as a classic substrate (ALDH3A1), as a covalent inhibitor, (ALDH2 and ALDH1A2), or as an intermediate between substrate and inhibitor (ALDH1A1, ALDH1A3, ALDH1B1, and ALDH5A1). We propose that differences in residues at the substrate binding sites of the isoenzymes are capable of stabilizing the acyl-enzyme intermediate to varying degrees. In ALDH3A1, little to no stabilization occurs and DEAB is quickly turned over, resulting in a low micromolar KM. For ALDH2 and ALDH1A2, the acyl-enzyme is very stable and little observable turnover occurs, thus mimicking a covalent inhibitor. However we do believe these two enzymes are capable of eventually oxidizing DEAB at an extremely low rate. We propose that structural features within their respective active sites are capable of stabilizing a resonance structure intermediate (Fig. 13).
Fig. 13.
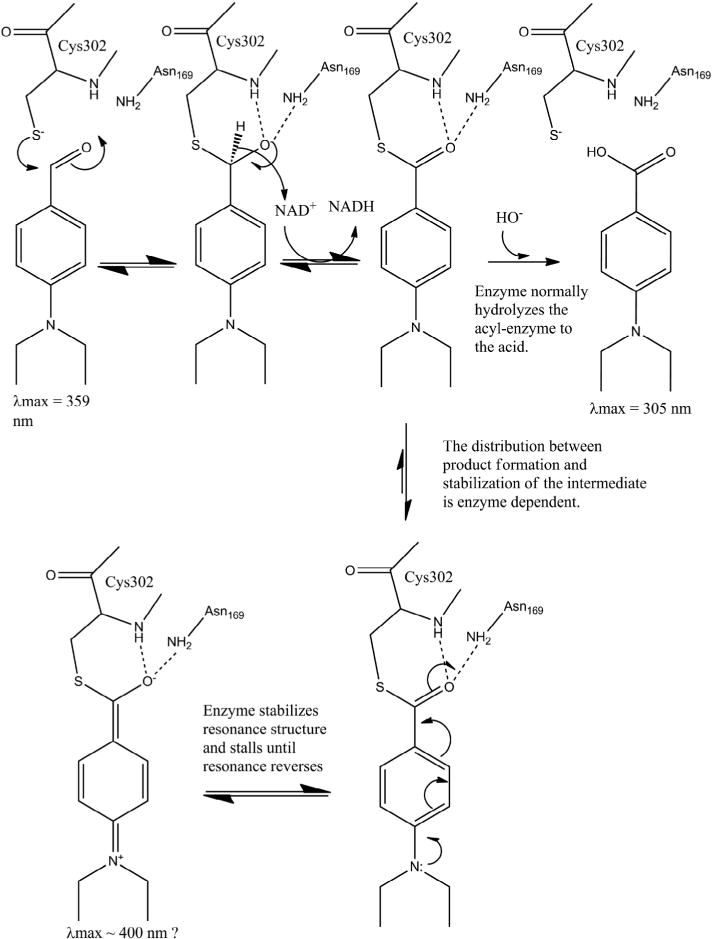
Proposed mechanism of action of DEAB on ALDH enzymes.
Based on the kinetic and mass spectrometry data we propose that DEAB functions as a substrate for all enzymes through the hydride transfer step, but that the acyl-enzyme intermediate is slowed for hydrolysis by a resonance structure available to the thioester intermediate due to the lone pair of electrons on the para-diethylamino substituent (Fig. 13). The addition of the lone pair into the aromatic ring resonance promotes the formation of a quinoid-like structure where the extra electrons now reside on the carbonyl oxygen atom where it is stabilized by the oxy-anion hole comprised of the peptide amide nitrogen of the catalytic nucleophile and the side chain amide nitrogen of the residue equivalent to Asn169 in ALDH2. The intermediate stabilized in this manner makes the carbonyl carbon less susceptible to attack by a hydroxyl ion. The extent that this resonance structure forms and the duration of its stabilization would appear to differ between the various isoenzymes with which DEAB forms productive interactions. Mass spectroscopy data shows no evidence of additional hydrolytic breakdown of the aromatic imine compound during the timeframe of the MS experiment.
The fact that DEAB is an excellent substrate for ALDH3A1 is not altogether surprising, since the enzyme is known to prefer aromatic substrates over linear aliphatic substrates [29,30]. It is interesting that even for ALDH3A1, the kcat is lower for DEAB than for benzaldehyde by an order of magnitude, making DEAB, by definition, a slow substrate. Thus, only the fact that the KM for DEAB is ~50-fold lower than for benzaldehyde places the catalytic efficiency for DEAB amongst the best for known substrates. For acetaldehyde and benzaldehyde, hydride transfer is known to be rate-limiting for catalysis in ALDH3A1 [10], implying that either hydride transfer is 11-fold slower for DEAB or another step has become rate-limiting. We suggest that acyl-enzyme hydrolysis has become rate-limiting due to the potential for resonance stabilization of the acyl-enzyme intermediate and the fact that the electronic properties of DEAB should promote easier extraction of the hydride ion from the thiohemiacetal. Measurements of the isotope effects or stopped-flow analyses will be necessary to distinguish between these or other mechanistic possibilities for ALDH3A1. However, it is clear that the acyl-enzyme intermediate formed between ALDH3A1 and DEAB is the shortest lived of any ALDH acyl-enzyme species by at least 3-orders of magnitude. The short life-time may be influenced by the curved nature of the enzyme’s substrate-binding site [26], which likely distorts the planar conformations required to maintain the aromatic quinoid resonance state.
DEAB is a good to excellent inhibitor for all but three of the ALDH isoenzymes examined, with IC50 values ranging between 57 nM to 13 μM. The most potent inhibition by DEAB is toward ALDH1A1, followed by ALDH2, ALDH1A2, ALDH1B1, ALDH1A3 and ALDH5A1. However, the relative order for enzymatic turnover follows the order ALDH1A1 > ALDH1B1, ALDH1A3, ALDH5A1 > ALDH1A2, ALDH2. Thus, it would seem that the two properties of DEAB, inhibition vs substrate, are not directly correlated. DEAB demonstrates the most potent inhibition for ALDH1A1 with an IC50 of 57 nM and competitive mode of inhibition toward acetaldehyde with a Ki of 10 nM. Consequently, despite the low turnover of this complex (0.028 min−1), these properties give rise to a pseudo-bimolecular rate constant of ~47,000 M−1 s−1, which is within a factor of two for the value obtained for DEAB inactivation of ALDH2 at 86,000 M−1 s−1. Both these values imply a rapid association between enzyme and DEAB. ALDH1A2 is 20- to 30-fold slower, correlating with its 10- to 100-fold higher IC50 values. The interactions between DEAB and ALDH1A3 or ALDH1B1 are similar to ALDH1A2, although these enzymes do show very slow turnover of their respective enzyme-DEAB complexes.
An inspection of the respective active site structures fails to identify consistent differences in residues lining the substrate sites that correlate with all the features of DEAB interactions. ALDH1A1 is the most wide open substrate binding site which is best described as a flattened funnel shape, due to Gly substitutions at both positions 125 and 458 and Val at positions 174 and 460 [26]. The ALDH1A2, ALDH1A3 and ALDH1B1enzymes have substrate sites more similar to the cylindrical site in ALDH2 [26] and perhaps these sites better constrain the aromatic system to remain planar, thereby increasing the residency time of the quinoid intermediate and slowing hydrolysis. The active site structure of ALDH5A1 (PDB code 2W8R, [31]) is next most similar to ALDH2, but its low reactivity toward DEAB may be due to the presence of two characteristic arginine residues near the middle and outer regions of the substrate site, R213 and R334. Presumably, the binding site in ALDH5A1 does not stabilize the acyl-enzyme intermediate sufficiently to prevent turnover.
That DEAB fails to inhibit ALDH1L1 and ALDH4A1, suggests that elements of the substrate binding site in these isoenzymes are incompatible with forming a productive thiohemiacetal intermediate with DEAB in the first place. ALDH1L1 has a very narrow active site surrounding the catalytic nucleophile which may exclude aromatic substrates from its active site. In agreement with this observation, aromatic aldehydes are poor substrates for ALDH1L1. In the case of ALDH4A1 (PDB code 4LH2, [32]), it is the outer region of the substrate binding site that is narrowed which may prevent DEAB association.
5. Conclusions
DEAB possesses all the characteristics of a substrate for many ALDH isoenzymes, especially ALDH3A1. However, its particular electronic properties give rise to a stalled acyl-enzyme intermediate in ALDH isoenzymes that can stabilize its electronic resonance structure, making DEAB a mechanism-based inhibitor for ALDH2 and ALDH1A2, a very slow substrate for ALDH1A3, ALDH1B1 and ALDH5A1, and finally a slow substrate for ALDH1A1. In contrast, DEAB is neither a substrate nor an inhibitor for ALDH1L1 or ALDH4A1. The broad and varied nature of the interaction between DEAB and ALDH isoenzyme suggests that its use as an inhibitor or competitive substrate in the Aldefluor assay, should be interpreted with caution with respect to which particular ALDH isoenzymes contribute to the observed signal in the flow-cytometry assay.
Acknowledgments
The authors would like to thank Lan Min Zhai for help with the production and purification of the various ALDH isozymes, Dr. Sergey Krupenko for providing the rat ALDH1L1 expression clone and Drs. Daria Mochly-Rosen and Che-Hong Chen for providing the human ALDH4A1 and ALDH5A1 expression clones. This research was supported by NIH R01-AA018123.
Footnotes
Conflict of Interest
Thomas D. Hurley holds significant financial equity in SAJE Pharma, LLC. However, none of the work described in this study is related to, based on or supported by the company.
Transparency Document
The Transparency document associated with this article can be found in the online version.
References
- 1.Rizzo WB, Carney G. Sjogren-Larsson syndrome: diversity of mutations and polymorphisms in the fatty aldehyde dehydrogenase gene (ALDH3A2) Hum Mutat. 2005;26(1):1–10. doi: 10.1002/humu.20181. [DOI] [PubMed] [Google Scholar]
- 2.Vasiliou V, Pappa A. Polymorphisms of human aldehyde dehydrogenases. Consequences for drug metabolism and disease. Pharmacology. 2000;61(3):192–198. doi: 10.1159/000028400. [DOI] [PubMed] [Google Scholar]
- 3.Jackson B, et al. Update on the aldehyde dehydrogenase gene (ALDH) superfamily. Hum Genomics. 2011;5(4):283–303. doi: 10.1186/1479-7364-5-4-283. [DOI] [PMC free article] [PubMed] [Google Scholar]
- 4.Pors K, Moreb JS. Aldehyde dehydrogenases in cancer: an opportunity for biomarker and drug development? Drug Discovery Today. 2014 doi: 10.1016/j.drudis.2014.09.009. [DOI] [PubMed] [Google Scholar]
- 5.Koppaka V, et al. Aldehyde dehydrogenase inhibitors: a comprehensive review of the pharmacology, mechanism of action, substrate specificity, and clinical application. Pharmacol Rev. 2012;64(3):520–539. doi: 10.1124/pr.111.005538. [DOI] [PMC free article] [PubMed] [Google Scholar]
- 6.Farres J, et al. Investigation of the active site cysteine residue of rat liver mitochondrial aldehyde dehydrogenase by site-directed mutagenesis. Biochemistry. 1995;34(8):2592–2598. doi: 10.1021/bi00008a025. [DOI] [PubMed] [Google Scholar]
- 7.Wang X, Weiner H. Involvement of glutamate 268 in the active site of human liver mitochondrial (class 2) aldehyde dehydrogenase as probed by site-directed mutagenesis. Biochemistry. 1995;34(1):237–243. doi: 10.1021/bi00001a028. [DOI] [PubMed] [Google Scholar]
- 8.Blackwell LF, et al. Evidence that the slow conformation change controlling NADH release from the enzyme is rate-limiting during the oxidation of propionaldehyde by aldehyde dehydrogenase. Biochem J. 1987;242(3):803–808. doi: 10.1042/bj2420803. [DOI] [PMC free article] [PubMed] [Google Scholar]
- 9.Weiner H, Hu JH, Sanny CG. Rate-limiting steps for the esterase and dehydrogenase reaction catalyzed by horse liver aldehyde dehydrogenase. J Biol Chem. 1976;251(13):3853–3855. [PubMed] [Google Scholar]
- 10.Mann CJ, Weiner H. Differences in the roles of conserved glutamic acid residues in the active site of human class 3 and class 2 aldehyde dehydrogenases. Protein Sci. 1999;8(10):1922–1929. doi: 10.1110/ps.8.10.1922. [DOI] [PMC free article] [PubMed] [Google Scholar]
- 11.Wang MF, Han CL, Yin SJ. Substrate specificity of human and yeast aldehyde dehydrogenases. Chem Biol Interact. 2009;178(1–3):36–39. doi: 10.1016/j.cbi.2008.10.002. [DOI] [PubMed] [Google Scholar]
- 12.Yao L, et al. Inhibition of aldehyde dehydrogenase-2 suppresses cocaine seeking by generating THP, a cocaine use-dependent inhibitor of dopamine synthesis. Nat Med. 2010;16(9):1024–1028. doi: 10.1038/nm.2200. [DOI] [PMC free article] [PubMed] [Google Scholar]
- 13.Chen CH, et al. Activation of aldehyde dehydrogenase-2 reduces ischemic damage to the heart. Science. 2008;321(5895):1493–1495. doi: 10.1126/science.1158554. [DOI] [PMC free article] [PubMed] [Google Scholar]
- 14.Kastan MB, et al. Direct demonstration of elevated aldehyde dehydrogenase in human hematopoietic progenitor cells. Blood. 1990;75(10):1947–1950. [PubMed] [Google Scholar]
- 15.Jones RJ, et al. Assessment of aldehyde dehydrogenase in viable cells. Blood. 1995;85(10):2742–2746. [PubMed] [Google Scholar]
- 16.Hilton J. Role of aldehyde dehydrogenase in cyclophosphamide-resistant L1210 leukemia. Cancer Res. 1984;44(11):5156–5160. [PubMed] [Google Scholar]
- 17.Lapidot T, et al. A cell initiating human acute myeloid leukaemia after transplantation into SCID mice. Nature. 1994;367(6464):645–648. doi: 10.1038/367645a0. [DOI] [PubMed] [Google Scholar]
- 18.Al-Hajj M, et al. Prospective identification of tumorigenic breast cancer cells. Proc Natl Acad Sci USA. 2003;100(7):3983–3988. doi: 10.1073/pnas.0530291100. [DOI] [PMC free article] [PubMed] [Google Scholar]
- 19.Storms RW, et al. Isolation of primitive human hematopoietic progenitors on the basis of aldehyde dehydrogenase activity. Proc Natl Acad Sci USA. 1999;96(16):9118–9123. doi: 10.1073/pnas.96.16.9118. [DOI] [PMC free article] [PubMed] [Google Scholar]
- 20.Ginestier C, et al. ALDH1 is a marker of normal and malignant human mammary stem cells and a predictor of poor clinical outcome. Cell Stem Cell. 2007;1(5):555–567. doi: 10.1016/j.stem.2007.08.014. [DOI] [PMC free article] [PubMed] [Google Scholar]
- 21.Russo JE, Hauguitz D, Hilton J. Inhibition of mouse cytosolic aldehyde dehydrogenase by 4-(diethylamino)benzaldehyde. Biochem Pharmacol. 1988;37(8):1639–1642. doi: 10.1016/0006-2952(88)90030-5. [DOI] [PubMed] [Google Scholar]
- 22.Marcato P, et al. Aldehyde dehydrogenase activity of breast cancer stem cells is primarily due to isoform ALDH1A3 and its expression is predictive of metastasis. Stem Cells. 2011;29(1):32–45. doi: 10.1002/stem.563. [DOI] [PubMed] [Google Scholar]
- 23.Moreb JS, et al. The enzymatic activity of human aldehyde dehydrogenases 1A2 and 2 (ALDH1A2 and ALDH2) is detected by Aldefluor, inhibited by diethylaminobenzaldehyde and has significant effects on cell proliferation and drug resistance. Chem Biol Interact. 2012;195(1):52–60. doi: 10.1016/j.cbi.2011.10.007. [DOI] [PMC free article] [PubMed] [Google Scholar]
- 24.Hammen PK, et al. Multiple conformations of NAD and NADH when bound to human cytosolic and mitochondrial aldehyde dehydrogenase. Biochemistry. 2002;41(22):7156–7168. doi: 10.1021/bi012197t. [DOI] [PubMed] [Google Scholar]
- 25.Parajuli B, et al. Discovery of novel regulators of aldehyde dehydrogenase isoenzymes. Chem Biol Interact. 2011;191(1–3):153–158. doi: 10.1016/j.cbi.2011.02.018. [DOI] [PMC free article] [PubMed] [Google Scholar]
- 26.Parajuli B, et al. Development of Selective Inhibitors for Human Aldehyde Dehydrogenase 3A1 (ALDH3A1) for the Enhancement of Cyclophosphamide Cytotoxicity. ChemBioChem. 2014 doi: 10.1002/cbic.201300625. [DOI] [PMC free article] [PubMed] [Google Scholar]
- 27.Parsons ZD, Gates KS. Redox regulation of protein tyrosine phosphatases: methods for kinetic analysis of covalent enzyme inactivation. Methods Enzymol. 2013;528:129–154. doi: 10.1016/B978-0-12-405881-1.00008-2. [DOI] [PubMed] [Google Scholar]
- 28.Aldridge WN, Reiner E. Frontiers of biology (Amsterdam) Amsterdam: North-Holland Pub. Co; 1972. Enzyme inhibitors as substrates. Interactions of esterases with esters of organophosphorus and carbamic acids; p. xvi.p. 328. [Google Scholar]
- 29.Pappa A, et al. Human aldehyde dehydrogenase 3A1 (ALDH3A1): biochemical characterization and immunohistochemical localization in the cornea. Biochem J. 2003;376(Pt 3):615–623. doi: 10.1042/BJ20030810. [DOI] [PMC free article] [PubMed] [Google Scholar]
- 30.Marselos M, Lindahl R. Substrate preference of a cytosolic aldehyde dehydrogenase inducible in rat liver by treatment with 3-methylcholanthrene. Toxicol Appl Pharmacol. 1988;95(2):339–345. doi: 10.1016/0041-008x(88)90170-6. [DOI] [PubMed] [Google Scholar]
- 31.Kim YG, et al. Redox-switch modulation of human SSADH by dynamic catalytic loop. EMBO J. 2009;28(7):959–968. doi: 10.1038/emboj.2009.40. [DOI] [PMC free article] [PubMed] [Google Scholar]
- 32.Pemberton TA, Tanner JJ. Structural basis of substrate selectivity of Delta(1)-pyrroline-5-carboxylate dehydrogenase (ALDH4A1): semialdehyde chain length. Arch Biochem Biophys. 2013;538(1):34–40. doi: 10.1016/j.abb.2013.07.024. [DOI] [PMC free article] [PubMed] [Google Scholar]