Abstract
Introduction
Acute stress induces increases in plasma inflammatory mediators, which do not habituate to repeated stress. Inflammation is a risk factor for age-related illnesses, highlighting the need to understand factors controlling inflammation. No studies have examined changes in pro- and anti-inflammatory gene expression in response to repeated acute stress in humans.
Methods
RNA was isolated from peripheral blood before, 30 and 120 minutes after exposure of n=32 healthy human participants to the Trier Social Stress Test (TSST) on two days. Gene expression of interleukin (IL)-6, IL-1β, nuclear factor (NF)-κB and IκB was measured repeatedly on both days. We further assessed leukocyte numbers, plasma IL-6, and salivary cortisol.
Results
Stress induced IL-6 (F=44.7; p<0.001) and cortisol responses (F=18.6; p<0.001). Cortisol responses habituated (F=5.1, p=0.003), but IL-6 responses did not (n.s.). All genes increased in response to initial stress (IL-6: F=3.8; p=0.029; IL-1β: F=7.1; p=0.008; NF-κB: F=5.1; p=0.009; IκB; F=4.7; p=0.013) and showed habituation to repeated stress (IL-6: t=2.3; p=0.03; IL-1β: t=3.9; p=0.001; NF-κB: t=2.1; p=0.041; IκB: t=3.1; p=0.005). Day 1 responses of IL-1β and IκB were not explained by changes in leukocyte populations, but IL-6 and NF-κB, as well as most day 2 changes were not independent of leukocyte populations.
Conclusions
Stress response and habituation of pro- and anti-inflammatory gene expression as found here might indicate that even on an intracellular level, inflammatory responses to acute stress are adaptive in that they respond to initial, but habituate to repeated, similar stress. Future studies will need to test whether non-habituation is predictive of disease.
2 Introduction
Life stress has been reported to increase the risk of disease, particularly depression, cardiovascular disease, and cancer (Cohen, Janicki-Deverts, & Miller, 2007). Experiencing stress responses repeatedly over the course of the lifetime may take a toll on the stress response systems, which could explain the link between stress and disease (McEwen, 1998; McEwen & Stellar, 1993). There is great variation in how individuals respond to repeated exposure to stress (Rohleder, 2014; von Kanel, Kudielka, Preckel, Hanebuth, & Fischer, 2006) and this may explain some variability in why some individuals suffer from disease when others do not, when other factors such as lifestyle choices and genetic factors are controlled for. While much is known about how endocrine and extracellular immune mediators such as interleukin-6 (IL-6) respond to repeated acute stress, little is known about how the stress signal is processed within individual cells.
Our understanding of how stress exposure is linked with adverse health outcomes has improved significantly in recent decades. Exposure to chronic life stress has been shown to be prospectively related with morbidity and mortality (Cohen et al., 2007). Chronic stress is associated with elevated plasma concentrations of inflammatory molecules such as IL-6 or CRP (e.g. (Kiecolt-Glaser et al., 2003; Rohleder, Marin, Ma, & Miller, 2009)). Elevation of plasma IL-6 levels is a prime candidate for transducing chronic stress into increased risk of disease, as many diseases are related to inflammation (Rohleder, 2014). For example, resting IL-6 concentrations are positively correlated with the incidence and progression of cardiovascular disease (Black & Garbutt, 2002; Danesh, 1999; Danesh, Collins, Appleby, & Peto, 1998; Pasic, Levy, & Sullivan, 2003).
To understand the underlying mechanisms linking chronic stress to disease, some chronic stress studies have assessed expression of pro- and anti-inflammatory genes. There is strong evidence showing that chronic stress and other negative long-term experience of adverse psychosocial environments leads to gene expression patterns favoring over-activity of the inflammatory system. Chronic stress and low early life social class are associated with increased NF-κB transcription, decreased transcription of glucocorticoid response elements and exaggerated IL-6 responses to lipopolysaccharide challenge (Miller, Chen, et al., 2009; Miller et al., 2008; Miller, Rohleder, & Cole, 2009; Rohleder et al., 2009). Social isolation and rejection have been associated with a distinct gene expression profile characterized by increased transcription pro-inflammatory immune response genes, as well as decreased transcription of antiviral immune response and glucocorticoid response genes in humans and non-human primates (Cole et al., 2007; Murphy, Slavich, Rohleder, & Miller, 2013; Tung et al., 2012).
Less is known about the mechanisms linking everyday acute stress experiences with disease. Stress responses are considered to be adaptive in the short term, but experiencing stress responses repeatedly over the course of the lifetime may under certain conditions take a toll on the stress response systems (McEwen, 1998; McEwen & Stellar, 1993). Daily acute negative experiences might be less taxing as a one-time occurrence compared to severe chronic stress, but more individuals suffer from the more mild repeated acute daily stressors than individuals suffer from severe chronic stress. Recent work has for example shown that heightened affective reactivity to acute daily stressors was related to increased symptoms of affective disorders assessed ten years later (Charles, Piazza, Mogle, Sliwinski, & Almeida, 2013), and greater affective reactivity to such stressors was also found to be associated with increased long-term risk of chronic physical health problems, including cancer, cardiovascular, digestive and pain-related conditions (Charles et al., 2013).
The mechanism underlying these relationships is not well understood, but inflammation, potentially due to inefficient signaling from stress systems, is a likely link. Acute stress activates the sympathetic nervous system (SNS) and hypothalamic pituitary adrenal (HPA) axis (Sapolsky, Romero, & Munck, 2000). SNS activation stimulates release of catecholamines, which bind adrenergic receptors and activate transcription factor Nuclear Factor kappa B (NF-κB) (Bierhaus et al., 2003; Wolf, Rohleder, Bierhaus, Nawroth, & Kirschbaum, 2009), as well as stimulate redistribution of white blood cells (Dhabhar, Malarkey, Neri, & McEwen, 2012). Glucocorticoids released by the HPA-axis inhibit NF-κB by both inhibiting NF-κB DNA binding, and by stimulating IκB transcription (Auphan, DiDonato, Rosette, Helmberg, & Karin, 1995; Scheinman, Cogswell, Lofquist, & Baldwin, 1995), thereby negatively regulating the inflammatory response and helping to bring this component of the immune system back to pre-stress baseline (Bierhaus et al., 2003; Wolf et al., 2009). HPA-axis responses typically habituate to repeated stress, while SNS responses do not habituate (Schommer, Hellhammer, & Kirschbaum, 2003; Strahler, Rohleder, & Wolf, 2014; von Kanel et al., 2006).
Expression of inflammatory genes could therefore be expected to not habituate to repeated stress, caused by sustained stimulation by the SNS, combined with less inhibition by the HPA axis. However, there has been very little work examining inflammatory gene expression responses to acute stress. A study by Nater et. al used a microarray to examine expression of 20,000 genes in response to acute psychosocial stress (TSST) in ten healthy adult men. They found many pathways significantly altered immediately following acute stress, including cell cycle, cell signaling, adhesion and immune responses (Nater et al., 2009). Another study revealed an increase in interleukin-1 expression in PBMCs in response to acute stress (Brydon et al., 2005).
As summarized above, while little is known about intra-cellular responses to stress, no studies have examined how pro- and anti-inflammatory gene expression responds to repeated acute stress in humans, and whether the response habituates. The goal of the current study is to understand the relationship between endocrine and immune responses to repeated stress on an intracellular level. Because previous habituation studies have shown that the largest change in biological stress responses occurs between the first and the second exposure (e.g. Schommer et al. 2003), we here examined expression of pro and anti-inflammatory gene expression responses to an initial laboratory stress test (TSST), and one repeated exposure to the same stress test on the following day. We hypothesized that IL-1β , IL-6 and NF-κB transcription would increase in response to psychosocial stress and would not habituate, in line with SNS responses to repeated stress. We hypothesized that IκB transcription would increase in response to initial stress, but habituate to repeated stress, and contribute to the nonhabituation of IL-6 responses to TSST2 in the absence of cortisol responses (Schommer et al., 2003; von Kanel et al., 2006). Finally, we hypothesized that IL-1β , IL-6, and NF-κB transcription would be positively correlated with the increase in plasma IL-6, and that cortisol responses would predict IκB transcription. As additional validation of the stress responsiveness of the genes selected here we further set out to test whether self-reports of primary stress appraisals, as well as mood changes after stress, were related with changes in gene expression.
3 Methods
3.1 Participants
Data for this work were collected as part of a larger research project conducted over two years to investigate the effects of stress on endocrine and inflammatory parameters. Young adults (age 18–35 yrs.) and older adults (age 50–65 yrs.) were recruited from the Greater Boston area and the Brandeis University campus via newspaper, magazine, and Facebook advertisements. All participants underwent a brief medical and psychological screening by telephone before testing and were invited to participate only if they met following selection criteria: (a) body mass index (BMI) within the reference range between 18 and 35 kg/m2; (b) luteal phase of menstrual cycle at time of participation, for females; (c) absence of psychiatric, endocrine, or cardiovascular diseases, or other specific chronic diseases; (d) no intake of psychoactive drugs, beta-blockers, gonadal steroids (hormonal contraceptives), GCs; (e) non-smoker, and (f) no previous experience with the stress protocol. Individuals were paid for their participation. The final data set consisted of 32 total participants (16 men, 16 women) with a mean age of 38 years (SD=18.1 years) and mean BMI of 24.7 kg/m2 (SD=3.1). One participant was excluded from plasma IL-6 analysis, one participant was excluded from IκB expression analysis and four excluded from IL-6 expression analysis for responses greater than three standard deviations above the mean.
3.2 Procedure
Eligible participants were scheduled for laboratory sessions on two consecutive days. All laboratory sessions were scheduled in the afternoon (13:30–18:30 h) to control for circadian variation of stress hormones. Participants were instructed to refrain from eating or drinking anything but water for one hour before the laboratory sessions. Written informed consent was obtained prior to participation. Weight and body fat measurements were taken using a Seca Supra Plus 720 column scale (Seca, Hamburg, Germany), via a bioelectrical impedance analysis. Height, waist and hip circumference measurements were taken with a tape measure. BMI was expressed in kg/m2. The Brandeis University Institutional Review Board approved all procedures.
Each laboratory session lasted approximately three hours and included a 30-minute resting period followed by exposure to the Trier Social Stress Test (TSST). Saliva samples for measurement of free cortisol were collected using Salivette collection devices (Sarstedt, Nümbrecht, Germany) at baseline, as well as 1, 10, 30, 60 and 120 minutes post TSST on both study days.
At baseline (pre-TSST) and 30 and 120 min post-TSST, blood was drawn via the antecubital vein using a peripheral venous catheter (BD Nexiva IV catheter, Becton–Dickinson, Franklin Lakes, NJ). Initial placement of the catheter was followed by a resting period of 30 min to ensure recovery from potential stress response to catheter placement or traveling to the laboratory. At each of the time points, blood was collected into 9 ml Vacutainers (Becton– Dickinson, Franklin Lakes, NJ) containing EDTA for plasma IL-6 measurement, into 3 ml Vacutainters (Becton–Dickinson, Franklin Lakes, NJ) for the leukocyte count, and into Tempus Blood RNA tubes (Life Technologies, Carlsbad, CA) for RNA isolation. Because previous research has found that inflammatory stress responses peak about 120 minutes post-stressor, blood was drawn at baseline, as well as 30, and 120 min following the TSST on both study days. (Breines et al., 2014; Rohleder, 2014; von Kanel et al., 2006).
3.2.1 Stress Induction Paradigm
Acute psychosocial stress was induced using the Trier Social Stress Test (TSST, (Kirschbaum, Pirke, & Hellhammer, 1993)), a widely used standardized laboratory stress paradigm. The TSST used in the present study consisted of a three-minute preparation period, a five-minute public speech, and a five-minute mental arithmetic task in front of an audience of two judges wearing lab coats and maintaining a neutral evaluative facial expression. The public speech involved describing how one's personality makes one qualified for a dream job and the mental arithmetic ask involved counting backwards from 2043 by deduction of 17 on the first study day and from 2011 by 13 on the second study day. Participants were informed that the judges were trained in analyzing verbal and non-verbal behavior and that their performance would be videotaped. The TSST has demonstrated reliability and validity and has been shown to produce strong biological responses to stress (Dickerson & Kemeny, 2004).
3.3 Measures
3.3.1 Self-reports of psychological health
Depressive symptoms were assessed using the 20-item Center for Epidemiologic Studies Depression Scale (CES-D; (Radloff, 1977)) by which respondents are asked to indicate how often they have felt or behaved in the stated manner over the past week, including statements such as “I felt depressed.” Ratings are made on a 4-point scale (0 = Rarely or none of the time; 3 = Most or all of the time) and final scores are computed by summing scores on all items after reverse scoring four items. The CES-D has demonstrated reliability and validity (Radloff, 1977). In the present study, the CES-D showed good reliability (α= 0.89) and average scores fell below the clinical cut-off of 16 (M = 12.9; SD = 10.9, Range 0-41) (Anderson, Freedland, Clouse, & Lustman, 2001).
Perceived stress over the past month was assessed using the Perceived Stress Scale (PSS, (Cohen, Kamarck, & Mermelstein, 1983)). The PSS is designed to measure how stressful an individual interprets their life to be. Respondents are asked how often they have experienced certain situations and how they have felt about them. Ratings are made on a 5-point scale (0 = Never; 4 = Very Often) and final scores are computed by summing scores on all items after reverse scoring four items. In the present study, the PSS showed good reliability (α= 0.93) and average scores were comparable established age-specific norms (M = 17.1; SD = 8.1, Range 4-32)(Cohen & Williamson, 1988).
Positive and negative affect was assessed after both TSSTs using the Positive and Negative Affect Schedule (PANAS, (Watson, Clark, & Tellegen, 1988)). The PANAS is designed to measure to what extent the individual feels a certain way. Respondents are asked how strongly they feel positive (interested, excited, strong, enthusiastic, proud alert, inspired, determined, attentive and active) and negative (distressed, upset, guilty, scared hostile, irritable, ashamed, nervous, jittery and afraid) emotions post TSST. Ratings are made on a 5-point scale (1 = very slightly or not at all; 5 = extremely) and greater scores on each subset indicate greater positive or negative affect. In the present study, the PANAS showed good reliability (positive affect Day 1: α= 0.93; negative affect Day 1: α= 0.93; positive affect Day 2: α= 0.92; negative affect Day 2: α= 0.90).
Cognitive appraisal was assessed during both TSSTs using the Primary Appraisal Secondary Appraisal Scale (PASA, (Gaab, Rohleder, Nater, & Ehlert, 2005)). In the present study, we used the PASA scales threat and challenge, Ratings are made on a 6-point scale (1 = totally disagree; 6 = totally agree). In the present study, the PASA showed good reliability (threat: α= 0.88; challenge: α= 0.84).
3.3.2 Measurement of endocrine and inflammatory stress responses
To assess HPA axis responses to repeated acute stress, we measured salivary free cortisol. Saliva was chosen because salivary cortisol reflects the unbound portion of cortisol in blood, and therefore provides a more direct measure of biologically active cortisol. Saliva samples were collected at the time points indicated above, salivettes were centrifuged, and saliva was stored at -20 °C until processing. Cortisol was measured using a competitive chemiluminescence immunoassay (CLIA; IBL-International, Toronto, ON, Canada). To assess systemic inflammation at baseline and in response to acute stress, we measured plasma interleukin-6 (IL-6) at baseline (pre-TSST), as well as 30 and 120 min post-TSST on both study days. Blood samples were centrifuged immediately and plasma was aliquoted and stored at -80 °C until batch processing. IL-6 concentrations were determined using a commercial high-sensitivity ELISA (Quantikine HS; R&D Systems, Minneapolis, MN, USA), with a lower limit of detection for IL-6 of 0.09 pg/ml. All intra- and inter-assay CVs were below 10%.
3.3.3 Assessment of Stress-Induced Leukocyte Redistribution
Total white blood cell count (WBC) as well as the numbers and percentages of monocytes were measured using a Coulter AcTdiff2 cell counter (Beckman-Coulter Inc, Breca, CA, USA) in whole blood in order to statistically control for redistribution of leukocyte subpopulations. We focused on total WBC as well as monocytes for the purposes of this study, as psychological stress is known to induce leukocyte redistribution via activation of -adrenergic receptors (Bachen et al., 1995; Benschop, Jacobs, et al., 1996; Benschop, Rodriguez-Feuerhahn, & Schedlowski, 1996). Total white blood cell, monocyte, monocyte percentages were recorded at baseline, 30 and 120 minutes post-TSST.
3.3.4 Gene Expression Analysis
Blood was drawn into tubes containing RNA stabilization solution (Tempus Blood RNA Tube, Life Technologies, Carlsbad, CA) at baseline, 30 and 120-minutes post-TSST. Tempus tubes were stored for up to 5 days at 4°C before RNA isolation. RNA was isolated by commercially available kit (Tempus Spin RNA Isolation Reagent Kit, Life Technologies, Carlsbad, CA). Aliquots were then stored at -80°C until processing. RNA was thawed at room temperature, and placed on ice to prevent degradation. Commercially available primers were used (Life Technologies, Carlsbad, CA), against IL-6 (00985639_m1), IL-1β (01555410_m1), RelA (00153294_m1) and IκB (00153283_m1). One-step RT-PCR was performed using Qiagen Quantifast mastermix kit (Qiagen, Germantown MD) on a RealPlex 4S (Eppendorf, New Brunswick, NJ). The conditions for the RT cycler were 10 minutes at 50°C, 5 minutes at 95°C, and then 40 cycles of 10 seconds at 95°C and 30 seconds at 60°C. Fluorescence data was collected during the extension step of the reaction using 5’ nuclease activity of FAM-labeled TaqMan probes (Life Technologies, Carlsbad, CA). Cycle threshold were calculated using the noisebend feature of the Eppendorf realplex software (Eppendorf, Hamburg, Germany). For each gene, the input of each unknown sample was calculated by the software by using the threshold of detection with the Eppendorf RealPlex software package (Eppendorf, Hamburg, Germany). Expression of IL-6, IL-1β, IκB, and NF-κB was normalized against expression of endogenous control GAPDH, selected because it does not respond to psychosocial stress (Nater et al., 2009). Data was normalized using the ΔΔCt method (ΔΔCt=ΔCt target – ΔCt control) and expression normalized to the baseline for each day of testing.
3.4 Statistical Analyses
All statistical analyses were performed using SPSS for Mac OSX 22 software package (IBM, Chicago, IL, USA). Kolmogorov–Smirnov tests were computed prior statistical analyses to test for normal distribution as well as homogeneity of variance of all dependent variables. To test for stress-induced changes in cortisol, IL-6 and gene expression, we used analysis of variance (ANOVA) and analysis of covariance (ANCOVA) for repeated measures, with the within-subject factors “day” (day 1 vs. day 2) and “time” (three time points for IL-6, gene expression and leukocytes, and six time points for cortisol). ANOVAs were also used to analyze gene expression responses on each day individually, using three time points. ANCOVAs were used to assess whether changes in gene expression were robust against controlling for changes in leukocytes and subsets. In all ANOVAs, Greenhouse–Geisser corrections were applied if the sphericity assumption was violated (Greenhouse & Junker, 1992; Vasey & Thayer, 1987). To determine whether gene expression responses habituated, we used paired samples t-tests to assess whether peak gene expression responses were different between Days 1 and 2. Because cortisol stress responses peak between 10 and 30 minutes after the end of the TSST, we computed the area under the curve relative to increase (AUCi) to obtain the most comprehensive index of HPA axis stress responses (Pruessner, Kirschbaum, Meinlschmid, & Hellhammer, 2003). Because IL-6 shows a late peak at two hours after stress in all participants, we computed delta scores by subtracting pre-stress IL-6 levels from IL-6 concentrations two hours post-TSST to estimate IL-6 stress reactivity. Repeated measures ANOVAs were re-run as ANCOVAs controlling for changes in leukocyte subsets to test whether stress-induced changes in gene expression were related with changes in leukocyte subsets. Linear regressions were used to assess relationships between changes in gene expression responses and psychosocial as well as cortisol and plasma IL-6 responses. In these regressions, we controlled for age and sex, as well as changes in leukocyte subsets. All reported results were considered to be significant at the p ≤ 0.05 level and were considered a trend at the p ≤ 0.1 level. Partial eta squared is reported as effect size measure for all ANOVAs. Unless otherwise indicated, all reported values shown are untransformed means ± standard deviations (SD), all figures show untransformed means ± standard errors of the mean (SEM).
4 Results
4.1 Psychological, Endocrine and Inflammatory Stress Response
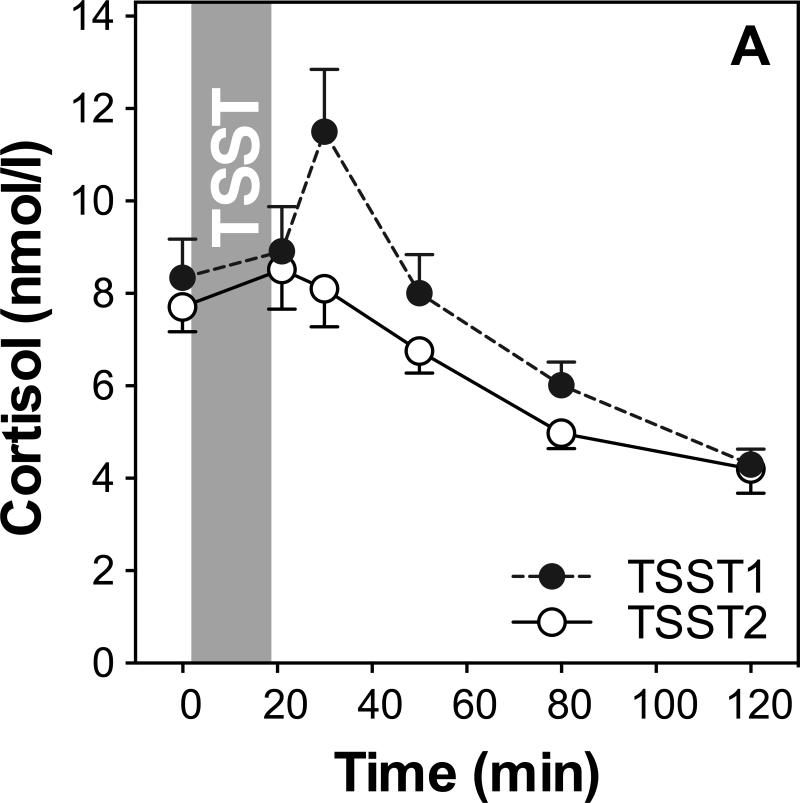
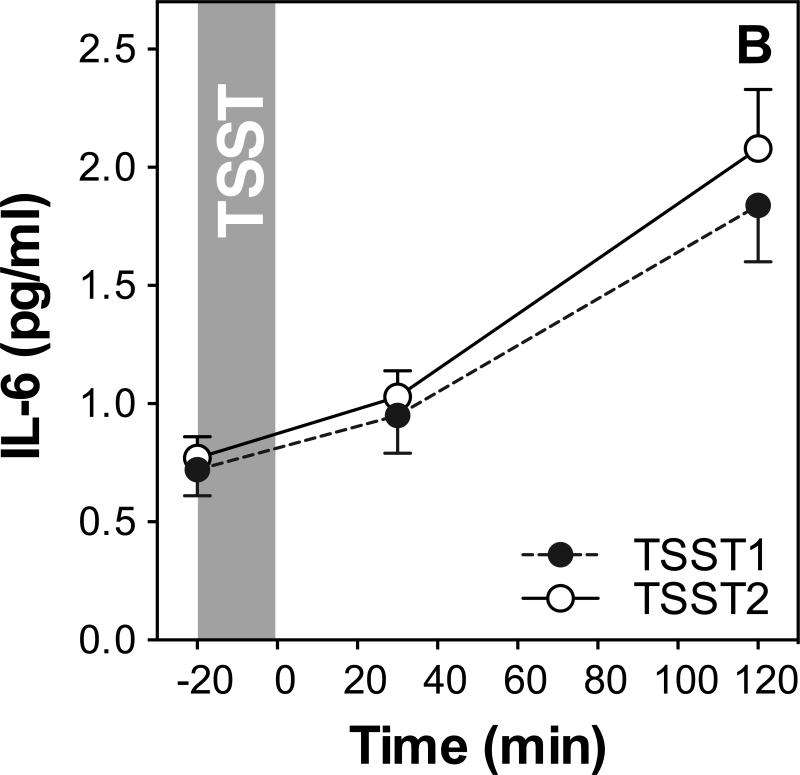
We first examined whether repeated TSST exposure induced changes in mood and stress perception, salivary cortisol (see Figure 1A) and plasma IL-6 (see Figure 1B).
Figure 1.
HPA axis responses to repeated stress (A). Graphs show means and standard errors of the mean (SEM) of salivary cortisol concentrations at baseline as well as 1, 10, 30, 60, and 120 min post-TSST; Inflammatory responses to repeated stress (B). Graphs show means and SEM of plasma IL-6 concentrations at baseline as well as 30 and 120 min post-TSST.
Paired sample t-test of the PASA subscales threat and challenge did not reveal significant changes in stress appraisals (threat day 1: M=11.4; SD=0.27; day 2: M=12.33; SD=5.08; t29=-1.37; p=0.18; challenge day1: M=16.3; SD=0.60; day 2: M=16.4; SD=0.63; t29=-0.16; p=0.87). Negative affect was lower on day 2 compared to day 1 (day 1: M=22.29; SD=9.73; day 2: M=19.71; SD=8.06; t29=2.5; p=0.02), but positive affect did not change significantly (day 1: M=30.58; SD=9.62; day 2: M=28.77; SD=8.78; t29=1.67; p=0.11).
Repeated measures ANOVA of salivary cortisol with the within-subjects factors day and time, and the between-subjects factors sex and age group, revealed a significant time effect on both study days (F2.1,53.8=18.6; p<0.001; ), indicating an overall increase of cortisol. Further, a significant day by time interaction (F2.8,73.9=5.1; p=0.003; ), indicated habituation of cortisol responses on the second day. A significant day by time by sex interaction indicated that men and women showed differences in HPA axis response and habituation such that men showed larger cortisol responses to TSST1 and greater habituation to TSST2 (F =3.7; p=0.015; ).
Repeated measures ANOVA of plasma IL-6 on both study days with the within-subjects factors day and time, and the between-subjects factors sex and age group revealed a significant time effect (F =41.2; p<0.001; ), indicating an overall increase of IL-6 on both days. There was no day by time interaction, showing that IL-6 responses did not differ between the two study days. Age group and sex were not related with IL-6 response (all F<0.7; p>0.41).
4.2 White blood cell response to repeated stress
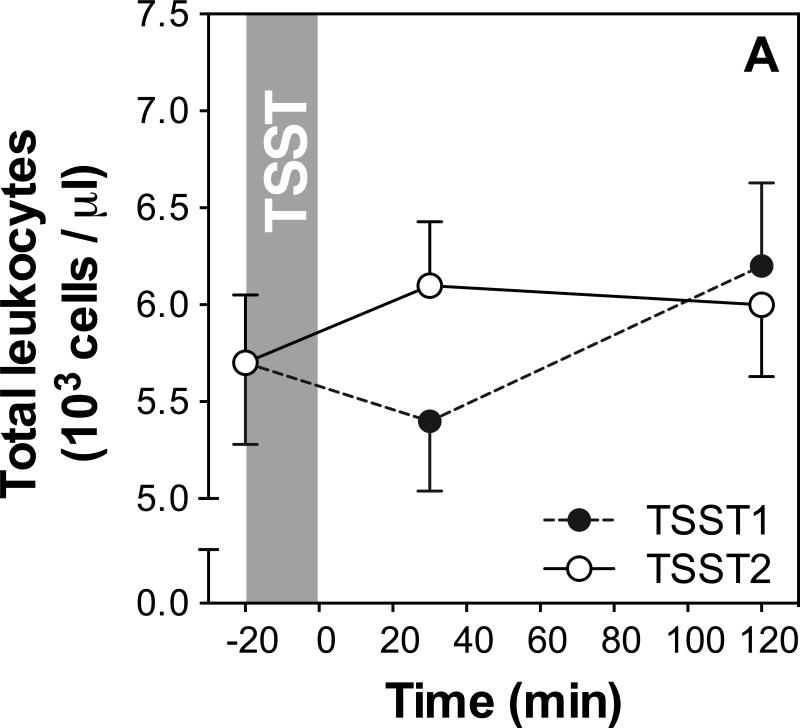
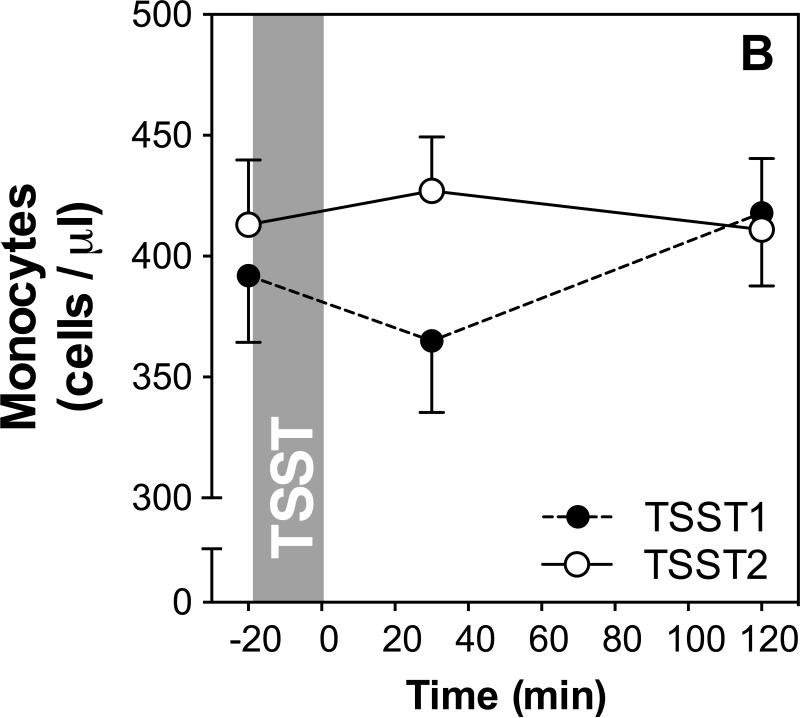
We used repeated measures ANOVAs and paired-samples t-tests to assess whether there were changes in leukocyte subsets in response to the TSSTs on both study days. The results of these analyses are presented in Table 1, and stress responses of total WBC as well as monocyte numbers are shown in Figure 2A and B, respectively.
Table 1.
Total white blood cell numbers, as well as monocyte number and percentage responses to repeated acute stress. The table shows repeated measures ANOVAs computed separately for each study day, as well as ANOVAs including both days of study. Further, we tested whether 30min and 120min time points differed from baseline on each of the study days (t-tests).
| Effect | WBC | Monocyte % | Monocyte # | |
|---|---|---|---|---|
| Separate ANOVAs per day | Time effect day 1 | F(1.6,36.1)=8.2; p=0.002*; | F(2,56)=0.4; p=0.68; | F(2,46)=3.1; p=0.056†; |
| Time effect day 2 | F(2,38)=3.2; p=0.051†; | F(1.7,48)=1.0; p=0.38; | F(1.5,28.6)=0.3; p=0.72; | |
| ANOVA including both days | Day*Time | F(1.2,22.1)=3.8; p=0.058†; | F(2,56)=0.2; p=0.81; | F(1.5,27.6)=1.5; p=0.23; |
| T-test Day 1 | Baseline vs. 30 min | t(24)=1.27; p=0.217 | t(29)=0.72; p=0.48 | t(24)=0.98; p=0.34 |
| Baseline vs. 120 min | t(23)=−3.6; p=0.001* | t(28)=0.76; p=0.45 | t(23)=−1.6; p=0.13 | |
| T-test Day 2 | Baseline vs. 30 min | t(19)=−3.07; p=0.006* | t(29)=0.054; p=0.96 | t(19)=-1.0; p=0.33 |
| Baseline vs. 120 min | t(19)=−2.1; p=0.051† | t(29)=1.1; p=0.27 | t(19)=−0.13; p=0.90 | |
Indicates a significant response;
Indicates a marginally significant response;
Figure 2.
(A) Means and standard errors of the mean (SEM) of total white blood cell numbers at baseline as well as 30 and 120 min post TSST on both study days; (B) Means and SEMs of monocyte numbers at baseline as well as 30 and 120 min post TSST (monocyte percentages not shown).
Total WBC numbers showed significant, or marginally significant, changes over time on both study days (time effect day 1: p<0.002; day 2: p=0.051), and a marginally significant day by time interaction (p=0.058) indicates response differences between study days. Day 1 responses are characterized by a decrease of WBC numbers 30 min after stress followed by an increase above baseline at 120 min (WBC numbers at 30, but not 120 min were significantly different from baseline; see table 1). On day 2, an increase can be seen at 30 min, with numbers remaining elevated above baseline at 120 min post stress (WBC numbers both at 30 and 120 minutes were significantly, or marginally signifantly, different from baseline; see table 1 for detailed results).
While no significant changes were found for monocyte percentage on either of the two study days, ANOVA revealed a marginally significant time effect of monocyte numbers on day 1, characterized by increased numbers at 30 min after stress, with recovery to baseline at 120 min. Follow-up analyses using paired samples t-tests revealed that monocyte count was not significantly different from baseline at 30 or 120 minutes on either day (see table 1 for detailed results).
4.3 Response of pro- and anti-inflammatory gene expression to repeated acute stress
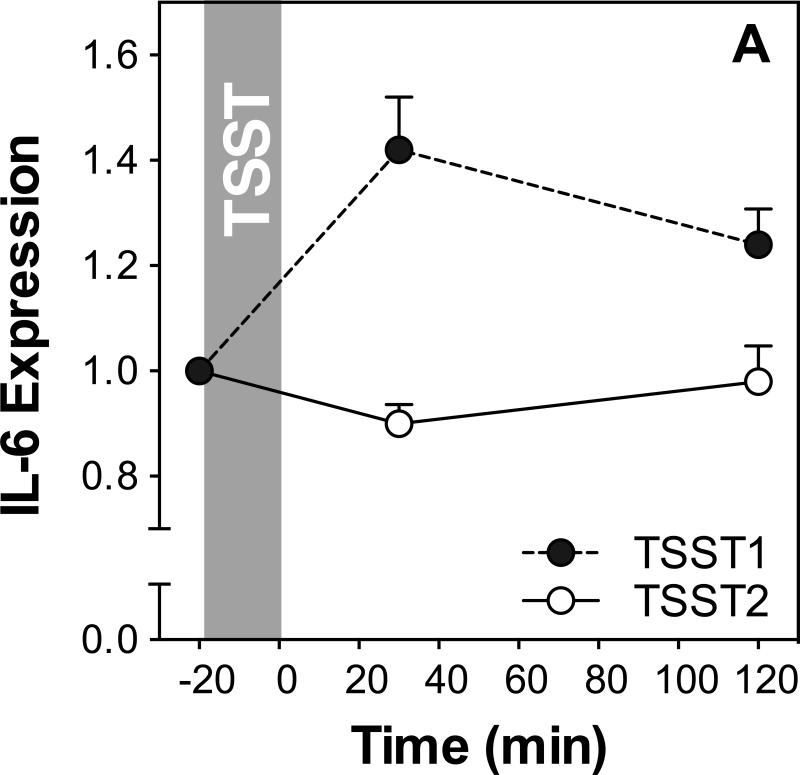
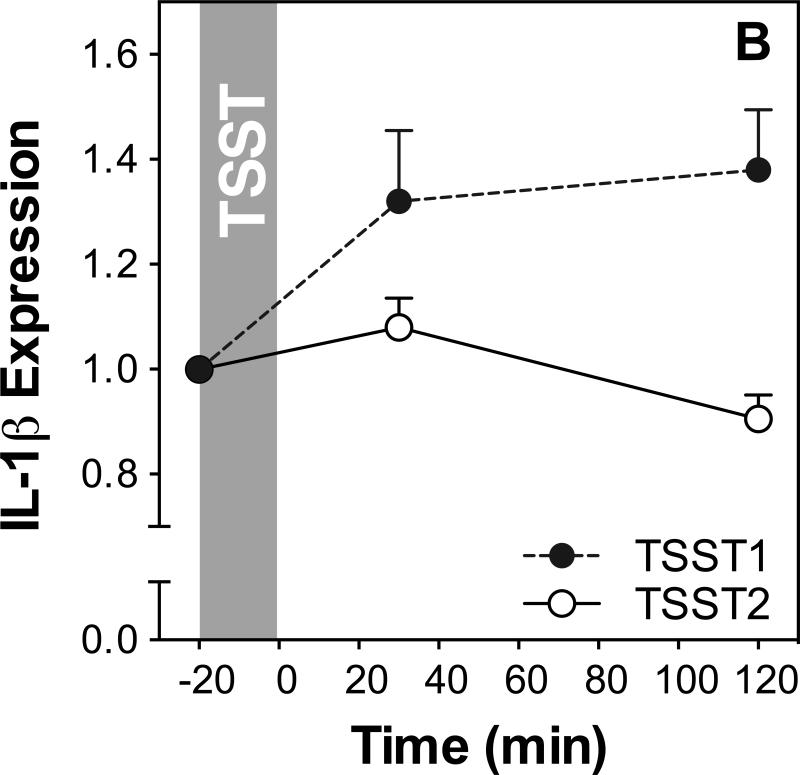
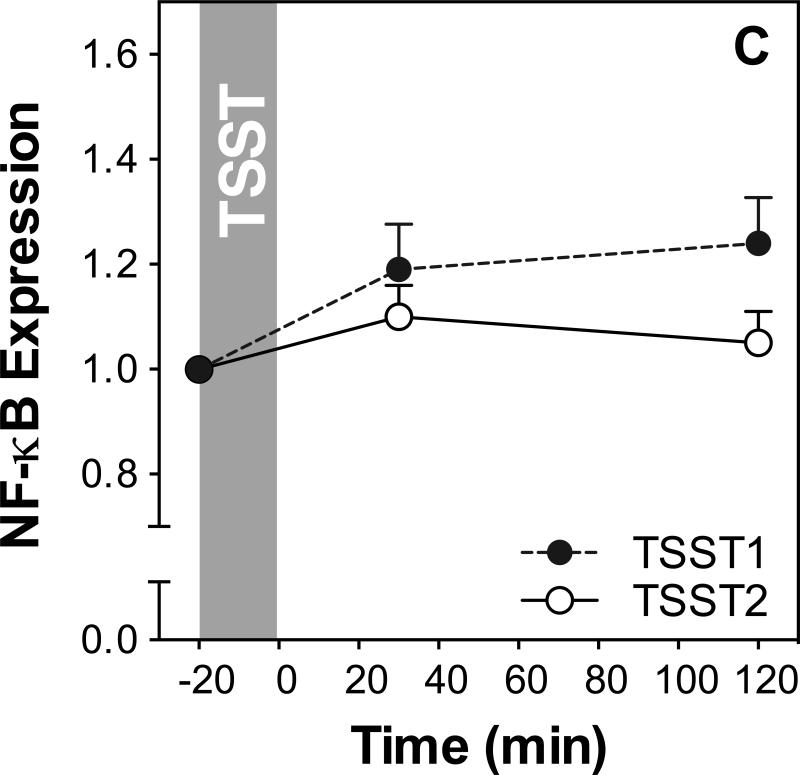
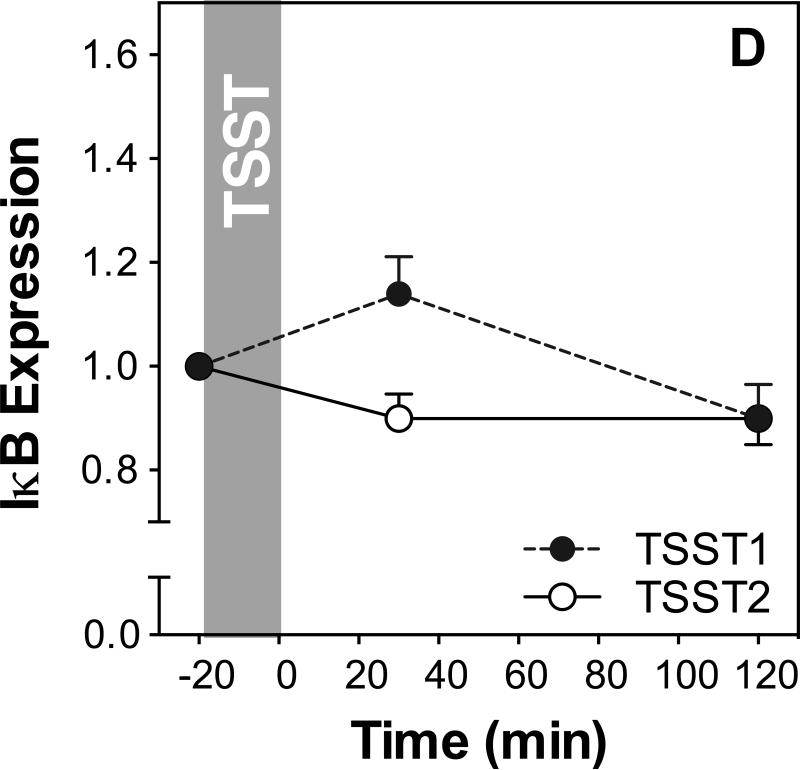
Figure 3 shows IL-6, IL-1β, NF-κB, and IκB expression before and after acute stress on both study days. Results of ANOVAs and paired samples t-tests are presented in Table 2.
Figure 3.
Responses to initial and repeated stress in gene expression of IL-6 (A), IL-1β (B), NF-κB (C) and IκB (D). Graphs show means and SEM of normalized gene expression at baseline as well as 30 and 120 min post-TSST.
Table 2.
Repeated measures ANOVAs testing for changes in gene expression in response to repeated stress on both study days (reporting day by time interaction) and individually for each of the study days. Habituation was tested by comparing peak normalized gene expression between the two study days using t-tests.
| Day*time | Day 1 | Day 2 | Habituation | |
|---|---|---|---|---|
| IL-6 | F(2,48)=2.8; p=0.074†; | F(2,52)=3.8; p=0.029*; | F(2,50)=0.23; p=0.80; | t(26)=2.3; p=0.03* |
| IL-1β | F(1.2,35.3)=7.9; p=0.006*; | F(1.2,36.4)=7.1; p=0.008*; | F(2,60)=6.4; p=0.003*; | t(30)=3.9; p=0. 001* |
| NF-κB | F(2,60)=2.2; p=0.116; | F(2,62)=5.1; p=0.009*; | F(2,60)=1.7; p=0.189; | t(30)=2.1; p=0.041* |
| IκB | F(2,56)=4.7; p=0.013*; | F(2,58)=3.6; p=0.033*; | F(2,60)=2.5; p=0.087†; | t(30)=3.1; p=0.005* |
Indicates a significant response
Indicates a marginally significant response
IL-6 expression increased in response to TSST1 with a peak at 30 min post stress (time effect: F2,52=3.8; p=0.029) but not to TSST2 (time effect: F2,50=0.23; p=0.80). Stress responses were marginally significantly different between the two study days (day by time interaction: F2,48=2.8; p=0.074). To test for habituation more directly, we compared peak expression between the two study days using a t-test and found that peak responses were significantly lower on day 2 compared to day 1 indicating habituation (t(26)=2.3; p=0.03).
IL-1β expression showed significant changes on both days, characterized by a sharp increase reaching almost maximal levels at 30 minutes in response to TSST1 (time effect: F1.4,43.5,=6.5; p=0.007), and a smaller increase with subsequent recovery after TSST2 (time effect: F2,60=6.4; p=0.003). Stress responses were significantly different between the two study days (day by time interaction: F1.2, 35.3=7.9; p=0.006), and further analysis revealed that significantly lower IL-1β expression 120 min after stress on day 2 compared to day 1 indicating habituation (t(30)=3.9; p=0.001).
NF-κB expression increased in response to TSST1 (F(2,62)=5.1; p=0.009) but not TSST2 (F(2,60)=1.7; p=0.19). There was no significant day by time interaction (F2,60=2.2; p=0.12; Figure 3C), indicating that trajectories of NF-κB expression were not significantly different between the two study days. However, NF-κB expression was significantly lower at 120 min post stress on day 2 compared to day 1, indicating habituation (t(30)=2.1; p=0.041).
IκB expression increased in response to TSST1 with peak expression at 30 minutes post stress (time effect: F2,54=6.5; p=0.003) and showed significant variation over time on day 2 (time effect: F(2,56)=4.7; p=0.013; Figure 3D). There was a significant day by time interaction (F2,54=5.4; p=0.008), and paired sample t-test revealed significantly lower IκB expression on day 2 compared to day 1 indicating habituation of IκB stress responses.
Further analyses revealed no relationship of age or sex with gene expression responses to stress as measured with age as a covariate and sex as a factor in repeated measures ANOVAs (All F's<2.4, p's>0.10). There was no correlation between age and expression at individual time points for any gene. There were no significant differences between expression levels between males and females for any gene at any time point (p's>0.07, t's<1.9).
4.4 Role of leukocyte redistribution as explanatory factor of changes in gene expression
In order to test whether stress-induced changes in gene expression would hold up when controlling for stress-induced leukocyte redistribution, we ran a series of repeated measures ANCOVAs on the gene expression data while controlling for the change in leukocytes from baseline to 30 minutes in one ANCOVA, and from baseline to 120 minutes in another ANCOVA. The results of these analyses are presented in tables 3 and 4.
Table 3.
ANOVAs and ANCOVAs for gene expression responses on day 1 controlling for leukocyte changes. Change scores were computed for each leukocyte measure from baseline to 30, and from baseline to 120 minutes. These change scores were then used as covariates in ANCOVAs for each gene analyzed, separated by each leukocyte subsets. Time effects of gene expression responses are presented without covariates and when controlling for changes in each leukocyte subset at each time point.
| ANOVA without covariates | ANCOVAs controlling for changes in immune cell numbers | ||||
|---|---|---|---|---|---|
| Time Point | WBC | Monocyte % | Monocyte # | ||
| IL-6 | F(2,52)=3.8; p=0.029; | +30 | F(2,38)=2.5; p=0.094†; | F(2,46)=2.7; p=0.078†; | F(2,38)=2.3; p=0.11; |
| +120 | F(2,38)=3.4; p=0.043*; | F(2,46)=3.0; p=0.059†; | F(2,38)=0.47; p=0.063†; | ||
| IL-1β | F(1.2,36.4)=7.1; p=0.008; | +30 | F(2,46)=9.8; p<.001*; | F(1.6,44.8)=11.7; p<0.001*; | F(2,46)=10.7; p<0.001*; |
| +120 | F(2,44)=7.2; p=0.002*; | F(1.6,43.2)=10.7; p<0.001*; | F(2,44)=7.5; p=0.002*; | ||
| NF-κB | F(2,62)=5.1; p=0.009; | +30 | F(2,46)=2.7; p=0.077†; | F(2,56)=4.0; p=0.024*; | F(2,46)=4.4; p=0.018*; |
| +120 | F(1.6,35.0)=4.7; p=0.022*; | F(2,54)=4.1; p=0.021*; | F(1.6,34.6)=1.9; p=0.16; | ||
| IκB | F(2,58)=3.6; p=0.033; | +30 | F(2,42)=10.0; p<0.001*; | F(2,52)=6.0; p=0.004*; | F(2,42)=9.6; p<0.001*; |
| +120 | F(1.5,30.3)=3.4; p=0.061†; | F(2,50)=6.7; p=0.003*; | F(2,40)=10.2; p<0.001*; | ||
Indicates response is significant
Indicates response is marginally significant
Table 4.
ANOVAs and ANCOVAs for gene expression responses on day 2 controlling for leukocyte changes. Change scores were computed for each leukocyte measure from baseline to 30, and from baseline to 120 minutes. These change scores were then used as covariates in ANCOVAs for each gene analyzed, separated by each leukocyte subsets. Time effects of gene expression responses are presented without covariates and when controlling for changes in each leukocyte subset at each time point.
| ANOVA without covariates | ANCOVAs controlling for changes in immune cell numbers | ||||
|---|---|---|---|---|---|
| Time Point | WBC | Monocyte % | Monocyte # | ||
| IL-6 | F(2,50)=0.2; p=0.80; | +30 | F(2,26)=1.4; p=0.26; | F(2,46)=0.27; p=0.76; | F(2,26)1.25; p=0.31; |
| +120 | F(2,26)=1.3; p=0.29; | F(2,46)=0.3; p=0.74; | F(2,26)=1.6; p=0.23; | ||
| IL-1β | F(2,60)=6.4; p=0.003; | +30 | F(2,34)=2.4; p=0.10†; | F(2,54)=6.2; p=0.004*; | F(2,34)=2.7; p=0.059†; |
| +120 | F(2,34)=3.6; p=0.037*; | F(2,54)=4.7; p=0.013*; | F(2,34)=2.3; p=0.12; | ||
| NF-βB | F(2,60)=1.7; p=0.189; | +30 | F(2,34)=6.5; p=0.004*; | F(2,54)=2.0; p=0.14; | F(2,34)=8.6; p=0.001*; |
| +120 | F(2,34)=9.4; p=0.001*; | F(2,54)=1.4; p=0.25; | F(2,34)=7.7; p=0.002*; | ||
| IκB | F(2,60)=2.5; p=0.087; | +30 | F(2,32)=0.3; p=0.74; | F(2,52)=2.2; p=0.12; | F(2,32)=1.3; p=0.30; |
| +120 | F(2,32)=0.6; p=0.56; | F(2,52)=1.5; p=0.23; | F(2,32)=1.3; p=0.30; | ||
Indicates response is significant
Indicates response is marginally significant
On day1, the p-level of the time effect of changes in IL-6 expression was reduced to trend level when controlling for WBC changes (from baseline to 30min; still significant using baseline to 120min), changes in monocyte percentage, as well as monocyte numbers (to 120min). Significance of IL-6 expression changes on day 1 was lost only when controlling for changes in monocyte numbers from baseline to 30 minutes, indicating that changes in IL-6 expression are not completely independent from changes in cell population in general, but in particular were related with the decrease in monocyte numbers from baseline to 30 minutes post stress.
Similarly, the p-level of the time effect of changes in NF-κB expression on day 1 was reduced but generally remained significant when controlling for changes of total WBC, monocyte numbers, and monocyte percentages. Significance was only reduced to trend level when controlling for WBC changes from baseline to 30 minutes post stress, and lost when controlling for the change in monocyte numbers from baseline to 120 min post stress. These findings indicate that changes in NF-κB expression are not completely independent from changes in cell population in general, but in particular were related with the increase in monocyte numbers from baseline to 120 minutes post stress.
Changes of IL-1β and IκB gene expression on day1 were generally unaffected by controlling for changes in total WBC, monocyte numbers, and monocyte percentages. As shown in table 3, p-levels of the IL-1β time effect were all lower when controlling for cell population changes. Similar effects were found when controlling for I-κB, with one exception: P-level of the time effect was reduced to trend level when controlling for the change of total WBC numbers from baseline to 120 minutes post stress, indicating that the changes in IκB were not independent from the late increase / recovery of total leukocyte numbers.
On day2, IL-6 expression did not show significant changes over time, and this did not change when controlling for changes in leukocyte populations. IL-1β expression did change significantly over time in the original analysis. When controlling for changes in leukocyte populations, p-levels were generally reduced, in some cases to trend level (when controlling for change in WBC at 30 minutes, and monocyte numbers at 30 minutes), and to non-significance when controlling for change in monocyte numbers from baseline to 120 minutes post stress. Changes of IκB were marginally significant without controlling for changes in leukocyte populations. This trend-level significance was lost when controlling for any of the three leukocyte variables at both time points (change from baseline to 30 and 120 minutes post stress), indicating that IκB changes on day to are not independent of changes in leukocyte subpopulations. NF-κB gene expression was not found to change significantly on day2 in our original analysis. However, when controlling for total WBC and monocyte numbers from baseline to 30 minutes, and from baseline to 120 minutes, p-levels are improved to significance. This effect was not observed when controlling for changes in monocyte percentage.
4.5 Relationships of Gene Expression Responses With Plasma IL-6 and Cortisol
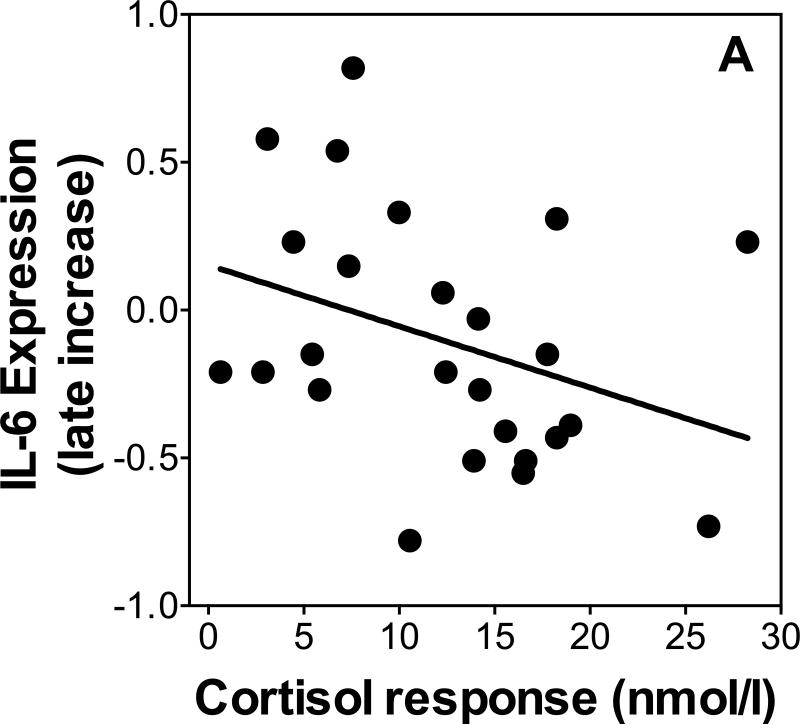
To test our prediction that cortisol responses would be a determinant of gene expression responses we used linear regression to test whether increases in cortisol as indexed by the area under the curve (AUC) were related to changes in gene expression between 30 and 120 minutes post-TSST. Because cortisol responses differed by age and sex, we controlled for age and sex in all linear regressions. Additionally, we re-ran all regressions, separately controlling for changes in leukocyte sub populations to ensure independence of the expected relations of stress-induced leukocyte redistribution. There was no relationship between NF-κB or IκB expression and cortisol response on either day (β's<0.25, p's>0.37). Cortisol response was a significant predictor (β=0.50, p=0.04, R2=0.21) of the increase of IL-1β expression between 30 and 120 minutes post-TSST on day 1 when controlling for age and sex (age β=-0.14, p=0.42; sex β=0.13, p=0.58; additionally controlling for leukocyte sub populations changed p-levels to 0.12 [total leukocytes], 0.10 [monocyte numbers, and 0.087 [monocyte numbers]). Cortisol response was a marginally significant inverse predictor (β=-0.48, p=0.056, R2=0.25, Figure 4A) of the increase of IL-6 expression between 30 and 120 minutes post-TSST on day 1 when controlling for age and sex (age β=0.32, p=0.11; sex β=-0.24, p=0.32; additionally controlling for leukocyte sub populations changed p-levels to 0.05 [total leukocytes], 0.075 [monocyte numbers, and 0.06 [monocyte numbers]). There was no relationship between cortisol responses and the change in IL-6 or IL-1β expression on Day 2 (β's<0.27, p's>0.15).
Figure 4.
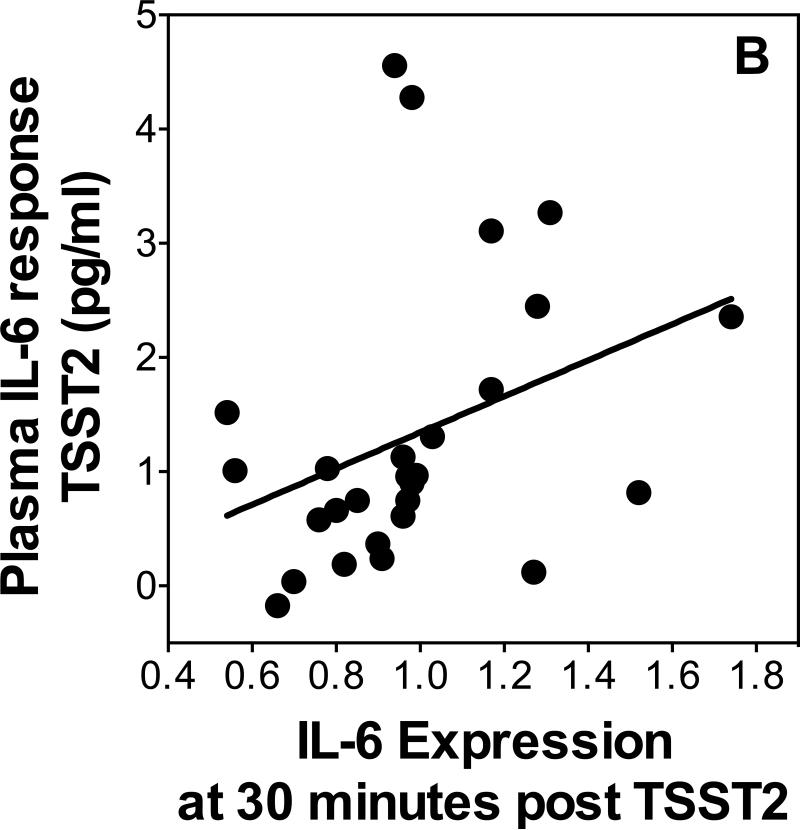
Scatterplots showing the relationship of change in IL-6 expression from 30 to 120 minutes post-TSST1 with cortisol responses (A). IL-6 Expression 30 minutes post-TSST2 with plasma IL-6 response to TSST2 (B).
To test our hypothesis that changes in gene expression would be predictive of increases in plasma IL-6, we used linear regressions controlling for age and sex to determine whether increases in IL-6 were related with gene expression 30 minutes post-TSST. Additionally, we reran all regressions, separately controlling for changes in leukocyte sub populations to ensure independence of the expected relations of stress-induced leukocyte redistribution. IL-1β , NF-κB and IκB expression at 30 minutes post-stress did not predict plasma IL-6 response on either day (β's<0.37, p's>0.11). IL-6 expression at 30 minutes post-stress was a significant positive predictor (β =0.46, p=0.027, R2=0.21, Figure 4B) of the increase of plasma IL-6 on day 2 when controlling for age and sex (age β=-0.13, p=0.47; sex β=-0.13, p=0.52; additionally controlling for leukocyte sub populations changed p-levels to 0.12 [total leukocytes], 0.09 [monocyte numbers, and 0.095 [monocyte numbers]). Furthermore, IκB expression was a significant inverse predictor of plasma IL-6 on day 2 (β=-0.46, p=0.04, R2=0.17), when controlling for age and sex (age β=0.11, p=0.60; sex β=-0.16, p=0.45; additionally controlling for leukocyte sub populations changed p-levels to 0.14 [total leukocytes], 0.14 [monocyte numbers, and 0.03 [monocyte numbers]). There was no relationship between change in IL-1β , NF-κB or IκB expression between 30 and 120 minutes post-stress and plasma IL-6 response on either day (β 's<0.36, p's>0.13).
4.6 Relationship with psychosocial stress responses
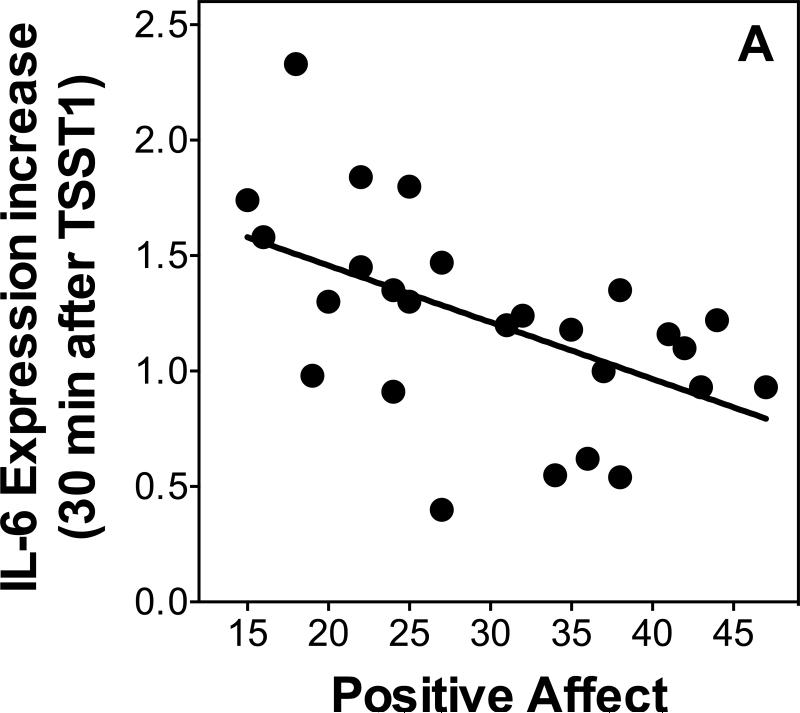
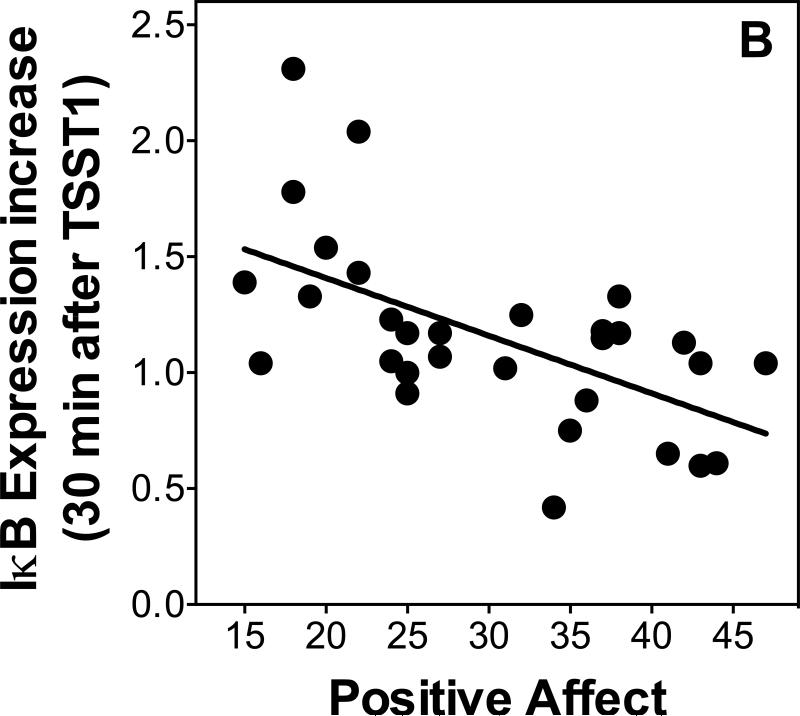
We used linear regressions controlling for age and sex to examine relationships between psychological variables and changes in gene expression. Additionally, we re-ran all regressions, separately controlling for changes in leukocyte sub populations to ensure independence of the expected relations of stress-induced leukocyte redistribution. Positive affect was inversely related to IL-6 expression at 30 minutes post-TSST1 (β=-0.51, p=0.03, R2=0.29; Figure 5A) when controlling for age and sex (age β=-0.11, p=0.55; sex β=0.004, p=0.99; additionally controlling for leukocyte sub populations changed p-levels to 0.075 [total leukocytes], 0.048 [monocyte numbers, and 0.03 [monocyte numbers]). Positive affect also was a marginally significant inverse predictor of NF-κB expression at 120 minutes post-TSST1 (β =-0.38, p=0.06, R2=0.17) when controlling for age and sex (age β=-0.17, p=0.35; sex β=-0.13, p=0.51; additionally controlling for leukocyte sub populations changed p-levels to 0.025 [total leukocytes], 0.12 [monocyte numbers, and 0.17 [monocyte numbers]), and a significant inverse predictor of IκB expression at 30 minutes post-TSST1 (β =-0.58, p=0.002, R2=0.35; Figure 5B) when controlling for age and sex (age β=-0.01, p=0.94; sex β=0.03, p=0.87; additionally controlling for leukocyte sub populations did not change p-levels: 0.006 [total leukocytes], 0.008 [monocyte numbers, and 0.003 [monocyte numbers]) and 120 minutes post-TSST1 ( =-0.77, p<0.001, R2=0.55; Figure 5B) when controlling for age and sex (age β=-0.04, p=0.79; sex β=-0.10, p=0.49; additionally controlling for leukocyte sub populations did not change p-levels: 0.001 [total leukocytes], 0.004 [monocyte numbers, and <0.001 [monocyte numbers]).
Figure 5.
Scatterplots showing the relationship of stress responses of IL-6 (A) and IκB (B) expression with positive affect assessed after stress.
While there were no relationships of negative affect with IL-6, IL-1β , and NF-κB expression on either day (sex ='s<0.35, p's>0.12), negative affect was a significant inverse predictor of IκB expression at 120 minutes post stress on day 2 (sex = =-0.43, p<0.023, R2=0.25) when controlling for age and sex (age β=-0.05, p=0.74; sex β=0.12, p=0.57; additionally controlling for leukocyte sub populations did not change p-levels: 0.027 [total leukocytes], 0.017 [monocyte numbers, and 0.007 [monocyte numbers]).
5 Discussion
We set out in this study to investigate the effect of acute stress on the expression of selected pro- and anti-inflammatory genes in humans, and further, whether repeated exposure to the same stressor would lead to habituation of gene expression stress responses. As expected, we found an increase in IL-6, IL-1β , NF-κB and IκB expression in response to the first TSST. We found marked habituation of IL-6, IL-1β , NF-κB, and IκB expression, which we had only expected for IκB because of its known relationship with cortisol, but not for any of the other genes. Further analyses revealed that IL-1β and IκB responses to initial stress were not mediated by leukocyte redistribution, whereas stress responses of NF-κB and IL-6 expression appeared to be partially mediated by changes in leukocyte sub populations. Gene expression responses to repeated TSST, if present, were related with changes in leukocyte sub populations. Results were only partially in support of our hypotheses regarding the relationship between endocrine and plasma inflammatory stress responses with changes in gene expression. Associations of cortisol responses were only found for two of the four genes: cortisol responses to the first TSST predicted increases in IL-1β and IL-6 expression between 30 and 120 minutes after the first TSST, but was unrelated with NF-κB and IκB expression. Increases in IL-6 expression to the second TSST predicted plasma IL-6 increases two hours later. Finally, we found that low positive mood after the first TSST was a strong predictor of stress-induced changes in the expression of all four genes tested here.
Our findings on HPA axis and plasma IL-6 stress responses are in agreement with the literature with regard to initial stress responses as well as habituation of cortisol, and nonhabituation of plasma IL-6 (e.g. Schommer et al., 2003; von Kanel et al., 2006). Furthermore, our findings are in line with the few previously published studies on stress responses of pro- and anti-inflammatory gene expression. The increase of IL-1β expression 30 minutes after stress that remained elevated until two hours after stress found in our study is an exact replication of Brydon et al.'s study (Brydon et al., 2005). In contrast, while Brydon et al. did not report increases in expression of IL-6, we were able to detect stress-induced increases of IL-6, as well as NF-κB and IκB expression that largely mirrored increases in IL-1β expression. These differences might be explained by differences in stress-induction paradigms between the two studies. Our findings are also generally in line with results from Nater et al. (2009) who reported stress-induced increases in many pathways including those relevant for immune activation (Nater et al., 2009). We extend this literature by further showing that upon exposure to a similar stress situation again, all of these responses habituate.
Brydon et al. further reported a correlation between increases in IL-1β expression and plasma IL-6 responses to stress. We were not able to replicate this specific finding, but we were able to show that cortisol increases were inversely related with increases in IL-1β and IL-6 gene expression in response to a first, initial stress test, while only in response to repeated stress did IL-6 expression after stress predict plasma IL-6 responses. While not exactly identical, both sets of findings indicate that changes in gene expression are likely related with changes in endocrine parameters. The differences might again be explained by different stress-induction paradigms between Brydon's study and ours, possibly being related to the fact that the TSST used in our study activates sympathetic and pituitary-adrenal stress systems, while the task used by Brydon et al. mainly activates the sympathetic nervous system, but not the HPA axis.
While our findings of increases in gene expression in response to stress are in line with the literature, and are generally also in line with the by now established stress responsiveness of plasma inflammatory molecules, such as IL-6 (Rohleder, 2014; Steptoe et al., 2007), they underscore the importance of understanding the underlying mechanism. Gene expression assessed in peripheral blood as in the present study first needs to be placed in the context of stress-induced re-distribution of leukocyte subsets (e.g. (Dhabhar et al., 2012) which alters the subset of cells present in individual blood samples, thereby having he potential to find differences in intracellular mechanisms without knowing whether they are caused by changes in gene expression or changes in cell types (e.g. Richlin, Arevalo, Zack, & Cole, 2004). While this can be addressed in different ways, we chose here to statistically control for changes in leukocyte numbers and monocyte numbers and percentages. Our results show that stress-induced changes in gene expression are differentially related with changes in leukocyte sub populations. Separately controlling for changes in leukocyte numbers, monocyte numbers, and monocyte percentages reduced significance levels for some but not all time effects of gene expression changes. Stress-induced changes of IκB and IL-1β expression were generally unaffected on day 1, with p-levels remaining the same or improving. In line with this, relationships of IL-1β and IκB with cortisol and plasma IL-6 responses, as well as self-reported mood were unaffected when controlling for changes in leukocyte sub populations. In contrast to that, time effects testing for changes of IL-6 and NF-κB expression were not statistically independent of changes in leukocyte subsets, with most p-levels being reduced to trend level, and a few reduced to non-significance. While some loss of power is to be expected when adding additional variables, these findings mean that at least part of the stress-induced changes found here do not represent actual changes in gene expression of individual cells, but can be explained as more (or fewer) cells with a specific activation pattern moving into (or out of) the blood. On day 2, where stress-induced changes are less pronounced for most of the genes, time effects (if present) were completely abolished when controlling for changes in leukocyte subsets, with the exception of NF-κB, which only showed a significant time effect when controlling for total leukocyte, or monocyte numbers. Taken together, these results show that a central goal of future studies on this topic should establish ways to measure changes in intracellular activation patterns independent of leukocyte redistribution, which could be done, for example, by testing gene expression in selected subsets only.
The changes observed here further need to be interpreted in the context of hypothesized activators or inhibitors of inflammatory gene expression. As summarized before, the transcription factor NF-κB is central in activating expression of inflammatory genes, is stimulated by sympathetic nervous system activation (Bierhaus et al., 2003; Richlin et al., 2004), and negatively controlled under stress by glucocorticoid increases (Wolf et al., 2009). We therefore expected increases in gene expression to be inversely related with cortisol stress responses. We found IL-1β and IL-6 gene expression to be inversely related with cortisol responses, but we did not find cortisol to predict changes in the two other genes assessed here. This might be indication of specificity of this effect, or it might be the result of differentially timed stress responses, or that we were not able to take into account further mediating factors, most importantly catecholamines, in this study.
The finding of a marked habituation of stress responses in expression of all four genes assessed here is a novel, and partially unexpected finding. Our hypotheses were based on the assumption that habituation or non-habituation of gene expression stress responses would be a consequence of stress response patterns, such as habituation or non-habituation, of signaling systems upstream of gene expression. Since the hypothesized main activators of inflammatory gene expression under acute stress are catecholamines, which do not habituate in response to repeated stress (Schommer et al., 2003), and since stress-induced increases in plasma concentrations of inflammatory molecules like IL-6 do not habituate (von Kanel et al., 2006), we did not expect to find habituation of IL-1β, IL-6 and NF-κB gene expression. In contrast, we did expect habituation of IκB stress responses, because IκB is regulated, at least partially, by glucocorticoids (Auphan et al., 1995; Scheinman et al., 1995), and glucocorticoid responses to stress did habituate, which would be consistent with seeing a habituation of IκB responses to repeated stress. However, we did not find a relationship between cortisol responses and IκB responses to either of the two stressors. In contrast, despite the unexpected habituation of IL-6 responses, we did find that IL-6 gene expression in response to the second stress test was a predictor of plasma IL-6 responses. Taken together, we were able to show here that pro- and anti-inflammatory gene expression shows expected responses to acute stress, but unexpectedly habituates in response to a similar stressor. Cortisol responses partially explain responses of IL-1β and IL-6 expression, but not that of other genes. Responses of IL-6, but not other genes’, expression partially explains increases in plasma IL-6, but only in response to repeated stress. To better understand what drives changes in gene expression, future studies will need to assess catecholamines and other potential stimulators of inflammatory mechanisms. They will also have to take into account more thorough conceptualizations of habituation, in particular with regard to which signaling systems show habituation, and whether dependent systems also show adaptations in response to repeated exposures to similar stimuli.
The present findings have implications for the translation of stress into pathophysiological processes, and ultimately, disease, in humans. Repeated stress exposure without habituation has been hypothesized to be a hallmark of allostatic load (McEwen, 1998), and we have hypothesized that in particular non-habituation or sensitization of plasma concentrations of inflammatory mediators might play a central role in this process (Rohleder, 2014). The fact that pro-inflammatory gene expression was found to habituate shows that stress-induced increases in plasma IL-6 cannot be explained solely by intracellular mechanisms in circulating immune cells, and that plasma levels of IL-6, and potentially other inflammatory cytokines, must also come from other, non-immune sources. One of the candidates being discussed is adipose tissue. In line with this hypothesis, we have recently shown that individuals with a higher percentage of body fat also show higher IL-6 responses to repeated stress (McInnis et al., 2014). In terms of the health relevance of acute stress responses, our findings are in line with the assumption that stress responses in the healthy organism are generally adaptive (McEwen, 1998; Sapolsky et al., 2000). In particular the finding of a habituation of proand anti-inflammatory gene expression might extend this to show that in healthy humans, even intracellular mechanisms like inflammatory gene expression are regulated in an adaptive way. Future studies will therefore have to test whether failure of habituation of inflammatory gene expression will predict development of disease, and therefore qualifies as a maladaptive stress response pattern. This interpretation would be in agreement with our finding that plasma IL-6 responses are higher in individuals who are unable to decrease IL-6 expression after stress.
Our findings must be interpreted in light of some limitations. While our samples size was limited, and potentially too small to detect some relationships between gene expression changes and circulating hormones or inflammatory molecules, our study did have the benefit of a more diverse participant population compared to prior studies, including both men and women, and a wider age range. We were unable to control specifically for changes in some leukocyte subsets, such as for example Natural Killer (NK) cells, and therefore cannot rule out the possibility that changes in pro- and anti-inflammatory gene transcription were not at least partially due to redistribution of these cell types. However, the kinetics of stress responses of leukocytes and monocytes was not overlapping with changes in expression of any of the genes we examined. We were only able to study a select subset of pro- and anti-inflammatory genes. While it might be advantageous to study a larger set of pro- and anti-inflammatory genes, it should also be noted that a hypothesis-driven, targeted approach as ours avoids many problems present in studies using for example microarrays (e.g. (Nater et al., 2009). Finally, due to the short period of time between the first and the second TSST, we cannot exclude that incomplete recovery of cortisol or inflammatory responses to the first TSST might have carried over into the second TSST.
Taken together, our results show that healthy human individuals show stress-induced increases in the expression of pro- and anti-inflammatory genes, which are higher in those who experience greater decreases in mood during the stressor. Furthermore, we found that expression of all four genes assessed here habituates in response to repeated stress exposure. Increases in IL-6 expression were higher in those with lower cortisol responses, and in response to repeated stress, predicted plasma concentrations of IL-6 two hours later. These findings show that even on an intracellular level, inflammatory responses to acute stress appear to be adaptive in that they allow rapid up-regulation of defense mechanisms when exposed once, but habituation might protect the organism from potentially damaging consequences when a similar situation is experienced. These results also show that gene expression cannot be explained solely by HPA axis stress responses, and that plasma inflammatory responses are not solely explained by changes in circulating immune cells. Future studies will be needed to better understand what drives stress responses, and habituation of inflammatory gene expression, as well as long-term consequences of showing non-habituation.
Research Highlights.
Acute stress induced increases in gene expression of IL-6, IL-1beta, NF-kappaB and I-kappaB
Stress responses of IL-6, IL-1beta, NF-kappaB and I-kappaB gene expression did show habituation
Stress responses of IL-6, IL-1beta, NF-kappaB and I-kappaB gene expression were related with lower positive mood
Acknowledgements
This research was supported by the American Federation of Aging Research (NR), and by training grants from the National Institute of Health (T32 MH 019929: CM, T32-084907 DG). MVT acknowledges funding from the Swiss National Science Foundation (SNF).
Footnotes
Publisher's Disclaimer: This is a PDF file of an unedited manuscript that has been accepted for publication. As a service to our customers we are providing this early version of the manuscript. The manuscript will undergo copyediting, typesetting, and review of the resulting proof before it is published in its final citable form. Please note that during the production process errors may be discovered which could affect the content, and all legal disclaimers that apply to the journal pertain.
6 Conflict of Interest
All authors declare that there are no conflicts of interest.
References
- Anderson RJ, Freedland KE, Clouse RE, Lustman PJ. The prevalence of comorbid depression in adults with diabetes: a meta-analysis. Diabetes Care. 2001;24(6):1069–1078. doi: 10.2337/diacare.24.6.1069. [DOI] [PubMed] [Google Scholar]
- Auphan N, DiDonato JA, Rosette C, Helmberg A, Karin M. Immunosuppression by glucocorticoids: inhibition of NF-kappa B activity through induction of I kappa B synthesis. Science. 1995;270(5234):286–290. doi: 10.1126/science.270.5234.286. [DOI] [PubMed] [Google Scholar]
- Bachen EA, Manuck SB, Cohen S, Muldoon MF, Raible R, Herbert TB, Rabin BS. Adrenergic blockade ameliorates cellular immune responses to mental stress in humans. Psychosom Med. 1995;57(4):366–372. doi: 10.1097/00006842-199507000-00008. [DOI] [PubMed] [Google Scholar]
- Benschop RJ, Jacobs R, Sommer B, Schurmeyer TH, Raab JR, Schmidt RE, Schedlowski M. Modulation of the immunologic response to acute stress in humans by beta-blockade or benzodiazepines. FASEB J. 1996;10(4):517–524. doi: 10.1096/fasebj.10.4.8647351. [DOI] [PubMed] [Google Scholar]
- Benschop RJ, Rodriguez-Feuerhahn M, Schedlowski M. Catecholamine-induced leukocytosis: early observations, current research, and future directions. Brain Behav Immun. 1996;10(2):77–91. doi: 10.1006/brbi.1996.0009. doi: 10.1006/brbi.1996.0009. [DOI] [PubMed] [Google Scholar]
- Bierhaus A, Wolf J, Andrassy M, Rohleder N, Humpert PM, Petrov D, Nawroth PP. A mechanism converting psychosocial stress into mononuclear cell activation. Proc Natl Acad Sci U S A. 2003;100(4):1920–1925. doi: 10.1073/pnas.0438019100. doi: 10.1073/pnas.0438019100. [DOI] [PMC free article] [PubMed] [Google Scholar]
- Black PH, Garbutt LD. Stress, inflammation and cardiovascular disease. J Psychosom Res. 2002;52(1):1–23. doi: 10.1016/s0022-3999(01)00302-6. [DOI] [PubMed] [Google Scholar]
- Breines JG, Thoma MV, Gianferante D, Hanlin L, Chen X, Rohleder N. Self- compassion as a predictor of interleukin-6 response to acute psychosocial stress. Brain Behav Immun. 2014;37:109–114. doi: 10.1016/j.bbi.2013.11.006. doi: 10.1016/j.bbi.2013.11.006. [DOI] [PMC free article] [PubMed] [Google Scholar]
- Brydon L, Edwards S, Jia H, Mohamed-Ali V, Zachary I, Martin JF, Steptoe A. Psychological stress activates interleukin-1beta gene expression in human mononuclear cells. Brain Behav Immun. 2005;19(6):540–546. doi: 10.1016/j.bbi.2004.12.003. doi: 10.1016/j.bbi.2004.12.003. [DOI] [PubMed] [Google Scholar]
- Charles ST, Piazza JR, Mogle J, Sliwinski MJ, Almeida DM. The wear and tear of daily stressors on mental health. Psychol Sci. 2013;24(5):733–741. doi: 10.1177/0956797612462222. doi: 10.1177/0956797612462222. [DOI] [PMC free article] [PubMed] [Google Scholar]
- Cohen S, Janicki-Deverts D, Miller GE. Psychological stress and disease. JAMA. 2007;298(14):1685–1687. doi: 10.1001/jama.298.14.1685. doi: 10.1001/jama.298.14.1685. [DOI] [PubMed] [Google Scholar]
- Cohen S, Kamarck T, Mermelstein R. A global measure of perceived stress. J Health Soc Behav. 1983;24(4):385–396. [PubMed] [Google Scholar]
- Cohen S, Williamson G. Perceived stress in a probability sample of the United States. In: Spacapan S, Oskamp S, editors. The social psychology of health: Claremont Symposium on applied social psychology. Sage; Newbury Park, CA: 1988. [Google Scholar]
- Cole SW, Hawkley LC, Arevalo JM, Sung CY, Rose RM, Cacioppo JT. Social regulation of gene expression in human leukocytes. Genome Biol. 2007;8(9):R189. doi: 10.1186/gb-2007-8-9-r189. doi: 10.1186/gb-2007-8-9-r189. [DOI] [PMC free article] [PubMed] [Google Scholar]
- Danesh J. Smoldering arteries? Low-grade inflammation and coronary heart disease. JAMA. 1999;282(22):2169–2171. doi: 10.1001/jama.282.22.2169. [DOI] [PubMed] [Google Scholar]
- Danesh J, Collins R, Appleby P, Peto R. Association of fibrinogen, C-reactive protein, albumin, or leukocyte count with coronary heart disease: meta-analyses of prospective studies. JAMA. 1998;279(18):1477–1482. doi: 10.1001/jama.279.18.1477. [DOI] [PubMed] [Google Scholar]
- Dhabhar FS, Malarkey WB, Neri E, McEwen BS. Stress-induced redistribution of immune cells--from barracks to boulevards to battlefields: a tale of three hormones-- Curt Richter Award winner. Psychoneuroendocrinology. 2012;37(9):1345–1368. doi: 10.1016/j.psyneuen.2012.05.008. doi: 10.1016/j.psyneuen.2012.05.008. [DOI] [PMC free article] [PubMed] [Google Scholar]
- Dickerson SS, Kemeny ME. Acute stressors and cortisol responses: a theoretical integration and synthesis of laboratory research. Psychol Bull. 2004;130(3):355–391. doi: 10.1037/0033-2909.130.3.355. doi: 10.1037/0033-2909.130.3.355. [DOI] [PubMed] [Google Scholar]
- Greenhouse JB, Junker BW. Exploratory statistical methods, with applications to psychiatric research. Psychoneuroendocrinology. 1992;17(5):423–441. doi: 10.1016/0306-4530(92)90001-n. [DOI] [PubMed] [Google Scholar]
- Kiecolt-Glaser JK, Preacher KJ, MacCallum RC, Atkinson C, Malarkey WB, Glaser R. Chronic stress and age-related increases in the proinflammatory cytokine IL-6. Proc Natl Acad Sci U S A. 2003;100(15):9090–9095. doi: 10.1073/pnas.1531903100. doi: 10.1073/pnas.1531903100. [DOI] [PMC free article] [PubMed] [Google Scholar]
- Kirschbaum C, Pirke KM, Hellhammer DH. The 'Trier Social Stress Test'--a tool for investigating psychobiological stress responses in a laboratory setting. Neuropsychobiology. 1993;28(1-2):76–81. doi: 10.1159/000119004. doi: 119004. [DOI] [PubMed] [Google Scholar]
- Kunz-Ebrecht SR, Mohamed-Ali V, Feldman PJ, Kirschbaum C, Steptoe A. Cortisol responses to mild psychological stress are inversely associated with proinflammatory cytokines. Brain Behav Immun. 2003;17(5):373–383. doi: 10.1016/s0889-1591(03)00029-1. [DOI] [PubMed] [Google Scholar]
- McEwen BS. Protective and damaging effects of stress mediators. N Engl J Med. 1998;338(3):171–179. doi: 10.1056/NEJM199801153380307. doi: 10.1056/NEJM199801153380307. [DOI] [PubMed] [Google Scholar]
- McEwen BS, Stellar E. Stress and the individual. Mechanisms leading to disease. Arch Intern Med. 1993;153(18):2093–2101. [PubMed] [Google Scholar]
- McInnis CM, Thoma MV, Gianferante D, Hanlin L, Chen X, Breines JG, Rohleder N. Measures of adiposity predict interleukin-6 responses to repeated psychosocial stress. Brain Behav Immun. 2014 doi: 10.1016/j.bbi.2014.07.018. doi: 10.1016/j.bbi.2014.07.018. [DOI] [PMC free article] [PubMed] [Google Scholar]
- Miller GE, Chen E, Fok AK, Walker H, Lim A, Nicholls EF, Kobor MS. Low early-life social class leaves a biological residue manifested by decreased glucocorticoid and increased proinflammatory signaling. Proc Natl Acad Sci U S A. 2009;106(34):14716–14721. doi: 10.1073/pnas.0902971106. doi: 10.1073/pnas.0902971106. [DOI] [PMC free article] [PubMed] [Google Scholar]
- Miller GE, Chen E, Sze J, Marin T, Arevalo JM, Doll R, Cole SW. A functional genomic fingerprint of chronic stress in humans: blunted glucocorticoid and increased NF-kappaB signaling. Biol Psychiatry. 2008;64(4):266–272. doi: 10.1016/j.biopsych.2008.03.017. doi: 10.1016/j.biopsych.2008.03.017. [DOI] [PMC free article] [PubMed] [Google Scholar]
- Miller GE, Rohleder N, Cole SW. Chronic interpersonal stress predicts activation of pro- and anti-inflammatory signaling pathways 6 months later. Psychosom Med. 2009;71(1):57–62. doi: 10.1097/PSY.0b013e318190d7de. doi: 10.1097/PSY.0b013e318190d7de. [DOI] [PMC free article] [PubMed] [Google Scholar]
- Murphy ML, Slavich GM, Rohleder N, Miller GE. Targeted Rejection Triggers Differential Pro- and Anti-Inflammatory Gene Expression in Adolescents as a Function of Social Status. Clin Psychol Sci. 2013;1(1):30–40. doi: 10.1177/2167702612455743. doi: 10.1177/2167702612455743. [DOI] [PMC free article] [PubMed] [Google Scholar]
- Nater UM, Whistler T, Lonergan W, Mletzko T, Vernon SD, Heim C. Impact of acute psychosocial stress on peripheral blood gene expression pathways in healthy men. Biol Psychol. 2009;82(2):125–132. doi: 10.1016/j.biopsycho.2009.06.009. doi: 10.1016/j.biopsycho.2009.06.009. [DOI] [PMC free article] [PubMed] [Google Scholar]
- Pasic J, Levy WC, Sullivan MD. Cytokines in depression and heart failure. Psychosom Med. 2003;65(2):181–193. doi: 10.1097/01.psy.0000058372.50240.38. [DOI] [PubMed] [Google Scholar]
- Piazza JR, Charles ST, Sliwinski MJ, Mogle J, Almeida DM. Affective reactivity to daily stressors and long-term risk of reporting a chronic physical health condition. Ann Behav Med. 2013;45(1):110–120. doi: 10.1007/s12160-012-9423-0. doi: 10.1007/s12160-012-9423-0. [DOI] [PMC free article] [PubMed] [Google Scholar]
- Pruessner JC, Kirschbaum C, Meinlschmid G, Hellhammer DH. Two formulas for computation of the area under the curve represent measures of total hormone concentration versus time-dependent change. Psychoneuroendocrinology. 2003;28(7):916–931. doi: 10.1016/s0306-4530(02)00108-7. [DOI] [PubMed] [Google Scholar]
- Radloff LS. The CES-D Scale: a self-report depression scale for research in the general population. Applied Psychological Measurement. 1977;1(3):385–401. [Google Scholar]
- Richlin VA, Arevalo JM, Zack JA, Cole SW. Stress-induced enhancement of NF-kappaB DNA-binding in the peripheral blood leukocyte pool: effects of lymphocyte redistribution. Brain Behav Immun. 2004;18(3):231–237. doi: 10.1016/j.bbi.2003.08.001. doi: 10.1016/j.bbi.2003.08.001. [DOI] [PubMed] [Google Scholar]
- Rohleder N. Stimulation of Systemic Low-Grade Inflammation by Psychosocial Stress. Psychosom Med. 2014 doi: 10.1097/PSY.0000000000000049. doi: 10.1097/PSY.0000000000000049. [DOI] [PubMed] [Google Scholar]
- Rohleder N, Marin TJ, Ma R, Miller GE. Biologic cost of caring for a cancer patient: dysregulation of pro- and anti-inflammatory signaling pathways. J Clin Oncol. 2009;27(18):2909–2915. doi: 10.1200/JCO.2008.18.7435. doi: 10.1200/JCO.2008.18.7435. [DOI] [PubMed] [Google Scholar]
- Sapolsky RM, Romero LM, Munck AU. How do glucocorticoids influence stress responses? Integrating permissive, suppressive, stimulatory, and preparative actions. Endocr Rev. 2000;21(1):55–89. doi: 10.1210/edrv.21.1.0389. [DOI] [PubMed] [Google Scholar]
- Scheinman RI, Cogswell PC, Lofquist AK, Baldwin AS., Jr. Role of transcriptional activation of I kappa B alpha in mediation of immunosuppression by glucocorticoids. Science. 1995;270(5234):283–286. doi: 10.1126/science.270.5234.283. [DOI] [PubMed] [Google Scholar]
- Schommer NC, Hellhammer DH, Kirschbaum C. Dissociation between reactivity of the hypothalamus-pituitary-adrenal axis and the sympathetic-adrenal-medullary system to repeated psychosocial stress. Psychosom Med. 2003;65(3):450–460. doi: 10.1097/01.psy.0000035721.12441.17. [DOI] [PubMed] [Google Scholar]
- Steptoe A, Hamer M, Chida Y. The effects of acute psychological stress on circulating inflammatory factors in humans: a review and meta-analysis. Brain Behav Immun. 2007;21(7):901–912. doi: 10.1016/j.bbi.2007.03.011. doi: 10.1016/j.bbi.2007.03.011. [DOI] [PubMed] [Google Scholar]
- Strahler J, Rohleder N, Wolf JM. Acute psychosocial stress induces differential short-term changes in catecholamine sensitivity of stimulated inflammatory cytokine production. Brain Behav Immun. 2014 doi: 10.1016/j.bbi.2014.07.014. doi: 10.1016/j.bbi.2014.07.014. [DOI] [PubMed] [Google Scholar]
- Tung J, Barreiro LB, Johnson ZP, Hansen KD, Michopoulos V, Toufexis D, Gilad Y. Social environment is associated with gene regulatory variation in the rhesus macaque immune system. Proc Natl Acad Sci U S A. 2012;109(17):6490–6495. doi: 10.1073/pnas.1202734109. doi: 10.1073/pnas.1202734109. [DOI] [PMC free article] [PubMed] [Google Scholar]
- Vasey MW, Thayer JF. The continuing problem of false positives in repeated measures ANOVA in psychophysiology: a multivariate solution. Psychophysiology. 1987;24(4):479–486. doi: 10.1111/j.1469-8986.1987.tb00324.x. [DOI] [PubMed] [Google Scholar]
- von Kanel R, Kudielka BM, Preckel D, Hanebuth D, Fischer JE. Delayed response and lack of habituation in plasma interleukin-6 to acute mental stress in men. Brain Behav Immun. 2006;20(1):40–48. doi: 10.1016/j.bbi.2005.03.013. doi: 10.1016/j.bbi.2005.03.013. [DOI] [PubMed] [Google Scholar]
- Watson D, Clark LA, Tellegen A. Development and validation of brief measures of positive and negative affect: the PANAS scales. J Pers Soc Psychol. 1988;54(6):1063–1070. doi: 10.1037//0022-3514.54.6.1063. [DOI] [PubMed] [Google Scholar]
- Wolf JM, Rohleder N, Bierhaus A, Nawroth PP, Kirschbaum C. Determinants of the NF-kappaB response to acute psychosocial stress in humans. Brain Behav Immun. 2009;23(6):742–749. doi: 10.1016/j.bbi.2008.09.009. doi: 10.1016/j.bbi.2008.09.009. [DOI] [PubMed] [Google Scholar]


