

Abstract
Nanotechnology approaches are actively being pursued for drug delivery, novel diagnostics, implantable devices, and consumer products. While considerable research has been performed on the effects of these materials on targeted tumor or phagocytic cells, relatively little is known about their effects on renal cells. This becomes critical for supersmall nanoparticles (< 10 nm), designed to be renally excreted. The active endocytic machinery of kidney proximal tubules avidly internalizes filtered proteins, which may also be the case for filtered nanoparticles. To test whether such interactions affect kidney function, we injected mice with either 5 nm dextran-based nanoparticles (DNP) that are similar in composition to FDA approved materials or poly(amido amine) dendrimer nanoparticles (PNP) of comparable size. These fluorescently tagged nanoparticles were both filtered and internalized by renal tubular epithelial cells in a dose and time dependent fashion. The biological effects were quantitated by immunocytochemistry, measuring kidney injury markers and performing functional tests. DNP administration resulted in dose dependent increase in urinary output, while cellular albumin endocytosis was increased. The expression of megalin, a receptor involved in albumin uptake, was also increased but AQP1 expression was unaffected. The effects after PNP administration were similar but additionally resulted in increased clathrin expression, and increased endocytosis of dextran. We conclude that there are no major detrimental renal effects of DNP on overall kidney function but changes in endocytosis mediating protein expression do occur. These studies provide a framework for the testing of additional nanoparticle preparations as they become available. Nanomaterials have enjoyed widespread use for different biomedical applications because they can be synthesized easily, adapted in modular fashion, used to exploit multivalency of attached affinity ligands for improved avidity,1 designed as smart sensors,2 designed to incorporate therapeutics (theranostics)3 and detected by multiple imaging techniques (multimodality imaging). While most therapeutic nanoparticles (NP) are designed in the 30–300 nm size range, imaging agents are often smaller. For example, dextran coated magnetic NP for MR imaging are often 30–50 nm, while other materials have been designed in the <10 nm range with the intention for them to be renally cleared.4,5 More recently, polymer-derived materials have also been synthesized in this size range6 as it became clear that they would offer unique advantages over larger materials. However, little is known about how highly specialized renal tubular cells process these small materials. Tubular cells encounter especially high local concentrations of such supersmall nanomaterials. While conventional hematoxylin and eosin (HE) stains done as part of regular toxicity studies are often normal, recent transmission electron microscopy (TEM) studies have revealed mitochondrial alterations in renal tubular epithelial cells up to 6 months after intravenous injection of quantum dots7. While metal based NPs represent a unique set of toxicity concerns, we set out to determine the effects of polymer based materials. We were particularly interested in a dextran coated type of material, given its similarity to an FDA approved preparation and effective macrophage targeting capabilities in vivo.8
Keywords: nanotechnology, dextran, nanoparticles, kidney, epithelial cells, toxicity
The proximal tubules of the renal nephron have an extremely active endocytic machinery and they internalize filtered proteins, leaving urine almost protein free. We hypothesize that the filtered (< 5 nm)4 NPs will be avidly internalized and processed by the proximal tubules, but during this process NPs may accumulate in proximal tubules affecting the function of this segment. Several studies have shown that direct interaction of diverse NPs may induce changes in protein conformation.9 A recent study using a 3-D kidney proximal tubule organoid in vitro model showed that exposure to dendrimer produces injury markers such as cytokines, kidney injury marker-1 (KIM-1), and affects cell viability.10 Several metal based NPs are known to induce nephrotoxicity and different levels of adverse renal effects.11,12 A study involving non-human primates showed that quantum dots are safe to administer13 while some other reports raised concerns over their use14,15 because of the heavy metal content. Interestingly, toxicity analyses showing adverse effects of NPs have been most often performed in vitro compared to in vivo testing.16 Higher molecular weight dextran (dextran 70) that is used as a plasma expander is associated with renal failure at extremely high doses.17 These studies point out the necessity to investigate the functional consequences caused by NP-tissue interaction in vivo. Because the kidney is important for the maintenance of whole body homeostasis, how renal epithelial cells handle and are affected by filtered NPs is an important question to resolve.
Here, we show the dose dependent effect of dextran-based and dendrimer-based NPs on mouse renal tissues. We IV-injected the NPs at varying concentrations, collected 24 h urine, and measured several urinary factors. For short term chronic application, animals were injected with NPs three times with an interval of 48 h between each application. Immunofluorescence microscopy and electron microscopy techniques were used to study the presence of NPs, renal proximal tubule proteins, and glomerular morphology. We found differences in several urinary factors and changes in expression of some proximal tubule proteins in a dose and material dependent manner. In general, within the applied doses, we did not find any major detrimental functional effects on the kidney in the short term for the particles tested. However, the observed changes in proximal tubule endocytosis and protein expression at the cellular level indicates that these parameters should be closely monitored during the administration of existing nanoparticles, as well as throughout the development of new nanoprobes.
RESULTS AND DISCUSSION
Synthesis and in vivo distribution of dextran nanoparticles (DNP)
DNP were synthesized by cross-linking 10 kD dextran molecules with epichlorohydrin under alkaline conditions followed by amination with ethylenediamine.8 The product was dialyzed for several days to obtain a pure DNP preparation. The size of the synthesized NP was controlled by the length of cross-linking reaction time.8 We used DNP with a mean size distribution of 5 nm, since particles less than 5.5 nm can be filtered by the kidney.4 For in vivo application, the surface amines were labelled using one or two fluorochromes per particle. We used Vivo Tag-680XL (VT680XL, Perkin Elmer) for this purpose. The remaining amines were capped by reacting with excess succinic anhydride. The size of the fluorochrome is ~1.5 kD and one or two VT680XL were attached per DNP - this did not affect substantially the final size of the DNP (Figure 1a).
Figure 1.

Synthesis and biodistribution of DNP: (a) Shows the steps in the NP synthesis using 10 kD carboxymethyl dextran as a base material. After the amination step, one or two fluorochromes per NP were added, and the remaining amines were succinylated. (b) DNP size distribution determined by dynamic light scattering. The distribution shows a peak corresponding to a 5 nm particle size. (c) Biodistribution of radio-labelled 89Zr-DNP 5 reported as percent of injected dose per gram tissue (%ID/g). Data are pooled from three animals at 3, 6, 21 and 72 h after the injection.
After the surface modification steps, the DNPs were purified by size exclusion chromatography. The size distribution of DNP was determined using dynamic light scattering. Figure 1b shows the size distribution of DNPs with a peak at 5 nm. To simplify whole body biodistribution studies, DNPs were radiolabeled with zirconium-89.
To confirm that fluorophore tagging and radiolabeling approaches do not alter the macroscopic distribution of NP, we performed correlative autoradiography and fluorescence microscopy. We observed similar distributions with either label (Fig. S1). The whole body distribution of NP was determined after 3 h, 6 h, 21 h and 72 h, and expressed as the percentage of injected dose per gram tissue (%ID/g)(Figure 1c). The data are derived from a pool of three animals for every measurement point. As expected from the urinary excretion data, high accumulation of DNP was seen in kidneys, although it did decrease to some extent over 72 hours. This is all consistent with a substantial uptake of filtered DNPs by the highly endocytotic epithelial cells of the proximal tubule nephron segment. Accumulation of these particles in the proximal tubules may adversely affect the function of this nephron segment and therefore, of the entire kidney. The following experiments were designed to examine this possibility.
Endocytic uptake of nanoparticles in the proximal tubule
We first evaluated fluorophore tagged DNP uptake into the renal tubules. To compare the effect of different materials of the same size, we used PAMAM dendrimer based branched nanoparticles (PNP). They have a high molecular uniformity and specific size and shape characteristics.18 We used commercially obtained (Dendritech Inc, USA) generation 5 (g5, 5.4 nm size) PAMAM. The PNP were tagged with Vivo Tag-645 (VT645, Perkin Elmer) on the end standing amines at a density of one or two fluorophores per particle. Remaining amines were capped by reacting with excess succinic anhydride. These steps not only help in detection by microscopy, but also avoid the well known toxicity due to the cationic nature of these particles.19–21 As shown in Figure 2, DNPs and PNPs were readily taken up by proximal tubules from the ultrafiltrate. Both particles were injected as a single bolus through the tail vein of mice at a concentration of 40 mg/kg of body weight (BW). To study the uptake of particles in the kidney, 24 h post injection animals were fixed by full body perfusion via the left cardiac ventricle using paraformaldehyde. Cryosections (5 μm) obtained from the kidney of these animals were imaged using confocal microscopy. The upper panels of Figure 2 is in the far red channel and is merged with background fluorescence from the green channel to help visualize the location of NPs with respect to the renal tubules. The selected region shown in each of the top panels is enlarged and shown in the bottom row of panels to illustrate the presence of many fluorescent vesicles within the proximal tubule cells. The large fluorescent vesicles correspond mainly to the distribution of lysosomes in this tubule segment (column 3 and 5). These data indicate that NPs that crossed the glomerular filtration barrier were avidly taken up by proximal tubules, the most highly endocytotic cells in the nephron. Other tubules are only weakly stained but some cells in the glomerulus (G) contained fluorescent material that was most evident with PNP. Note that DNPs are not retained in the proximal tubule cells 7 days post injection (column 4).
Figure 2.
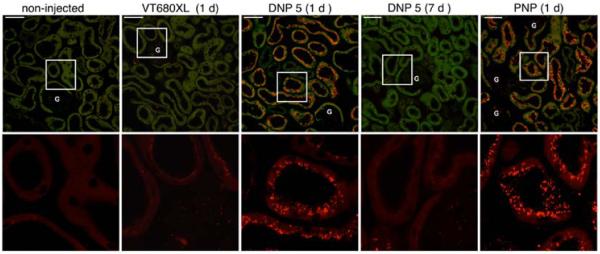
Nanoparticle distribution in the renal cortex. The distribution of VT680XL, DNP-VT680XL and PNP-VT645 are shown. The upper panels show the distribution of NP in the far red channel merged with a green channel autofluorescence from the tissue. The merged images help to visualize particle distribution within the renal tubules. Tubules from mice injected with fluorophore alone (column 2) do not show the punctate distribution that is seen with fluorophore tagged NP (columns 3 and 5). DNP 5 is cleared from the kidney within 7 days after injection (column 4). All images are following a single NP injection of 40 mg/kg BW. The amount of VT680XL (column 2) injected was calculated from the equivalent moles of fluorophore present in the DNP-VT680XL. Selected regions (white squares) from the upper panels are enlarged in the lower panels. NP fluorescence in large vesicles may represent lysosomal structures within proximal tubule cells. Only the red channel is shown in the lower panels. G = glomerulus. Scale bar = 50 μm.
We also performed several control experiments to determine the stability of fluorophore tagged NP in the serum and in the urine. We found that the fluorophore tagged NPs were stable in the serum for at least 24 h at 37°C (Fig. S2). The radiolabeled and fluorophore tagged NP excreted in the urine also appeared stable (Fig. S3). To asses whether organic fluorophore labeling affects the cellular localization of NP, we co-injected dextran based NP tagged with Alexa Fluor 488 and VT680XL (Fig. S4). After 24 h the kidney was fixed and tissue sections were analyzed using confocal microscopy. We found no difference in cellular localization of studied fluorophores (Fig. S4), indicating that the DNP tagged with VT680XL is a representative renally filterable NP that is appropriate for our studies.
Renal function after nanoparticle treatment
To assess the functional effect of injection of DNPs and PNPs on various aspects of kidney function, metabolic cage experiments were performed. Mice were adapted to the metabolic cages for 4 days before commencing the experiment, and they received ad libitum food and water throughout. Animals were bolus injected through the tail vein with 5, 10, 20, 40 mg/kg BW of NP, and 24 h urine samples were collected under mineral oil to avoid evaporation. To test the short term effects of chronic application, 40 mg/kg NPs were injected three times with 48 h between each application. After the third injection, 24 h urine samples were collected. The control groups were injected with saline or an equivalent amount of the respective fluorophore (VT680XL or VT645) in saline. There was no statistically significant different change in body weight, food intake, or water intake after DNP injections (Fig.3a–c). In contrast water intake was significantly reduced after the 40 mg/kg and 3 × 40 mg/kg PNP treatments (Fig 3c). Urine volume increased significantly after injecting 3 × 40 mg/kg DNPs (Fig. 3d). In the case of PNP it increased in a dose dependent manner after injecting 5 – 20 mg/kg with significant increase after 20 mg/kg, but then was reduced at higher doses (Fig. 3d). The fractional urinary excretion (ratio of water intake to urinary excretion) also showed a clear dose dependent increase up to 20 mg/kg of PNP, but also diminished after 40 and 3 × 40mg/kg injection (Fig. 3e). On the contrary DNP showed a significant increase after 40 and 3 × 40mg/kg injection (Fig. 3e). These results show a “biphasic” response to PNP injection that may reflect an initial inhibitory effect of the PNP on fluid transport across the proximal tubules. The reversal of this effect at much higher and repeated doses could reflect general toxicity that affects overall tubule function. Measuring the total urinary protein, albumin, and cystatin (a kidney injury marker), showed no significant difference compared to controls in any of the applied NP dose (Fig. 3f–h). To address the particle and concentration dependent differential effects of these NPs, some of the measured parameters were further examined by studying endocytosis by proximal tubules and examining the expression of some of the major proteins that are involved in tubular transport and endocytosis.
Figure 3.
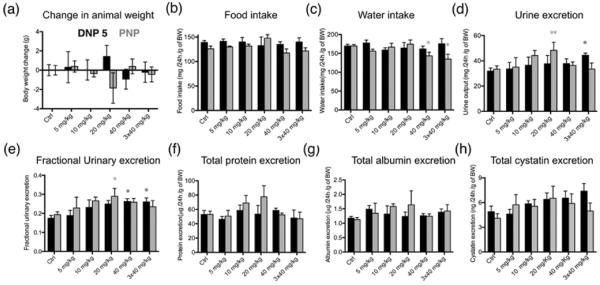
Metabolic cage experiments. Animals were injected with DNP 5 and PNP at 5 (n=3), 10 (n=4), 20 (n=4), 40 mg/kg BW (n=7) and urine was collected for 24 h. For short term chronic application tests, the animals were injected with 40 mg/kg 3 times with 48 h between each injection (n=6). Black bars show the effect of DNP 5 injection and grey bars show the effect after PNP injection. Ctrl values are calculated from the data before application of NP. Injecting NPs did not change the bodyweight (a) or the food intake (b) of the animals significantly. The water intake of the animals (c) was significantly reduced after injecting PNP at a concentration of 40 mg/kg and 3 ×x 40 mg/kg, but injecting DNP 5 did not induce any difference. (d) Urine excretion was significantly elevated after 20 mg/kg of PNP, while 3 × 40 mg/kg DNP 5 caused a significant increase in urinary excretion. (e) Ratio of water intake to urinary excretion shows that 20 mg/kg PNP caused significantly increased values whereas 40 mg/kg and 3 × 40 mg/kg injection of DNP 5 showed significantly increased excretion. (f) Total protein in the urine show no significant difference. (g) Total urinary albumin was not significantly changed after NP injection. (h) Urinary cystatin values did not significantly change upon NP injection. All values were calculated per gram of BW to avoid errors due to change in BW. Protein, albumin and cystatin values were corrected for the total urine volume for 24 h.
Effects of nanoparticles on proximal tubule endocytosis
Dextran uptake is increased after NP injection
The proximal tubules of the renal nephron have an extremely active endocytic machinery and they endocytose much of the filtered protein load, leaving just trace amounts of protein in the urine. Polymeric dextran is a commonly used material for general endocytosis studies.22 To study any difference in the general endocytosis mechanism, animals were injected with fluorophore (rhodamine) tagged 10 kD dextran after previously injecting them with the highest concentration of NPs used in the current study, 3 × 40 mg/kg. 24 h after the last injection animals were injected with 60 mg/kg BW of 10 kD rhodamine-dextran for 15 min and the animals were fixed by left ventricular whole body perfusion. 5 μm cryosections from the kidneys of these animals were imaged for rhodamine-dextran. As shown in figure 4a DNP injected animals did not show any significant difference in dextran uptake, whereas PNP injected animals showed a significant increase in the presence of dextran in proximal tubules of the kidney cortex. Figure 4b shows the average pixel intensity measured from over 200 proximal tubules from 5 different animals in each condition. These data show that endocytosis in proximal tubules is unregulated after PNP injection.
Figure 4.
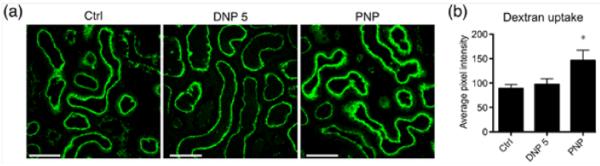
Dextran endocytosis is increased after PNP injection. 3 × 40 mg/kg injection of PNP significantly increased the general endocytosis in the proximal tubules. We used 10 kD dextran-alexa 488 to test the general endocytosis activity in renal tubules. (a) Images show endocytosis of dextran. Scale bar = 50 μm. (b) Average intensity from proximal tubules measured from 5 animals in each condition. Over 200 tubules were analyzed per condition.
Albumin endocytosis is increased after NP injection
Albumin is the major protein in plasma that regulates the colloidal osmotic pressure of blood. Some albumin passes into the lumen of the proximal tubules by glomerular ultrafiltration and is endocytosed by these tubules where it is either processed into smaller fragments in lysosomes, or transcytosed intact back to the blood.23,24 In this experiment we determined albumin endocytosis in DNP and PNP injected mice. In addition we also tested a larger sized DNP (13 nm prepared identically to the 5 nm particle) to determine size effects. Second, ferumoxytol, an FDA approved 17–30 nm dextran coated iron oxide nanoparticles were tested.25,26 The latter are used as an iron replacement product based on their iron core within the dextran shell. Figure 5a depicts the distribution of these NPs endocytosed by proximal tubules in the renal cortex. Panels in the top row show the NP distribution in the far red channel merged with the background from a green channel for DNP 13 nm and ferumoxytol. The boxed regions from both panels are enlarged in the lower panels. In the 13 nm DNP injected tissues, the fluorescent nanoparticles are mostly restricted to the glomeruli (G), with little or no uptake in the proximal tubules, presumably indicating that they are not filtered. In the case of ferumoxytol, unexpectedly, we found considerable uptake into the proximal tubules. This probably indicates the very broad size distribution of these particles with a fraction of them that are small enough to cross the filtration barrier and enter the proximal tubules lumen. 24 h after NP injection (40 mg/kg), 20 mg/kg BW of bovine albumin (Invitrogen) tagged with alexa 488 was injected into some mice. After 15 min, animals were perfusion fixed using paraformaldehyde through the left ventricle.
Figure 5.

Albumin uptake by the proximal tubules significantly increased after NP injection. (a) DNP 13 is mostly in the glomerulus and proximal tubules are not labeled, indicating that a very small fraction is filtered. Ferumoxytol, on the other hand has a filtered fraction that is taken up by proximal tubules. The upper panels show the distribution of NP in the far red channel merged with a green channel autofluorescence from the tissue. (G = glomerulus). Lower panels are enlargements of the far red channel selection shown by the white square. Scale bar = 50 μm. (b) Upper panels show fluorophore tagged bovine albumin taken up by the tissue. Scale bar = 500 μm. The lower panels show immunogold labeling performed to detect albumin and imaged using electron microscopy. The luminal side with brush border membranes is shown in these images. Numerous subapical vesicles are labeled with the gold particles indicating abundant albumin uptake. Scale bar = 500 nm. (c) Shows the average pixel intensity from proximal tubules that contain fluorophore tagged albumin. The bar graph shows that DNP 5 and PNP injected tubules have a significantly increased uptake of albumin. DNP 13 and ferumoxytol show no difference compared to controls. 4 animals were used for quantification in every condition and at least 200 tubules were analyzed.
In Figure 5b, upper panels show that compared to controls, DNP 5 and PNP have a greater fluorescent intensity within renal tubules. The lower panels in Figure 5b show electron micrographs of the immunogold labeling of albumin in proximal tubules from the same animals as the upper panel proximal tubules. The average pixel intensity of proximal tubules from DNP 5 and PNP injected tissues was significantly higher than in control animals (Figure 5c). DNP 13 and ferumoxytol did not show any difference in average fluorophore intensity compared to the control group (Figure 5c). These data show that there is a significant difference in the proximal tubule uptake or processing of albumin after DNP 5 and PNP injection.
PNP endocytosis is increased in DNP pretreated mice
To test whether treatment with one kind of NP will affect the uptake of a subsequently administered NP, we pretreated mice with DNP (short-term chronic application: 3 times 40 mg/kg DNP with 48 h interval between applications). Twenty four hours later, PNP was injected (40 mg/kg). As controls, animals were treated similarly with VT-680XL at a molar concentration equivalent to that present in the injected dose of DNP. Figure 6b shows the average pixel intensity of PNP calculated from > 120 tubules from 4 animals each. Average PNP intensity from DNP pretreated animals was significantly higher compared to that of animals treated with fluorophore alone. These data confirm that the proximal tubule endocytosis mechanism is affected by NP treatment. This difference could be caused either by delayed clearance/processing from the tubule or by increased uptake caused by the altered expression/activity of endocytosis mediating membrane proteins. If the increased endocytosis is caused by the latter, altered endocytosis of other filtered proteins would also be expected. For long-term chronic exposure these factors need to be taken into account for proper dosage of the material. Two endocytosis mediating proteins, megalin and clathrin, are of high interest in this regard. We, therefore, next studied the expression levels of these two proteins in NP treated animals.
Figure 6.

PNP endocytosis is increased after DNP pretreatment. (a) Upper panels show PNP-Alexa 488 (green channel) images of PNP-treated mouse kidney cortex without (left panel) or with DNP pretreatment (right panel). Lower panels show images from the same tissue section treated with VT680XL alone (lower left panel) or DNP-VT680XL (lower right panel). (b) Quantification of the pixel intensity from proximal tubules containing PNP shows that DNP pretreatment significantly increases the PNP endocytosis. More than 120 tubules from 4 animals each were used for quantification.
Proximal tubular endocytotic protein expression in nanoparticle-treated mice
Megalin expression is significantly increased after DNP and PNP injection
Megalin is a multiligand receptor that is responsible for the normal cellular uptake of many filtered proteins and other molecules from the proximal tubule lumen.27 Changes in megalin expression in the proximal tubules are implicated in acute kidney injury (AKI)28 and diabetic nephropathy.29 Therefore, we used immunofluorescence microscopy to examine the expression and localization of megalin in proximal tubules after 20 mg/kg and 3 × 40 mg/kg BW NP injection. Megalin expression in the DNP 5 injected tissues was significantly increased at both concentrations used (Figure 7a,b). Whereas PNP induced a statistically significant increase in megalin expression after 3 × 40 mg/kg injection, the 20 mg/kg injection showed an apparent increase but it was not statistically significant (Figure 7a,b). A minimum of 200 tubules from at least four animals were analyzed in every condition. DNP 13 and ferumoxytol injected tissues did not show any difference compared to the control tissues (Figure 7c). This increase in megalin expression corresponds to the increase in albumin uptake detected in the previous set of experiments.
Figure 7.

Megalin expression is increased significantly after NP injection. (a) Representative immunofluorescence images showing the effect of injecting DNP 5 and PNP at concentrations of 20 mg/kg and 3 × 40 mg/kg. Ctrl animals are injected with the respective fluorophores alone. Columns 2 and 4 show magnifications of the regions highlighted by white squares from the respective panels at the left in columns 1 and 3. Megalin is expressed in the apical plasma membrane of all proximal tubules cells. (b) Quantification of the pixel intensity from proximal tubules expressing megalin shows that injecting NPs increased the expression of megalin. Both DNP 5 and PNP at 3 × 40 mg/kg significantly increased megalin expression, whereas only DNP5 at lower concentration (20 mg/kg) increased megalin expression significantly. The number of animals used was: ctrl (10), DNP 5 20 mg/kg and PNP 20 mg/kg (4 each), DNP 5 3 × 40 mg/kg (7), and PNP 3 × 40 (6). At least 200 tubules were analyzed in each condition (200–400). (c) Immunofluorescence images of kidney sections showing control and 3 × 40mg/kg application of DNP 13 and ferumoxytol. Injecting these NPs did not alter the expression of megalin in the kidney of these animals.
PNP (but not DNP) significantly increases clathrin expression in proximal tubules
Clathrin plays a major role in the coated vesicle pathway for endocytosis of extracellular material. In proximal tubules, megalin and its associated ligands are internalized via this pathway.27 Using immunofluorescence we explored the expression of clathrin after NP injection. DNP 5, DNP 13, and ferumoxytol did not have an effect on the average expression of clathrin. On the contrary, clathrin expression was significantly increased after 3 × 40 mg/kg BW PNP injection (Figure 8a,b). A minimum of 130 tubules were analyzed from at least 4 animals in every experimental condition. Again, this increase in apical clathrin expression is consistent with the observed increase in endocytotic activity at the apical pole of proximal tubules cells after PNP injection seen in the dextran uptake experiment.
Figure 8.

Repeated PNP injection significantly increased the expression of clathrin. (a) Representative immunofluorescence images showing the effect of injecting DNP 5 and PNP at concentrations of 20 mg/kg and 3 × 40 mg/kg. Ctrl animals were injected with the respective fluorophores alone. The second and fourth columns of images are magnifications of regions highlighted by white squares in the corresponding left panels. Clathrin is highly expressed in the subapical region of all proximal tubule cells. (b) Quantification of the pixel intensity from the proximal tubules expressing clathrin shows that injecting PNP at 3 × 40 mg/kg significantly increased the expression of clathrin. DNP 5 did not alter clathrin expression. Four animals were used per condition and at least 200 tubules were analyzed for each treatment. (c) Immunofluorescence images of kidney sections showing control and 3 × 40 mg/kg injection of DNP 13 and ferumoxytol. Injecting these NPs did not produce any difference in clathrin expression compared to the control tissues.
AQP1 expression after NP injection
The expression of AQP1, a major proximal tubule water channel, was studied in the NP injected mouse. Tissues from DNP 5 and PNP injected animals were analyzed using immunofluorescence microscopy. AQP1 is expressed differentially along the length of the proximal tubules. The initial S1 and S2 segments of the proximal tubules show lower expression compared to that of the later S3 segment. We calculated the average fluorescence intensity values from S1/S2 segments and S3 segments separately. Though the S1/S2 segment showed a somewhat reduced expression of AQP1 after 3 × 40 mg/kg NP injection of DNP 5 and PNP, it was statistically not significant under these conditions (Figure 9a,b)(>110 tubules for S1/S2 and >160 tubules for S3 segment from at least 4 animals). The average intensity values from the S3 segment of NP injected animals did not show any difference compared to that of control tissues (Figure 9a,c).
Figure 9.

NP injection has no significant effect on the expression of AQP1 in proximal tubules. (a) Representative immunofluorescence images showing the effect of injecting DNP 5 and PNP. Two panels of images are shown for both DNP 5 and PNP, displaying the AQP1 expression specific for S1/S2 (columns 1 and 3) and S3 segments of the proximal tubules (columns 2 and 4). (b,c) Average pixel intensity from S1/S2 and S3 segments shown in separate bar graphs. Quantification of the pixel intensity from S3 segments did not reveal any change in expression (c). Though a decreasing trend in average fluorescence intensity was seen in the case of S1/S2 segment after the injection of 3 × 40 mg/Kg (both NPs, (b)), it was not statistically significant. Scale bar = 50 μm.
Cystatin expression in proximal tubules is unchanged after NP injection
Cystatin C is a biomarker that is used as an indicator of kidney function. It is found in almost all body fluids and tissues and it is produced by all nucleated cells. It is a potent inhibitor of lysosomal proteinases. Cystatin C is filtered by ultrafiltration and taken up by the proximal tubules. Here we studied the effect of NP injection (DNP 5 and PNP) on the cystatin content of proximal tubules by using immunofluorescence microscopy. NPs were injected at 20 mg/kg and 3 × 40 mg/kg BW concentration. Cystatin had a higher degree of uptake in the S1/S2 segment of proximal tubules compared to the S3 segment. Calculating the average pixel intensities from the tubules expressing cystatin C after different doses of NP injection showed no significant difference (Figure 10a,b). >70 tubules from 4 animals in each condition were analyzed.
Figure 10.
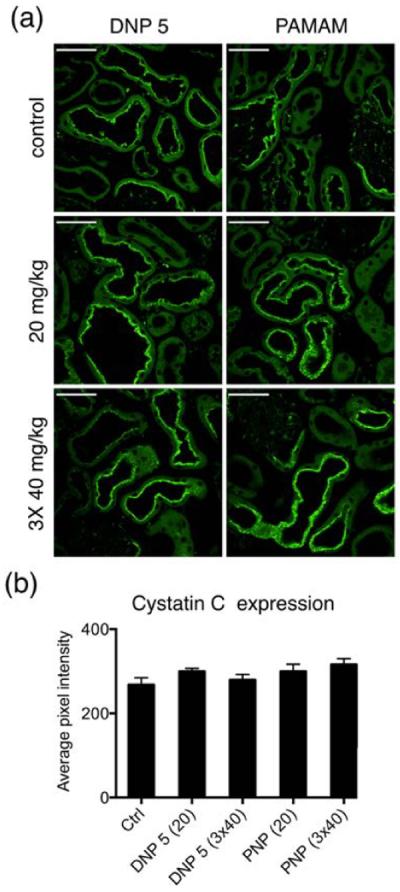
Cystatin C expression in the kidney did not change after NP injection. (a) Immunofluorescence images of kidney cryosections showing the expression of cystatin C. Scale bar = 50 μm (b) Bar graph showing the average fluorescence intensity of proximal tubules. Injecting NPs did not change the expression of cystatin C.
We also examined the kidney injury marker 1 (KIM1), but could not detect any KIM1 expression after NP injection (data not shown). Further, the glomerular morphology studied using scanning electron microscopy also did not show any difference (data not shown). While our metabolic cage experiments did not show any gross functional defects after injecting any of the NPs, there were some interesting observations that suggest that the NPs did have some effects on renal function. Especially the modulatory effect on endocytosis mediating protein expression and the effect seen on general endocytosis and albumin uptake.
We consistently found a concentration dependent effect after DNP 5 and PNP injection on various measured parameters. DNP 5 increased urine excretion in a dose dependent manner, while other parameters were unaffected (total protein, albumin, and cystatin). Interestingly, PNP had a clear biphasic effect on urine volume that was maximal around 20 mg/kg, and thereafter decreased at higher concentrations, while the water intake was significantly decreased at higher concentrations. PNP administration resulted in an increase of general endocytosis that could be related to the higher levels of apical clathrin expression seen under these conditions. In contrast, DNP injection did not affect general endocytosis as seen from the dextran uptake studies, and there was also no change in clathrin expression after DNP 5 injection. However, both DNP 5 and PNP increased albumin uptake into the tubule cells. Albumin uptake in proximal tubules is dependent on megalin27,30 and the observed increase in this receptor is consistent with the increased uptake of albumin into the proximal tubules induced by NPs. This increase in megalin may have additional significance for proper kidney function. Megalin is a receptor that mediates the endocytosis of a multitude of filtered molecules including cytokines and nephrotoxins. On the other hand megalin is also known to endocytose molecules that protect the kidney against acute kidney injury.30 Thus, an increase in megalin expression may also act as a mechanism to protect the kidney from injury in some circumstances. Another membrane protein in proximal tubules, AQP1, showed no detectable change in apical expression under any conditions, indicating that the increased apical membrane expression of megalin was not a nonspecific effect on all apical membrane proteins. Furthermore, the increase in urine output seen under some conditions was not correlated with changes in the proximal tubule water channel AQP1, although other water channels and transporters that play a role in urine concentration in different nephron segments were not examined in this study.
CONCLUSIONS
Taken together our data show that the NPs we examined have only subtle effects on the kidney, and on tubular handling of filtered proteins. These effects are reflected by changes in endocytosis mediating apical membrane proteins that play a role in proximal tubule endocytosis. While these changes do not seem to have a major influence on some important kidney functions that were examined here under relatively acute conditions, the potential effect of long term chronic application of DNP 5 and perhaps other nanoparticles remains to be determined.
MATERIALS AND METHODS
Synthesis DNP5-NH2
DNP5-NH2 was prepared following a modified previously published procedure8. Carboxymethyl dextran (1.8 g, mean m.w. 10 kDa) was dissolved in 9 ml of water at 60 °C. The solution was cooled to room temperature (RT) and stirred for 4 h then 5 N aqueous NaOH (15 ml) and epichlorohydrin (6 ml) were added. The mixture was stirred at RT for 5 h and ethylenediamine (26 ml) was added drop-wise to the reaction mixture, keeping the temperature below 20°C. This mixture was allowed to stand at RT for 15 h. The crude DNP-NH2 mixture was precipitated with ethanol (21 ml), centrifuged, and decanted. The pelleted DNP-NH2 was dissolved in 10 ml of water and dialyzed against 150 mM NaCl for several days until the optical density (420 nm) of the dialyzing solution was lower than 0.02. Dextran concentration was determined employing a known sugar reducing quantitative colorimetric method in the presence of phenol and sulfuric acid.31 The percentage of dextran's contribution to the total weight of the particle was subsequently determined by azeotropic distillation of water with acetonitrile, followed by lyophilization for several days. Amine concentration relative to dextran was quantified following the published procedure of Snyder and Sobocinski32 were 1.09, and 1.17 μmol/mg dextran for the 5 and 13 nm DNP preparations, respectively.
Modification DNP 5-NH2 to give DNP 5-VT680XL-Sc and 89Zr-DNP
VivoTag680XL-NHS (40 μl, 2.5 mM in DMF) and aqueous sodium bicarbonate (600 μl, 100 mM, pH 8) were added to a solution of DNP 5-NH2 (8.3 mg dextran, 2.8μmol NH2) in 300 μl MilliQ water and the mixture was shaken at RT overnight (ON). The product DNP 5-VT680XL-NH2 was isolated using a centrifugal membrane filter (3-kDa mwco, Amicon Ultra-0.5 ml, Millipore), washed with 300 μl MilliQ-water six times, then collected in 100 μl MilliQ-water solution. The blue DNP 5-VT680XL-NH2 solution was reacted with succinic anhydride (776 mM, 400 μl DMSO) at RT for 24 h, concentrated using the centrifugal filter (3-kD mwco, Amicon Ultra-0.5 ml, Millipore), washed with 300μl MilliQ-water six times, then collected in 100 μl MilliQ-water to give C10(5)-VT680XL-Sc nanoparticles. Analysis by size-exclusion chromatography (column: Superdex 75, 10/300 GL; elution buffer: phosphate (50 mM), NaCl (150 mM) buffer (100 mM) pH 7.0; flow rate: 0.5 ml/min) showed a single peak eluting at 29.4 min (665 nm detection). Particle size was measured by dynamic light scattering (DLS) and found to have a mean diameter by percent volume of 5.7 ± 0.4 nm with a polydispersity index (PdI) of 0.298.
For radiolabeling, DNP 5-NH2 was reacted with p-isothiocyanatobenzyl desferoxamine (SCN-Bz-Df; Macrocyclics, TX). Complexing with with 89Zr to give 89Zr-DNP 5 was performed at room temperature as previously described.8 The radiochemical yield and purity were determined using radio-thin-layer chromatography using 50 mM EDTA as a mobile phase.
Synthesis of PAMAM(G5)-VT645-Sc
PAMAM G5 dendrimer (10.0 mg, 0.34 μmol, 44.4 μmol NH2) was dissolved in 100 μl DMSO and diluted with 200 μl aqueous sodium bicarbonate (100 mM) and 50 μl MilliQ water. To this, 48 μl of VivoTag 645-NHS (2.5 mM in DMF) was added. After stirring for 3 h, the mixture was transferred to a centrifugal membrane filter (3-kD mwco, Amicon Ultra-0.5 ml, Millipore) containing 100 μl of MilliQ water and centrifuged at 12,000 rcf for 10 min. Contents of the filters were diluted with 300 μl MilliQ water and centrifuged at 12,000 rcf for 10 min. This washing step was repeated 5 more times. The contents of the filter (~100 μl) were treated with 400 μl of succinic anhydride solution (776 mM in DMSO) and 50 μl of aqueous sodium bicarbonate (100 mM). After shaking for 3 h, the reaction mixture was again transferred to a 3-kD mwco centrifuge filter containing 100 μl of MilliQ water and centrifuged at 12,000 rcf for 10 min. Contents of the filters were diluted with 300 μl MilliQ water and centrifuged at 12,000 rcf for 10 min. This washing step was repeated 5 more times. Analysis by size-exclusion chromatography (column: Superdex 200, 10/300 GL; elution buffer: phosphate (50 mM), NaCl (150 mM) buffer (100 mM) pH 7.0; flow rate: 0.5 ml/min) showed a single peak eluting at 28.9 min (645 nm detection). Particle size was measured by DLS and found to have a mean diameter by percent volume of 6.1 ± 0.3 nm with a PdI of 0.170.
Synthesis of DNP13-VT680XL
DNP13 was prepared, modified, and purified in the same manner as DNP5-NH2 with the exception that the reaction between dextran and epichlorohydrin was allowed to proceed for 20 h. Particle size was measured by DLS and found to have a mean diameter by percent volume of 13.3 ± 0.2 nm with a PdI of 0.093.
Synthesis of Ferumoxytol-VT680XL
Ethylenediamine (3 mL, 2 M in MilliQ water) and (N-(3-dimethylaminopropyl)-N-ethylcarbodiimide hydrochloride (1.0 g, 5.5 mmol) was added to ferumoxytol (9 mL, 6 mg/mL) in MilliQ water. The pH was adjusted to 6.5 with 1 M NaOH (aq) and the mixture was allowed to stand at RT overnight. The crude aminated ferumoxytol was dialyzed against sodium-citrate buffer (20 mM, pH 8). Aminated ferumoxytol (2.0 mL, 6 mg/mL) was mixed with VT680XL-NHS (600 uL, 0.5 mM, DMF) and allowed to stand at RT overnight. The product was purified by size-exclusion chromatography (PD-10 cartridge) by elution with MilliQ water. Particle size was measured by DLS and found to have a mean diameter by percent volume of 21.7 ± 0.4 nm (% volume) with a PdI of 0.120.
Biodistribution studies
Animal experiments were approved by the Massachusetts General Hospital Institutional Committee on Research Animal Care in accordance with the National Institutes of Health's Guide for the Care and Use of Laboratory Animals. Male C57BL/6 animals (Jackson laboratory) aged 8 months were used for the experiments. 89Zr-DNP (150 μCi) was injected into the tail vein of the mice. After killing (at different time points) by exsanguination, mice were perfused with 10 mL of PBS. Organs were harvested, weighed, and their activity was measured with a γ counter (1480 Wizard 3-inch PerkinElmer, Waltham, MA). Biodistribution data were corrected for radioactive decay and residual radioactivity at the injection site and represented as percentage of injected dose per gram of tissue (%ID/g).
Metabolic cage experiments
For collecting 24 h urine, animals were placed in metabolic cages (Techniplast). Mice were adapted for 4 days before commencing the experiment. They were maintained in a temperature-controlled room regulated on a 12 h light-dark cycle with ad libitum access to food (standard laboratory chow) and water. 24 h urine from the 5th day was collected (under mineral oil) as the control. On day 5 animals under isofluorane anesthesia were injected with NPs at the desired concentration (5 mg/kg, 10 mg/kg, 20 mg/kg, and 40 mg/kg) as a bolus through the tail vein and 24 h urine was collected. A total volume of 100 μl was injected into the animals. For 3 × 40 mg/kg injection experiments animals were kept in the cages until the termination of the experiment and were injected twice more with 40 mg/kg NP at 48 h intervals after the initial injection.
Kidney preparation
At the termination of the experiments, animals were anesthetized using Napentobarbital (100 mg/kg BW, intraperitoneal) and the animal was flushed with PBS (pH 7.4) through the left ventricle for 2 min to remove blood, and then fixed by using PLP solution (paraformaldehyde-lysine-periodate: 4% paraformaldehyde, 75 mM lysine-HCl, 10 mM sodium periodate, and 0.15 M sucrose in 37.5 mM sodium phosphate) for 5 min. The kidneys were extracted and further immersion fixed at 4°C overnight. Fixed tissues were washed extensively in PBS and cryoprotected using 30 % sucrose in PBS for 2 days at 4°C. 2~3 mm kidney sections were immersed in optimal cutting temperature compound (O.C.T, Tissue-Tek, Torrance, CA), rapidly frozen, sectioned at 5 μm using Leica CM3050 S cryostat (Leica Microsystems, Buffalo Grove, IL), placed on slides, and stored at 4°C.
Urine measurements
Urinary protein was measured by using a Coomassie (Bradford) Protein Assay Kit (Thermo scientific). Enzyme-Linked Immunosorbent assays were used to measure albumin (AssayPro, St. Charles, MO) and cystatin-C (Abcam, Cambridge, MA). 24 h urine samples were thawed from −80°C and centrifuged for 10 min at 10,000 rpm to remove debris and the respective manufacturer's protocols were followed for the assay. A DsTX-880 multimode detector (Beckman Coulter) was used to read the 96 well plates.
Dextran and albumin endocytosis experiments
Animals were injected with NPs using the 3 × 40 mg/kg protocol and 24 h after the final treatment, they were injected with 10 kD dextran (60 mg/kg BW), neutral particles conjugated to rhodamine (Life technologies, Carlesbad, CA). 15 min after the injection, kidneys were fixed and prepared according to the method above. The images are pseudocolored in green to avoid overlap with red fluorescent NPs. For albumin endocytosis experiments, animals were injected with respective NPs (40 mg/kg BW) and 24 h later with bovine albumin conjugated to alexa fluor 488 (Life technologies, Carlesbad, CA) at 25 mg/kg BW. 15 min later, kidney sections were prepared as above.
Immunofluorescence
Kidney cryosections were rehydrated in PBS for 15 min, treated with 1% SDS, and washed with PBS and blocked with 1% BSA for 20 min as described previously.33 Primary antibodies against megalin (rabbit-polyclonal; a generous gift from Dr. Daniel Biemesderfer, Yale University School of Medicine), clathrin (rabbit-polyclonal; Abcam), AQP1 (Mouse-monoclonal; Santa Cruz Biotechnology), Cystatin C (goat-polyclonal; R&D systems), Kidney Injury Marker-1(KIM-1)(goat-polyclonal; a generous gift from Dr. Joseph Bonventre, Brigham and Women's Hospital, Boston) were diluted in DAKO antibody diluent (DAKO, Carpinteria, CA) and applied to the tissue for 90 min at RT. Following incubation, tissues were washed with PBS and respective secondary antibodies raised in donkey, conjugated with alexa fluor 488 (Jackson Immuno Research Laboratories, West Grove, PA) and diluted in DAKO were applied for 45 min at RT. Slides were coverslipped using Vectashield (Vector labs, Burlingame, CA) and analyzed using a Nikon A1R confocal microscope.
For quantification, tissues were imaged using a 60x objective, with an averaging of four frames. 5 – 8 images from a single tissue section from different regions were collected in a blinded fashion. For the quantification of the data, autofluorescence from the near red channel was utilized to visualize the entire proximal tubule. Using ImageJ software (National Institutes of Health, Bethesda, MD), images were thresholded appropriately to select the entire proximal tubule including the brush border membrane as a region of interest (ROI). This ROI was used to calculate the average pixel intensity in the green channel of respective green fluorescing proteins. Volocity software (PerkinElmer, Boston, MA) was used to prepare the images for publication.
Immunogold labeling
The PLP fixed kidney cortex was cut into small blocks. Tissue blocks were dehydrated through a graded series of ethanol (30% to 100%), then infiltrated with LR White (Electron Microscopy Sciences, Hatfield, PA) for 1 – 2 h at RT on a rotator and embedded overnight at 50°C in gelatin capsules. Ultrathin sections were cut on a Leica EM UC7 ultramicrotome (Leica Microsystems, Buffalo Grove, IL), collected onto transmission electron microscope (TEM) grids, and incubated for 1 h at RT in primary anti mouse-albumin antibody (goat-polyclonal; Bethyl Laboratories Inc., Montgomery, TX). After washing with PBS, the grids were incubated on drops of rabbit-anti-goat 15 nm gold conjugate (Ted Pella, Inc, Redding, CA) for 1 h. The grids were then rinsed on drops of distilled water and contrast-stained on drops of 2.0% aqueous uranyl acetate. Grids were examined at 80 kV in a JEOL JEM 1011 TEM equipped with an AMT (Advanced Microscopy Techniques, Danvers, MA) digital camera.
Statistical analysis
GraphPad Prism software (GraphPad Software, Inc., La Jolla, CA) was used for the statistical analysis and graph preparation. Data were statically analyzed using one way ANOVA (parametric). Multiple comparison tests were corrected using Dunnet's method. p values <0.05 are taken as significant. * p<0.05, ** p<0.01, ***p<0.001. Data are represented as mean ± SEM.
Supplementary Material
Acknowledgement
The authors thank D.E. Capen and P. Kelly for electron microscopy. This work was supported in part by National Heart, Lung, and Blood Institute contract HHSN268201000044C to R.Weissleder and by DK96586 to D. Brown. Additional support for the Program in Membrane Biology Microscopy Core comes from the Boston Area Diabetes and Endocrinology Research Center (DK57521) and the MGH Center for the Study of Inflammatory Bowel Disease (DK43351)
Footnotes
Author Contributions The manuscript was written through contributions of all authors. All authors have given approval to the final version of the manuscript.
Conflict of Interest The authors declare no competing financial interest
Supporting Information Available Four supplementary figures are available. Reporter tagging does not affect the macroscopic renal distribution of NP. NPs are stable in the serum. Reporter label is intact after urinary excretion. Different organic fluorophore tagging does not affect the cellular localization of NP. This material is available free of charge via the Internet at http://pubs.acs.org.
REFERENCES AND NOTES
- 1.Weissleder R, Kelly K, Sun EY, Shtatland T, Josephson L. Cell-Specific Targeting of Nanoparticles By Multivalent Attachment of Small Molecules. Nat Biotechnol. 2005;23:1418–1423. doi: 10.1038/nbt1159. [DOI] [PubMed] [Google Scholar]
- 2.Anderson DG, Burdick JA, Langer R. Materials Science. Smart Biomaterials. Science. 2004;305:1923–1924. doi: 10.1126/science.1099987. [DOI] [PubMed] [Google Scholar]
- 3.Wong IY, Bhatia SN, Toner M. Nanotechnology: Emerging Tools for Biology and Medicine. Genes Dev. 2013;27:2397–2408. doi: 10.1101/gad.226837.113. [DOI] [PMC free article] [PubMed] [Google Scholar]
- 4.Choi HS, Liu W, Misra P, Tanaka E, Zimmer JP, Itty Ipe B, Bawendi MG, Frangioni JV. Renal Clearance of Quantum Dots. Nat Biotechnol. 2007;25:1165–1170. doi: 10.1038/nbt1340. [DOI] [PMC free article] [PubMed] [Google Scholar]
- 5.Liu W, Choi HS, Zimmer JP, Tanaka E, Frangioni JV, Bawendi M. Compact Cysteine-Coated Cdse(zncds) Quantum Dots for in Vivo Applications. J Am Chem Soc. 2007;129:14530–14531. doi: 10.1021/ja073790m. [DOI] [PMC free article] [PubMed] [Google Scholar]
- 6.Majmudar MD, Yoo J, Keliher EJ, Truelove JJ, Iwamoto Y, Sena B, Dutta P, Borodovsky A, Fitzgerald K, Di Carli MF, et al. Polymeric Nanoparticle Pet/mr Imaging Allows Macrophage Detection in Atherosclerotic Plaques. Circ Res. 2013;112:755–761. doi: 10.1161/CIRCRESAHA.111.300576. [DOI] [PMC free article] [PubMed] [Google Scholar]
- 7.Lin P, Chen J-W, Chang LW, Wu J-P, Redding L, Chang H, Yeh T-K, Yang CS, Tsai M-H, Wang H-J, et al. Computational and Ultrastructural Toxicology of a Nanoparticle, Quantum Dot 705, in Mice. Environ Sci Technol. 2008;42:6264–6270. doi: 10.1021/es800254a. [DOI] [PubMed] [Google Scholar]
- 8.Keliher EJ, Yoo J, Nahrendorf M, Lewis JS, Marinelli B, Newton A, Pittet MJ, Weissleder R. 89Zr-Labeled Dextran Nanoparticles Allow in Vivo Macrophage Imaging. Bioconjug Chem. 2011;22:2383–2389. doi: 10.1021/bc200405d. [DOI] [PMC free article] [PubMed] [Google Scholar]
- 9.Saptarshi SR, Duschl A, Lopata AL. Interaction of Nanoparticles With Proteins: Relation to Bio-Reactivity of the Nanoparticle. J Nanobiotechnology. 2013;11:26. doi: 10.1186/1477-3155-11-26. [DOI] [PMC free article] [PubMed] [Google Scholar]
- 10.Astashkina AI, Jones CF, Thiagarajan G, Kurtzeborn K, Ghandehari H, Brooks BD, Grainger DW. Nanoparticle Toxicity Assessment Using an in Vitro 3-D Kidney Organoid Culture Model. Biomaterials. 2014;35:6323–6331. doi: 10.1016/j.biomaterials.2014.04.060. [DOI] [PubMed] [Google Scholar]
- 11.Yamagishi Y, Watari A, Hayata Y, Li X, Kondoh M, Yoshioka Y, Tsutsumi Y, Yagi K. Acute and Chronic Nephrotoxicity of Platinum Nanoparticles in Mice. Nanoscale Res Lett. 2013;8:395. doi: 10.1186/1556-276X-8-395. [DOI] [PMC free article] [PubMed] [Google Scholar]
- 12.Zhang XD, Wu D, Shen X, Liu PX, Fan FY, Fan SJ. In Vivo Renal Clearance, Biodistribution, Toxicity of Gold Nanoclusters. Biomaterials. 2012;33:4628–4638. doi: 10.1016/j.biomaterials.2012.03.020. [DOI] [PubMed] [Google Scholar]
- 13.Ye L, Yong KT, Liu L, Roy I, Hu R, Zhu J, Cai H, Law WC, Liu J, Wang K, et al. A Pilot Study in Non-Human Primates Shows No Adverse Response to Intravenous Injection of Quantum Dots. Nat Nanotechnol. 2012;7:453–458. doi: 10.1038/nnano.2012.74. [DOI] [PubMed] [Google Scholar]
- 14.Li Y, Zheng Y, Zhang K, Ying JY, Zink D. Effects of Quantum Dots on Different Renal Proximal Tubule Cell Models and on Gel-Free Renal Tubules Generated in Vitro. Nanotoxicology. 2012;6:121–133. doi: 10.3109/17435390.2011.562326. [DOI] [PubMed] [Google Scholar]
- 15.Lin C-H, Chang LW, Chang H, Yang M-H, Yang C-S, Lai W-H, Chang W-H, Lin P. The Chemical Fate of the Cd/se/te-Based Quantum Dot 705 in the Biological System: Toxicity Implications. Nanotechnology. 2009;20:215101. doi: 10.1088/0957-4484/20/21/215101. [DOI] [PubMed] [Google Scholar]
- 16.Yong K-T, Law W-C, Hu R, Ye L, Liu L, Swihart MT, Prasad PN. Nanotoxicity Assessment of Quantum Dots: From Cellular to Primate Studies. Chem Soc Rev. 2013;42:1236. doi: 10.1039/c2cs35392j. [DOI] [PubMed] [Google Scholar]
- 17.Hvidt LN, Perner A. High Dosage of Dextran 70 is Associated With Severe Bleeding in Patients Admitted to the Intensive Care Unit for Septic Shock. Dan Med J. 2012;59:A4531. [PubMed] [Google Scholar]
- 18.Jain K, Kesharwani P, Gupta NK. Dendrimer Toxicity: Let's Meet the Challenge. Int J Pharm. 2010;394:122–142. doi: 10.1016/j.ijpharm.2010.04.027. [DOI] [PubMed] [Google Scholar]
- 19.Mishra V, Gupta U, Jain NK. Surface-Engineered Dendrimers: A Solution for Toxicity Issues. J Biomater Sci Polym Ed. 2009;20:141–166. doi: 10.1163/156856208X386246. [DOI] [PubMed] [Google Scholar]
- 20.Tsai HC, Imae T. Fabrication of Dendrimers Toward Biological Application. Prog Mol Biol Transl Sci. 2011;104:101–140. doi: 10.1016/B978-0-12-416020-0.00003-6. [DOI] [PubMed] [Google Scholar]
- 21.Lombardo D. Modeling Dendrimers Charge Interaction in Solution: Relevance in Biosystems. Biochem Res Int. 2014;2014:837651. doi: 10.1155/2014/837651. [DOI] [PMC free article] [PubMed] [Google Scholar]
- 22.Lencer WI, Weyer P, Verkman AS, Ausiello DA, Brown D. Fitc-Dextran as a Probe for Endosome Function and Localization in Kidney. Am J Physiol. 1990;258:C309–C317. doi: 10.1152/ajpcell.1990.258.2.C309. [DOI] [PubMed] [Google Scholar]
- 23.Eppel GA, Osicka TM, Pratt LM, Jablonski P, Howden B, Glasgow EF, Comper WD. The Return of Glomerular Filtered Albumin to the Rat Renal Vein – the Albumin Retrieval Pathway. Ren Fail. 2001;23:347–363. doi: 10.1081/jdi-100104719. [DOI] [PubMed] [Google Scholar]
- 24.Russo LM, Sandoval RM, McKee M, Osicka TM, Collins AB, Brown D, Molitoris BA, Comper WD. The Normal Kidney Filters Nephrotic Levels of Albumin Retrieved By Proximal Tubule Cells: Retrieval is Disrupted in Nephrotic States. Kidney Int. 2007;71:504–513. doi: 10.1038/sj.ki.5002041. [DOI] [PubMed] [Google Scholar]
- 25.Lu M, Cohen MH, Rieves D, Pazdur R. Fda Report: Ferumoxytol for Intravenous Iron Therapy in Adult Patients With Chronic Kidney Disease. Am J Hematol. 2010;85:315–319. doi: 10.1002/ajh.21656. [DOI] [PubMed] [Google Scholar]
- 26.Harisinghani M, Ross RW, Guimaraes AR, Weissleder R. Utility of a New Bolus-Injectable Nanoparticle for Clinical Cancer Staging. Neoplasia. 2007;9:1160–1165. doi: 10.1593/neo.07940. [DOI] [PMC free article] [PubMed] [Google Scholar]
- 27.Christensen EI, Birn H. Megalin and Cubilin: Synergistic Endocytic Receptors in Renal Proximal Tubule. Am J Physiol Renal Physiol. 2001;280:F562–F573. doi: 10.1152/ajprenal.2001.280.4.F562. [DOI] [PubMed] [Google Scholar]
- 28.Mahadevappa R, Nielsen R, Christensen EI, Birn H. Megalin in Acute Kidney Injury: Foe and Friend. Am J Physiol Renal Physiol. 2014;306:F147–F154. doi: 10.1152/ajprenal.00378.2013. [DOI] [PubMed] [Google Scholar]
- 29.Tojo A, Onozato M, Ha H, Kurihara H, Sakai T, Goto A, Fujita T, Endou H. Reduced Albumin Reabsorption in the Proximal Tubule of Early-Stage Diabetic Rats. Histochem Cell Biol. 2001;116:269–276. doi: 10.1007/s004180100317. [DOI] [PubMed] [Google Scholar]
- 30.Birn H, Christensen EI. Renal Albumin Absorption in Physiology and Pathology. Kidney Int. 2006;69:440–449. doi: 10.1038/sj.ki.5000141. [DOI] [PubMed] [Google Scholar]
- 31.DuBois M, Gilles KA, Hamilton JK, Rebers PA, Smith F. Colorimetric Method for Determination of Sugars and Related Substances. Anal Chem. 1956;28:350–356. [Google Scholar]
- 32.Snyder SL, Sobocinski PZ. An Improved 2,4,6-Trinitrobenzenesulfonic Acid Method for the Determination of Amines. Anal Biochem. 1975;64:284–288. doi: 10.1016/0003-2697(75)90431-5. [DOI] [PubMed] [Google Scholar]
- 33.Brown D, Lydon J, McLaughlin M, Stuart-Tilley A, Tyszkowski R, Alper S. Antigen Retrieval in Cryostat Tissue Sections and Cultured Cells By Treatment With Sodium Dodecyl Sulfate (Sds) Histochem Cell Biol. 1996;105:261–267. doi: 10.1007/BF01463929. [DOI] [PubMed] [Google Scholar]
Associated Data
This section collects any data citations, data availability statements, or supplementary materials included in this article.