

Abstract
Thyroid cancer incidence has been increasing over time, and it is estimated that ∼1950 advanced thyroid cancer patients will die of their disease in 2015. To combat this disease, an enhanced understanding of thyroid cancer development and progression as well as the development of efficacious, targeted therapies are needed. In vitro and in vivo studies utilizing thyroid cancer cell lines and animal models are critically important to these research efforts. In this report, we detail our studies with a panel of authenticated human anaplastic and papillary thyroid cancer (ATC and PTC) cell lines engineered to express firefly luciferase in two in vivo murine cancer models—an orthotopic thyroid cancer model as well as an intracardiac injection metastasis model. In these models, primary tumor growth in the orthotopic model and the establishment and growth of metastases in the intracardiac injection model are followed in vivo using an IVIS imaging system. In the orthotopic model, the ATC cell lines 8505C and T238 and the PTC cell lines K1/GLAG-66 and BCPAP had take rates >90 % with final tumor volumes ranging 84–214 mm3 over 4–5 weeks. In the intracardiac model, metastasis establishment was successful in the ATC cell lines HTh74, HTh7, 8505C, THJ-16T, and Cal62 with take rates ≥70 %. Only one of the PTC cell lines tested (BCPAP) was successful in the intracardiac model with a take rate of 30 %. These data will be beneficial to inform the choice of cell line and model system for the design of future thyroid cancer studies.
Electronic supplementary material
The online version of this article (doi:10.1007/s12672-015-0219-0) contains supplementary material, which is available to authorized users.
Keywords: Thyroid Cancer, Papillary Thyroid Cancer, Thyroid Cancer Cell, Anaplastic Thyroid Cancer, TERT Promoter Mutation
Introduction
Thyroid cancer is the most common endocrine malignancy, and global incidence has been increasing over time. In 2015, it is estimated that >62,000 new cases of thyroid cancer will be diagnosed in the USA, and ∼1950 thyroid cancer patients will likely succumb to their disease [41]. Over 90 % of thyroid cancers are differentiated tumors derived from thyroid follicular cells, most of which are papillary thyroid cancers (PTC). The majority of these cancers respond well to conventional therapy, which includes surgery and suppressive therapy with levothyroxine with or without radioactive iodine therapy with I-131. However, a subset of metastatic PTC, as well as poorly differentiated thyroid cancers and anaplastic thyroid cancers (ATC), is refractory to standard treatments. ATC comprises <3 % of all thyroid cancers and is an undifferentiated, aggressive form of thyroid cancer with a median survival of only 3–5 months [11, 42]. At the present time, there are limited treatment options for thyroid cancer patients with advanced disease. Sorafenib, a multikinase inhibitor, is the only Food and Drug Administration-approved targeted therapy for metastatic PTC and offers modest benefit [6].
Thyroid cancer cell lines and in vivo animal models are critical not only to study mechanisms underlying thyroid cancer development and progression, but also for the development and testing of targeted therapies to treat patients with advanced thyroid cancer. Historically, thyroid cancer research has been hindered by problems with cell line contamination and misidentification. Many early thyroid cancer studies were performed in cell lines that were later determined by short tandem repeat (STR) profiling to be redundant or not even of thyroid origin [40]. With the persistent efforts of investigators in the thyroid cancer field, multiple human thyroid cancer cell lines derived from primary and metastatic PTC, follicular thyroid carcinoma (FTC), and ATC have been generated, and common mutations in genes encoding signaling proteins such as BRAF, RAS, and PI3K, which are frequently identified in thyroid cancer, are represented among these cell lines. Many of these mutations result in activation of the mitogen activated protein kinase (MAPK) and phosphoinositide 3-kinase (PI3K)-Akt pathways, which figure prominently in thyroid cancer development and progression as eloquently reviewed by M. Xing and colleagues [45].
In addition to in vitro studies utilizing human thyroid cancer cell lines, xenograft studies from transplantation of these human thyroid cancer cell lines in murine models, as well as genetically engineered mouse models, have provided invaluable insights into thyroid cancer development and progression and serve as critical models for drug development and preclinical testing. More recently, the first patient-derived xenograft (PDX) model for thyroid cancer was reported and will provide another important approach to study thyroid tumor biology [10]. Mouse models have several key features that are not adequately replicated with in vitro studies. As articulately reviewed by Antonello and Nucera, orthotopic mouse models of thyroid cancer allow for insights into the interaction between the tumor and the tumor microenvironment and recapitulation of human disease with regard to local invasion and metastasis [1, 3, 23, 33]. Myers and colleagues were the first to develop the orthotopic model in which thyroid cancer cells are injected into the thyroid gland and followed over time for tumor development, progression, and metastasis [23]. The injected cells may also be genetically manipulated to investigate key questions regarding the molecular mechanisms at play in these processes, and testing of therapies and drug combinations can be performed using this model. In immunocompetent genetically engineered thyroid cancer mouse models, the interplay between the immune system and tumor can also be explored. More recently, a focus has shifted to include studies of metastasis in thyroid cancer. In 2012, we reported the development of a metastasis model utilizing intracardiac injection of human thyroid cancer cells and successfully exploited this model to investigate the in vivo effects of treatment of a Src family kinase inhibitor on thyroid cancer metastasis [8]. Zhang and colleagues have reported use of a tail vein injection model using human thyroid cancer cell lines to generate metastases, particularly to the lung, for purposes of preclinical testing and functional studies [46].
In this current report, we detail our analyses of a panel of thyroid cancer cell lines in both the orthotopic thyroid cancer mouse model and the intracardiac injection metastasis model. These data provide important information for the design of animal experiments to investigate key issues in thyroid cancer development, progression, and metastasis and to facilitate preclinical testing and translational studies in reliable and reproducible in vivo models.
Materials and Methods
Cell Lines
Except as noted, cells were propagated in RPMI 1640 media supplemented with 5 % FBS at 37 °C in 5 % CO2. 8505C, Cal62, and BCPAP cells were kindly provided by M. Santoro (Medical School, University of Naples Federico II, Naples, Italy). SW1736, C643, HTh7, and HTh74 cells were obtained from K. Ain (University of Kentucky, Lexington, KY) with permission from N. E. Heldin (University Hospital, Uppsala, Sweden). TPC-1 cells were generously provided by S. Jhiang (The Ohio State University, Columbus, OH), MDA-T41 cells were obtained from G. Clayman (University of Texas MD Anderson Cancer Center, Houston, TX), T238 cells were obtained from L. Roque (Instituto Português de Oncologia, Lisboa, Portugal), and K1/GLAG-66 cells were provided by D. Wynford-Thomas (Cardiff University, Cardiff, UK), which have recently been shown to be derived from the GLAG-66 PTC cell line [37]. THJ-16T cells were obtained from J. A. Copland (Mayo Clinic Comprehensive Cancer Center, Jacksonville, FL) and were maintained in RPMI 1640 (Gibco by Life Technologies, Grand Island, NY) supplemented with 10 % fetal bovine serum (FBS), non-essential amino acids, 1 mM sodium pyruvate, 1 nM T3, 0.5 μg/mL hydrocortisone, 8 ng/mL epidermal growth factor, 25 mM HEPES, and 0.1 mg/mL Primocin. Cell lines were authenticated by STR profiling using the Applied Biosystems Identifiler kit (#4322288) in the Barbara Davis Center BioResources Core Facility, Molecular Biology Unit, at the University of Colorado, or as previously described in the University of Colorado Cancer Center (UCCC) Sequencing and Analysis Core [40]. Prior to use in experiments, testing for Mycoplasma contamination was performed using the Lonza Mycoalert system (Lonza Walkersville, Inc., Walkersville, MD) according to the manufacturer’s directions.
Prior to use in the orthotopic and intracardiac metastasis model experiments, the thyroid cancer cell lines were stably transfected with the plasmid pEGFP-Luc-N1 (Clontech, Mountain View, CA), a kind gift from C. Li (Duke University Medical Center, Durham, NC), engineered for simultaneous expression of both luciferase and enhanced green fluorescent protein through an IRES-containing bicistronic vector. Using concentrations obtained from kill curves for each cell line, the transfectants were selected and propagated in the presence of G418, and further selected to obtain >90 % purity by fluorescence-activated cell sorting at the UCCC Flow Cytometry Core Facility, as previously described [4]. Clonal selection was not performed; therefore, the cell lines utilized in these studies were heterogeneous, polyclonal populations.
Orthotopic Thyroid Cancer Mouse Model
Mycoplasma-free thyroid cancer cells were harvested and counted using the Vi-Cell automated cell counting system (Beckman-Coulter, Inc., Indianapolis, IN), resuspended in phosphate-buffered saline (PBS), and placed on ice. Athymic nude mice (aged ∼8–12 weeks) acquired from National Cancer Institute or Harlan Laboratories were anesthetized with 2, 2, 2- tribromoethanol (Sigma-Aldrich, St. Louis, MO) 250 mg/kg by IP injection. After cleansing of the anterior neck with betadine and isopropyl alcohol, trachea and thyroid were exposed by dissection through the skin and separation of the overlying submandibular glands. With the visualization aid of a dissecting microscope, 500,000 cells suspended in 5 μL of PBS were injected into the right thyroid lobe using a Hamilton syringe (Hamilton Company, Reno, NV), as previously described [1, 8, 23, 29, 33, 44]. The retracted submandibular glands were returned to their normal positions, and the neck incisions were reapproximated and secured with staples to facilitate healing by primary intention. Mice were monitored until recovery from anesthesia was achieved, and post-procedural analgesia with 2 mg/mL acetaminophen in the drinking water was provided. Staples were removed 7–14 days after surgery. This procedure was performed under a protocol approved by the University of Colorado Institutional Animal Care and Use Committee. One experiment per cell line was performed with the exception of BCPAP (3 experiments) and K1/GLAG-66 (2 experiments). Total mouse numbers from the sum of these experiments are listed in Table 1. The duration of experiments was variable due to planned experimental endpoints, lack of tumor establishment, or animal illness. Experiment duration in days is listed in Table 1. In 2 of 2 K1/GLAG-66, 1of 1 8505C, and 1 of 3 BCPAP experiments, the mice included in this data set were vehicle controls for drug treatment studies. For these studies, mice were gavaged five days per week starting on day 10 after injection with either 5 % Gelucire 44/14 in saline (8505C and BCPAP) or 0.5 % hydroxypropyl methylcellulose with 0.1 % polysorbate (K1/GLAG-66). Experimental animals treated with active drug have been excluded from this report. Tumor establishment and monitoring was analyzed using the Xenogen IVIS 200 imaging system in the UCCC Small Animal Imaging Core (see below). At time of sacrifice, thyroid tumor and lungs were collected, fixed in 10 % formalin, and paraffin-embedded. Hematoxylin and eosin (H&E) staining of tumor sections was performed using a standard protocol [7], and images were interpreted by a pathologist. Thyroid tumors were measured with calipers and volume was calculated using the formula (length × width × height) × π/6.
Table 1.
Orthotopic take rates of thyroid cancer cell lines
| Tumor | Cell line | Mutation(s) | Take rate | # Mice | Tumor vol mm3 | Duration |
|---|---|---|---|---|---|---|
| ATC | 8505C | BRAF(V600E) | 100 % | 12 | 84 ± 22 | 30 days |
| ATC | T238 | BRAF(V600E), PIK3CA(E542K) | 100 % | 8 | 212 ± 40 | 28 days |
| ATC | HTh74 | None knowna | 86 % | 7 | 59.5 ± 27 | 95 days |
| ATC | THJ-16T | PIK3CA(E545K) | 75 % | 8 | 2.5 ± 3 | 72 days |
| ATC | Cal62 | KRAS(G12R) | 63 % | 8 | 26.7 ± 11 | 49 days |
| ATC | C643 | HRAS(G13R) | 0 % | 8 | N/A | 42 days |
| ATC | SW1736 | BRAF(V600E) | 0 % | 8 | N/A | 56 days |
| PTC | K1/GLAG-66 | BRAF(V600E), PIK3CA(E542K) | 100 % | 11 | 181 ± 163 | 30-38 days |
| PTC | BCPAP | BRAF(V600E) | 92 % | 26 | 214 ± 104 | 29-38 days |
| PTC | MDA-T41 | BRAF(V600E) | 0 % | 8 | N/A | 43 days |
| PTC | TPC-1 | RET/PTC1 | 0 % | 4 | N/A | 28 days |
aNo known mutations in BRAF, NRAS, HRAS, KRAS, PIK3CA, PTEN, AKT1, and AKT2
IVIS Imaging and Ex Vivo Imaging
Mice were injected with 3 mg D-luciferin in 200 μL and then anesthetized with isoflurane. For orthotopic experiments, mice were imaged ventrally with the Xenogen IVIS 200 imaging system, and for intracardiac injection experiments, both dorsal and ventral images were obtained. Bioluminescence activity in photons/second was measured using the Living Image software (PerkinElmer, Inc., Waltham, MA). For the intracardiac metastasis model experiments, the sum of ventral and dorsal measurements was used for analysis, as previously described [8]. For ex vivo imaging, mice were injected with D-luciferin as above, euthanized by isoflurane inhalation and cervical dislocation, and dissected. Tissues were rinsed with saline, placed in a 6-well cell culture plate with 300 μg/mL luciferin in PBS, and imaged using the IVIS imaging system, as described [20].
Intracardiac Injection Metastasis Model
Cells confirmed to be free of Mycoplasma contamination were collected as above and resuspended in PBS. Intracardiac injections were carried out according to Kang and colleagues [22]. Athymic nude mice aged 4–6 weeks were injected with D-luciferin as above and then anesthetized with isoflurane. With continuous administration of isoflurane via nose cone to maintain anesthesia, the mice were secured, the anterior chest area was cleansed with ethanol, and 100,000 cells in 100 μL PBS were slowly injected into the left ventricle using a 26-gauge needle. An air bubble at the hub of the needle allowed for the backflow of blood upon entry into the left ventricle, and pulsatile flow of oxygenated blood was noted when the needle is correctly placed into the left ventricle. Immediately following the injection, the mice were imaged by IVIS to confirm successful injection. Distribution of signal throughout the body was an indicator of “successful” injection directly into the left ventricle, whereas signal concentration in the chest implied lung or right ventricle injection which was designated as an “unsuccessful” injection, and these mice were excluded from the analysis. IVIS imaging was performed weekly to monitor for metastatic tumor establishment and growth, and the sum of ventral and dorsal measurements for each mouse at each timepoint was used for the analysis. All animal procedures were performed under protocols approved by the University of Colorado Institutional Animal Care and Use Committee. One experiment per cell line was performed with the exception of 8505C (two experiments). Total mouse numbers from these experiments are listed in Table 2. At the time of sacrifice, tissues were harvested, fixed in 10 % formalin, paraffin-embedded, stained with H&E according to a standard protocol [7], and interpreted by a pathologist (S.B.S.). Processed bone was decalcified through 24 hour incubation in Decal after fixation in 10 % formalin (American MasterTech, Lodi, CA).
Table 2.
Thyroid cancer cell line take rates in the intracardiac injection metastasis model
| Tumor | Cell line | Mutation(s) | Take rate | # Mice | Duration |
|---|---|---|---|---|---|
| ATC | HTh74 | None knowna | 100 % | 8 | 82 days |
| ATC | HTh7 | NRAS(Q61R) | 100 % | 4 | 28 days |
| ATC | 8505C | BRAF(V600E) | 90 % | 20 | 35–42 days |
| ATC | THJ-16T | PIK3CA(E545K) | 83 % | 12 | 63 days |
| ATC | Cal62 | KRAS(G12R) | 70 % | 10 | 35 days |
| ATC | C643 | HRAS(G13R) | 14 % | 7 | 48 days |
| ATC | SW1736 | BRAF(V600E) | 0 % | 9 | 34 days |
| PTC | BCPAP | BRAF(V600E) | 30 % | 10 | 49 days |
| PTC | TPC-1 | RET/PTC1 | 0 % | 6 | 48 days |
| PTC | K1/GLAG-66 | BRAF(V600E), PIK3CA(E542K) | 0 % | 5 | 42 days |
aNo known mutations in BRAF, NRAS, HRAS, KRAS, PIK3CA, PTEN, AKT1, and AKT2
Statistics
Mean and standard deviations were calculated using Microsoft Excel, and graphs were prepared using GraphPad Prism software.
Results
Orthotopic Model Results
Using a well-established orthotopic thyroid cancer model [1, 4, 8, 23, 29, 33, 44], a panel of authenticated anaplastic and papillary thyroid cancer cell lines was assessed for the ability to establish tumors in athymic nude mice, as well as to characterize the growth properties of the resultant tumors. In these studies, 500,000 thyroid cancer cells stably expressing firefly luciferase were injected into the right lobe of athymic nude, and weekly monitoring with an IVIS imaging system allowed for detection of tumor establishment as well as growth surveillance, as described in the “Materials and Methods” section. Tumor take rates are reported in Table 1 and bioluminescence growth curves are depicted in Fig. 1 for the cell lines that established tumors in the orthotopic tumor model. The duration of experiments varied among cell lines due to animal illness resulting from tumor growth and/or metastasis, lack of tumor establishment or growth over adequate time period, or protracted period of slow growth or low tumor burden. Due to inherent differences in transfection efficiency, there was variability in bioluminescence signal strength among the cell lines. Therefore, data are shown as fold increase from week 1 for each cell line (Fig. 1).
Fig. 1.
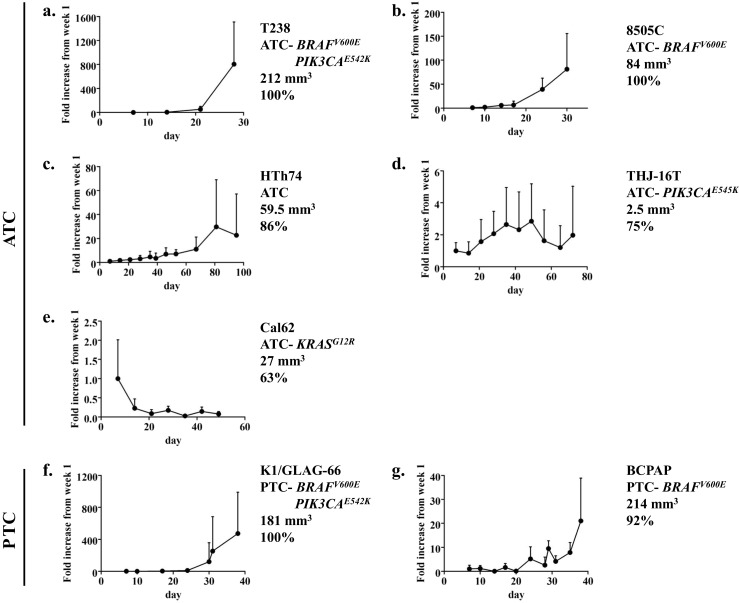
Time course of in vivo bioluminescence for the T238 (a), 8505C (b), HTh74 (c), THJ-16T (d), Cal62 (e), K1/GLAG-66 (f), and BCPAP (g) orthotopic experiments is shown. Data are expressed as mean + SD normalized to the signal at week 1
Two ATC cell lines (8505C and T238) and one PTC cell lines (K1/GLAG-66) had a take rate of 100 % in the orthotopic model (Table 1). The 8505C, T238, K1/GLAG-66, and BCPAP cells also reliably gave rise to substantial tumors (84–214 mm3) and typically required sacrifice within 4–5 weeks of injection due to tumor burden. Specifically, T238 cells gave rise to large tumors (212 mm3) in a short time period of only 4 weeks (Table 1). Upon review of the T238 bioluminescence growth curve in Fig. 1a, much of the tumor growth occurred in rapid fashion after the 3-week time point (from 4-fold increase at week 2 to 53-fold increase at week 3 and then to 804-fold increase at week 4). Similar increases in growth rate at the ∼3-week time point also occurred with 8505C, K1/GLAG-66, and BCPAP (fold changes at weeks 2, 3, and 4 for 8505C are 6X, 39X, and 81X, for K1/GLAG-66 are 4X, 11X, 120X, and 472X at 5 weeks, and for BCPAP are up to 1.6X in the first 3 weeks, then 5X at 3 weeks, 10X at 4 weeks, and 21X at nearly 6 weeks; Fig. 1b, f, g).
HTh74, THJ-16T, and Cal62 ATC cell lines had high take rates (63-86 %); however, the final tumor volumes were small (2.5–60 mm3), and the experiment duration was quite protracted due to slow growth rates (49–95 days; Table 1; Fig. 1c, d, e). Specifically, the HTh74 cell line gave rise to 60 mm3 tumors at 95 days, and THJ-16T tumors were barely measurable (2.5 mm3) at 72 days (Table 1). Tumors arising from injection of Cal62 cells exhibited decreasing bioluminescence signal over time (Fig. 1e), and resultant tumor volumes at 7 weeks were low (average 26.7 mm3). The ATC cell lines C643 and SW1736 and PTC cell lines MDA-T41 and TPC-1 were unable to establish tumors in our experiments using the orthotopic model (Table 1). Consistent with the frequent aberrant activation of the MAPK and PI3K pathways in thyroid cancer, the four cell lines which had the highest take rates in the orthotopic model (8505C, T238, K1/GLAG-66, and BCPAP) all express mutant BRAF (BRAF V600E), an activator of the MAPK pathway, and two of these cell lines (T238 and K1/GLAG-66) also express mutant PI3K (PIK3CA E542K).
Representative weekly IVIS images of the T238 and 8505C studies are shown in Figs. 2a and 3a, and H&E-stained primary tumor sections are shown in Figs. 2c and 3c. Metastases were not apparent on weekly IVIS imaging, however, at necropsy and dissection, ex vivo imaging revealed metastasis to the lungs (Figs. 2b and 3b), and this finding was confirmed histologically with visualization of pulmonary micrometastases on H&E-stained sections (Figs. 2c and 3d). Interestingly, spread to lymph nodes was not clearly observed by imaging or at dissection in these studies. There are several possible explanations for why lung metastases were not apparent on the weekly in vivo IVIS imaging. The pulmonary metastasis signal may have been masked by a strong signal from the primary thyroid tumor and this technique may lack the sensitivity required to detect the low signal emitted by pulmonary micrometastases in vivo. In our studies, BCPAP also exhibits a predilection for lung metastasis as observed through histopathologic lung examination post mortem (Supplemental Fig. 1), however, in vivo and ex vivo lung assessments for bioluminescence were negative (data not shown). A formal analysis of lung metastasis has not been performed in all cell lines, and it is possible that micrometastases may have been missed in some analyses due to incomplete sectioning of the harvested tissues. In addition to a lack of sensitivity to detect lung metastases in vivo with weekly IVIS imaging, some variability and inconsistency with the orthotopic tumor bioluminescent signal was also observed at times. Not uncommonly, a mouse with a positive bioluminescent signal one week would appear to “lose” the signal the next week, only to regain signal the subsequent week, and this phenomenon was observed with mouse number 1 in Fig. 2a. Nonetheless, the ability to perform noninvasive imaging on a weekly basis represents a powerful approach to monitor tumor growth and responses in real time.
Fig. 2.
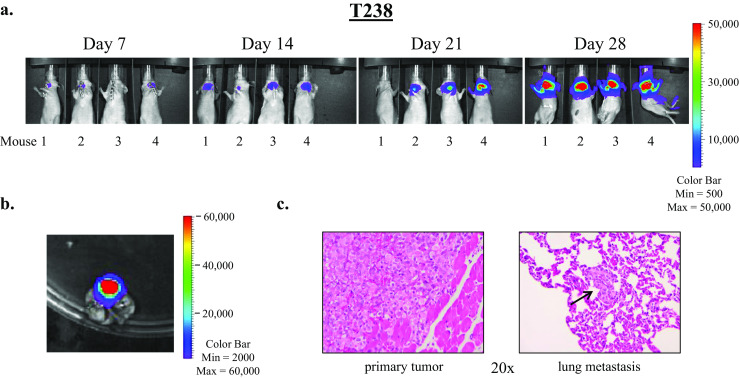
T238 ATC cells readily establish thyroid tumors and lung metastases in the orthotopic thyroid cancer mouse model. Five hundred thousand cells in 5 μL PBS were injected into the right thyroid lobes of athymic nude mice. Mice were imaged weekly using the Xenogen IVIS 200 imaging system as described in the “Materials and Methods” section. Representative images of four mice are shown in (a). At necropsy, lungs were harvested and subjected to ex vivo imaging (b). Histologic examination of H&E-stained sections of harvested tissues reveals the primary tumor and a lung micrometastasis (indicated by an arrow), shown at ×20 magnification (c)
Fig. 3.
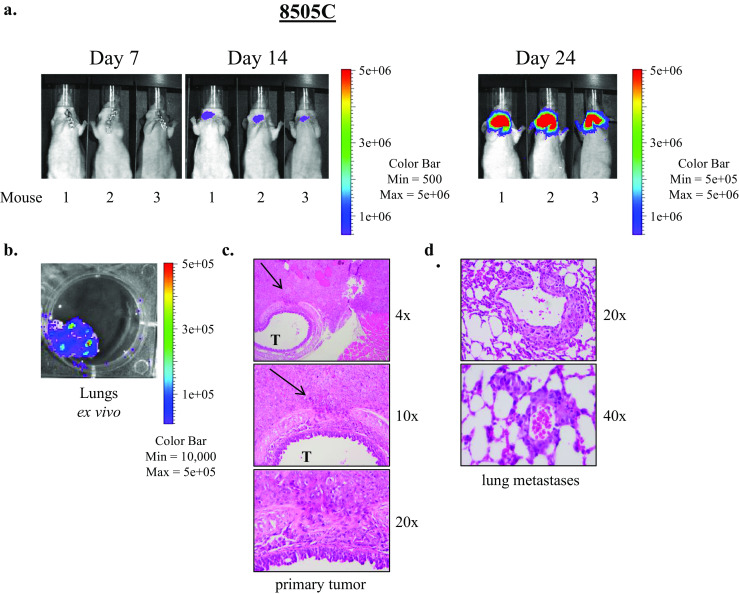
8505C ATC cells form thyroid tumors and lung metastases in the orthotopic model. Representative images of primary tumors resulting from injection of 8505C cells in the orthotopic model as visualized by IVIS imaging are shown (a). Ex vivo IVIS imaging of lung tissues revealed pulmonary metastases (b) which were confirmed by histologic examination (d). Images of an H&E-stained primary tumor at varying degrees of magnification show tumor invasion into the trachea (T), as indicated by arrows (c)
Intracardiac Model Results
The panel of thyroid cancer cell lines was also assessed in an intracardiac injection metastasis model. In this model, 100,000 thyroid cancer cells stably expressing firefly luciferase were injected into the left ventricle of athymic nude mice, as described in the “Materials and Methods” section. Immediately after injection, IVIS imaging was performed to attest to the accuracy of injection, and weekly IVIS imaging was performed to monitor for metastasis establishment and growth. The outcomes of the intracardiac injection experiments are shown in Table 2, and bioluminescence trends are depicted in Fig. 4 for cell lines that had metastasis establishment. Five of the seven ATC cell lines assessed had take rates ≥70 % (HTh74, HTh7, 8505C, THJ-16T, and Cal 62), whereas none of three PTC cell lines had metastasis establishment in over half of the mice. Specifically, the ATC cell lines HTh74 and HTh7 had take rates of 100 %. For the HTh7, 8505C, THJ16T, and Cal62 cell lines, the slope of bioluminescence became sharper at the 3–4 week time points implying faster growth; whereas for the HTh74 and BCPAP cell lines, the increase in bioluminescence signal was more gradual until later time points (∼60 days for HTh74 and ∼40 days for BCPAP) (Fig. 4).
Fig. 4.
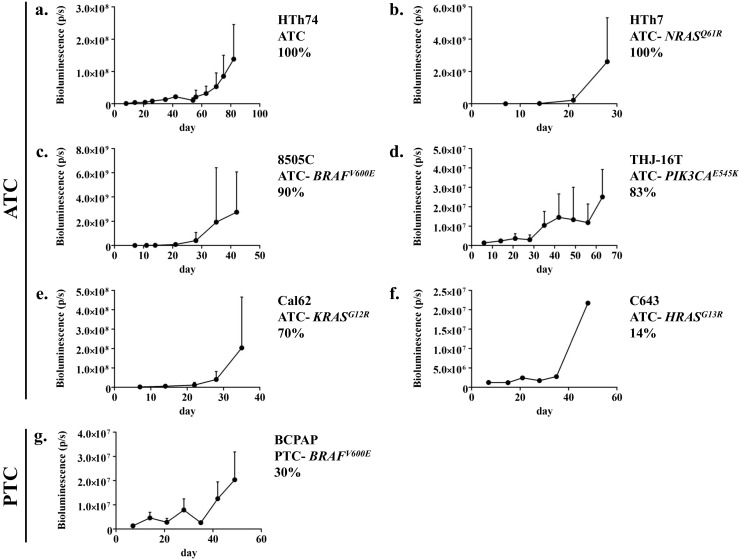
Time course of in vivo bioluminescence measures for the HTh74 (a), HTh7 (b), 8505C (c), THJ-16T (d), Cal62 (e), C643 (f), and BCPAP (g) intracardiac injection experiments is shown. Data are expressed as mean + SD. As only one mouse in the C643 group developed metastases in the intracardiac model, no SD error bar is shown (f)
In the intracardiac injection experiments, metastases to lung, bone, brain, and soft tissue were observed. Figure 5a shows bioluminescence imaging of a representative mouse injected with the 8505C cell line. At day 0, bioluminescence signal was observed throughout the body, indicating proper injection location into the left ventricle (Fig. 5a, left). By the end of the experiment, multiple established metastases were apparent throughout the body (Fig. 5a, right), and ex vivo imaging and subsequent histopathologic examination revealed metastases in the lung and spine (Fig. 5b–d). Figure 6a shows establishment and growth of multiple metastases in two representative mice injected with HTh7 cells. Ex vivo imaging and histolopathologic examination revealed bony metastases to the spine and leg bone (Fig. 6b, c) and lung (Fig. 6d, e). Dissection of the leg muscles away from the leg bones confirmed location of the metastases to the bone by ex vivo and histopathologic analysis. Though a strong bioluminescent signal was noted over the head/brain of the mouse 9 by day 28 (Fig. 6a), ex vivo imaging of its brain tissue was equivocal (data not shown).
Fig. 5.
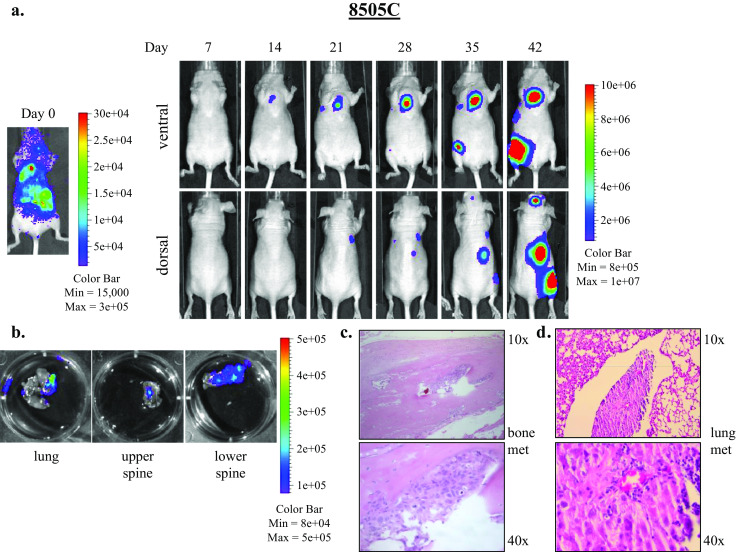
8505C cell injected into the left ventricle result in bone and lung metastases in the intracardiac metastasis model. One hundred thousand 8505C cells expressing luciferase-IRES-GFP suspended in 100 μL PBS were injected into the left ventricle and systemic distribution of luciferase activity was confirmed by IVIS injection immediately after injection (day 0). Dorsal and ventral IVIS images were obtained weekly, and images from a representative mouse depicting established metastases are shown (a). Ex vivo imaging of tissues at necropsy reveal metastases to lung, spine, and other soft tissues (b). Bone and lung metastases were confirmed by histologic examination, shown at ×10 and ×40 magnification (c, d)
Fig. 6.
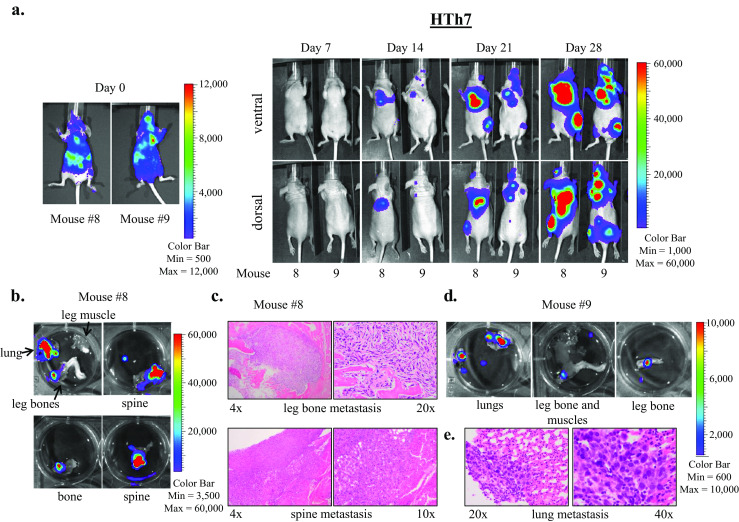
HTh7 cells form widespread metastases to lungs, bone, and brain in the intracardiac metastasis model. Images of two representative mice imaged weekly using the Xenogen IVIS 200 imaging system after intracardiac injection of HTh7 cells are shown (a). Ex vivo IVIS imaging reveals metastases to lungs and bone for mouse 8 (b) and mouse 9 (d), and metastases were confirmed by histologic examination. Bone metastases to the leg bone and spine are shown at 4×, 10×, and 20× magnification (c), and lung metastasis from mouse 9 is shown at ×20 and ×40 magnification (e)
Discussion
In this report, we describe our studies using a panel of ATC and PTC cell lines in two murine cancer models, an orthotopic thyroid cancer model and an intracardiac injection metastasis model, and the data are summarized in Table 3. Characteristics of these cell lines in these models with respect to take rate, growth velocity, final tumor size, ease of metastasis, etc., will prove useful for further study of the molecular basis of thyroid cancer development and progression, as well as for in vivo animal experiments for pharmacologic testing for novel treatment development for thyroid cancer.
Table 3.
Summary of thyroid cancer cell line take rates in the orthotopic and intracardiac injection metastasis models
| Tumor | Cell line | Mutation(s) | OT take rate | Tumor vol mm3 | IC take rate |
|---|---|---|---|---|---|
| ATC | 8505C | BRAF(V600E) | 100 % | 84 | 90 % |
| ATC | T238 | BRAF(V600E), PIK3CA(E542K) | 100 % | 212 | Not assessed |
| ATC | HTh74 | None knowna | 86 % | 59.5 | 100 % |
| ATC | HTh7 | NRAS(Q61R) | Not assessed | N/A | 100 % |
| ATC | THJ-16T | PIK3CA(E545K) | 75 % | 2.5 | 83 % |
| ATC | Cal62 | KRAS(G12R) | 63 % | 26.7 | 70 % |
| ATC | C643 | HRAS(G13R) | 0 % | N/A | 14 % |
| ATC | SW1736 | BRAF(V600E) | 0 % | N/A | 0 % |
| PTC | K1/GLAG-66 | BRAF(V600E), PIK3CA(E542K) | 100 % | 181 | 0 % |
| PTC | BCPAP | BRAF(V600E) | 92 % | 214 | 30 % |
| PTC | MDA-T41 | BRAF(V600E) | 0 % | N/A | Not assessed |
| PTC | TPC-1 | RET/PTC1 | 0 % | N/A | 0 % |
aNo known mutations in BRAF, NRAS, HRAS, KRAS, PIK3CA, PTEN, AKT1, and AKT2
Based on final tumor volumes, short duration of experiment, and overall take rates, the ATC cell lines 8505C and T238 and the PTC cell lines K1/GLAG-66 and BCPAP have the best utility for study in the orthotopic model. Furthermore, 8505C, T238, and BCPAP develop lung metastases in this model, though clear lymph node metastases were not identified. The spread of tumor to the lung is a particularly attractive feature, as advanced thyroid cancer in humans has a strong propensity for metastasis to the lungs. Though the ATC cell lines HTh74 and THJ-16T have good take rates (≥75 %), the small tumor volumes that result after protracted experiment duration may limit their utility.
In humans, thyroid cancer has a predilection for metastasis to lymph nodes, lungs, and bone. Therefore, the use of a preclinical in vivo metastasis model will provide valuable information on the role of signaling and microenvironmental factors critical for this process, as well as for the development and testing of potential therapies for advanced, metastatic thyroid cancer. In 2012, we published the first intracardiac injection metastasis model in thyroid cancer using the BCPAP cell line as a model [8]. Here, we show that the ATC cell lines HTh74, HTh7, 8505C, THJ-16T, and Cal62 also form distant metastases in this model, with take rates ≥70 %.
In the orthotopic model, studies from our group and others have observed an aggressive thyroid cancer model with lung metastasis in immunocompromised mice with the 8505C cell line [4, 5, 8, 13, 14, 24, 31–33], and the data presented here are consistent with the findings of these prior studies (Fig. 3). We also observed lung metastasis with anaplastic T238 cells in the orthotopic model (Fig. 2 and [29]). In contrast to other reports, however, we also observed lung metastasis when BCPAP cells were injected orthotopically in nude mice. In one experiment, 40 % of mice (n = 10) injected orthotopically with BCPAP cells developed lung metastases that were noted upon histopathologic examination of post mortem lung tissue (Supplemental Fig. 1). This frequency of pulmonary metastasis may have been underestimated, however, due to incomplete sectioning of the paraffin-embedded lung tissue. Gunda and colleagues described the orthotopic use of BCPAP cells in SCID mice, which reproducibly produced large tumors by 8 weeks post-injection, but without evidence of metastasis, though the methodology for this determination was not reported [14]. Lung metastases were not typically apparent on weekly IVIS imaging analysis in any of our studies, but rather were apparent on ex vivo imaging analysis or by histologic examination of lung tissues. This may have been due to masking from a strong signal from the primary thyroid tumor, low sensitivity to detect metastasis in vivo using this modality, or low volume of the lung micrometastases. The excellent take rate of BCPAP cells in the orthotopic model, however, support previously reported studies which detail and exploit its reliable tumor formation rate and large tumor size to study potential thyroid cancer therapies and disease mechanisms [4, 8, 13, 14].
Our results with MDA-T41 and TPC-1 cells in the orthotopic model are consistent with what others have observed. Clayman and colleagues also reported that MDA-T41 cells, with or without selection in soft agar, fail to form tumors when orthotopically implanted in nude mice [17]. Similarly, previously published reports by our group and others found that TPC-1 cells failed to form significant tumors in the orthotopic model in immunocompromised mice [4, 14]. Others, however, do report some success with TPC-1 cells in an orthotopic model. Ahn and colleagues reported a 10 % take rate of TPC-1 in an orthotopic model [1], and this group has followed this report with other studies utilizing TPC-1 and subclones of TPC-1 (BHP2-7 and TPC-1m) with success in the orthotopic model [15, 16, 18, 19, 21].
In this report, we also describe our studies with the intracardiac injection metastasis model. A separate metastasis model whereby thyroid cancer cells are injected into the tail vein of NOD.Cg-Prkdc scid Il2rg tm1Wjl/SzJ (Nod SCID gamma) mice was recently described by Zhang and colleagues [46]. Take rates in these two models were similar with 8505C (tail vein 100 % and intracardiac 90 %), THJ-16T (tail vein 100 % and intracardiac 83 %), and SW1736 cells (0 % in both models) [36, 46]. However, differences between the intracardiac and tail vein injection models were observed with the C643 and K1/GLAG-66 cell lines. A poor take rate was noted for C643 cells in the intracardiac injection studies presented here; however, Zhang and colleagues noted lung metastases in 100 % of mice injected with C643 cells in the tail vein injection model [46]. The Nod SCID gamma mice utilized in the tail vein injection studies have defects in both adaptive and innate immunity as well as deficient cytokine signaling. In contrast, our studies utilized athymic nude mice which lack T cells and therefore, have defects in B cell development and cell-mediated immunity. Differences in the metastasis models utilized by Zhang and colleagues and our studies (venous versus arterial injection strategies and murine models with differing degrees of immune compromise) may have had a significant impact on the different outcomes we observed. Differences in injection model may have also impacted the outcomes of our studies using the K1/GLAG-66 cell line, which was discordant from data previously published using the tail vein injection model. Specifically, Scarpino and colleagues utilized a tail vein injection metastasis model and identified lung metastases in 100 % of nude mice injected with K1/GLAG-66 cells harvested after 6 days [39]. However, in our studies of 5 nude mice, the intracardiac injection metastasis model had a take rate of 0 % with K1/GLAG-66 cells. In contrast, our take rate of K1/GLAG-66 cells in the orthotopic model was excellent at 100 %.
The MAPK and PI3K pathways are frequently activated in thyroid cancer. The four cell lines which had the highest take rates in the orthotopic model (8505C, T238, K1/GLAG-66, and BCPAP) all express mutant BRAF (BRAF V600E), and two of these cell lines (T238 and K1/GLAG-66) also express mutant PI3K (PIK3CA E542K). The resultant mutant BRAF and PI3K (with mutation in catalytic p110α subunit) are constitutively activated, leading to continued signaling through the MAPK and PI3K pathways, respectively. Though the cell lines with highest take rates expressed mutant BRAF, not all cell lines with the BRAFV600E mutation were successful in the orthotopic model (SW1736, MDA-T41). Two cell lines (Cal62 and C643) contained mutations in RAS, another commonly mutated gene in thyroid cancer, which activates the MAPK pathway. The C643 cells were unsuccessful at establishing thyroid tumors in the orthotopic model (Table 1). As above, the Cal62 cells had an overall take rate of 62.5 %, but average tumor volume was small (26.7 mm3). Of note, we have further tested the Cal62 cells using a flank model, and with subcutaneous flank injection of 2–5 × 10⁶ cells, we have found a take rate of 100 % with average tumor volumes ranging from 250–1,370 mm3 at 6–9 weeks (data not shown). Discrepant growth rate was also noted by Nucera in his initial description of the ATC orthotopic model with 8505C cells in which orthotopic tumor volume vastly exceeded subcutaneous flank tumor volume [33], suggesting that the microenvironment may play different roles in tumor growth. The THJ-16T cell line, which contains a different mutation in the PI3K catalytic subunit (PIK3CA E545K), produced small tumors in this model (2.5 mm3). The cell line with RET/PTC1 rearrangement (TPC-1) did not produce tumors in the orthotopic tumor model. The ATC cell line HTh74 has no known genetic alterations. Overall, with regard to success in the intracardiac metastasis model, there was no discernible correlation between take rate and mutation status for the common mutations represented in this study (BRAF, RAS, and PIK3CA; Table 2). In addition, we have not identified a correlation of TERT promoter mutation status, which has been associated with tumor aggressiveness [25–27, 30], with cell line take rates in either model (data not shown).
Studies from our group and others have used these models to evaluate important therapeutic targets in the development and progression of thyroid cancer, as well as for the testing of potential therapies for thyroid cancer. Targeting BRAFV600E has been extensively studied in the orthotopic model. Nucera and colleagues have utilized both genetic and pharmacologic studies to investigate early and late intervention strategies using the orthotopic model [35]. Additional studies have also shown important effects of targeting BRAFV600E on tumor volume and lung metastasis in this model [13, 31, 32, 34]. Our group has successfully exploited both the orthotopic and intracardiac injection metastasis model using dasatinib to inhibit the proto-oncogene Src [8], and Henderson and colleagues have further shown the importance of this target in their orthotopic studies [19]. Additional studies utilizing multi-kinase and angiogenesis inhibitors, as well as other pharmacologic agents, in the orthotopic murine model have contributed significantly to the field through investigation of potential targets and therapies for advanced thyroid cancer [2, 5, 9, 12, 14–16, 18, 21, 28, 38]. Importantly, these models have also allowed for the study of cell lines with genetically-altered expression to interrogate pathways involved in thyroid cancer development and progression and explore their potential as therapeutic targets [4, 24, 29, 36, 44]. Finally, Parangi and colleagues have recently developed the next generation of orthotopic thyroid cancer models using immunocompetent mouse models, which will be valuable to study thyroid tumor biology and responses to therapy in the context of a functional immune system [43].
In summary, the data reported here detail our analyses of a panel of authenticated thyroid cancer cell lines representing both PTC and ATC in two murine cancer models—an orthotopic thyroid model and an intracardiac injection metastasis model. It is our goal that these findings will inform the choice of cell lines and model systems to further study the mechanisms underlying thyroid cancer development, progression, and metastases as well as to facilitate the preclinical testing of potential therapies for thyroid cancer.
Electronic supplementary material
Below is the link to the electronic supplementary material.
BCPAP PTC cells form tumors and lung metastases in the orthotopic tumor model. A representative H&E stained primary tumor specimen is shown at ×10 and ×20 magnification (a). Arrow indicates area of normal thyroid follicles. Lung micrometastases were identified in lung tissue harvested from mice at necropsy and are shown at ×20 magnification (b). (PPTX 2266 kb)
Acknowledgments
The authors would like to thank Dr. Jeffrey Knauf at Memorial Sloan Kettering Cancer Center for Sequenom analysis of the cell lines, Drs. Jeffrey Myers and Maria Gule at MD Anderson Cancer Center for their guidance in establishing the orthotopic thyroid cancer model, and Dr. Carol Sartorius at the University of Colorado for her guidance in establishing the intracardiac injection model. We also thank Randall Wong at the B. Davis Center BioResources Core Facility, Molecular Biology Unit, and Dr. Christopher Korch, UCCC, for STR profiling of the cell lines. This work was supported by National Cancer Institute grant K12CA086913-13 (RES), 1R01CA164193 (RES), American Cancer Society RSG-13-060-01-TBE (RES), 1 RC1 CA147371 (RES and BRH), and 1R01CA155512-01A1 (BRH). The UCCC Flow Cytometry Core, UCCC Sequencing and Analysis Core (for STR profiling), UCCC Pathology Core, and UCCC Small Animal Imaging Cores are supported by NCI Cancer Center support grant P30 CA046934.
Conflict of Interest
None
References
- 1.Ahn SH, Henderson Y, Kang Y, Chattopadhyay C, Holton P, Wang M, Briggs K, Clayman GL. An orthotopic model of papillary thyroid carcinoma in athymic nude mice. Arch Otolaryngol Head Neck Surg. 2008;134(2):190–197. doi: 10.1001/archoto.2007.36. [DOI] [PubMed] [Google Scholar]
- 2.Alfano RW, Leppla SH, Liu S, Bugge TH, Ortiz JM, Lairmore TC, Duesbery NS, Mitchell IC, Nwariaku F, Frankel AE. Inhibition of tumor angiogenesis by the matrix metalloproteinase-activated anthrax lethal toxin in an orthotopic model of anaplastic thyroid carcinoma. Mol Cancer Ther. 2010;9(1):190–201. doi: 10.1158/1535-7163.MCT-09-0694. [DOI] [PMC free article] [PubMed] [Google Scholar]
- 3.Antonello ZA, Nucera C. Orthotopic mouse models for the preclinical and translational study of targeted therapies against metastatic human thyroid carcinoma with BRAF or wild-type BRAF. Oncogene. 2014;33(47):5397–5404. doi: 10.1038/onc.2013.544. [DOI] [PMC free article] [PubMed] [Google Scholar]
- 4.Bauerle KT, Schweppe RE, Lund G, Kotnis G, Deep G, Agarwal R, Pozdeyev N, Wood WM, Haugen BR. Nuclear factor kappaB-dependent regulation of angiogenesis, and metastasis in an in vivo model of thyroid cancer is associated with secreted interleukin-8. J Clin Endocrinol Metab. 2014;99(8):E1436–E1444. doi: 10.1210/jc.2013-3636. [DOI] [PMC free article] [PubMed] [Google Scholar]
- 5.Bellelli R, Castellone MD, Garcia-Rostan G, Ugolini C, Nucera C, Sadow PM, Nappi TC, et al. FOXM1 is a molecular determinant of the mitogenic and invasive phenotype of anaplastic thyroid carcinoma. Endocr Relat Cancer. 2012;19(5):695–710. doi: 10.1530/ERC-12-0031. [DOI] [PMC free article] [PubMed] [Google Scholar]
- 6.Brose MS, Nutting CM, Jarzab B, Elisei R, Siena S, Bastholt L, de la Fouchardiere C, et al. Sorafenib in radioactive iodine-refractory, locally advanced or metastatic differentiated thyroid cancer: a randomised, double-blind, phase 3 trial. Lancet. 2014;384(9940):319–328. doi: 10.1016/S0140-6736(14)60421-9. [DOI] [PMC free article] [PubMed] [Google Scholar]
- 7.Cardiff RD, Miller CH, Munn RJ. Manual hematoxylin and eosin staining of mouse tissue sections. Cold Spring Harb Protoc. 2014;6:655–658. doi: 10.1101/pdb.prot073411. [DOI] [PubMed] [Google Scholar]
- 8.Chan CM, Jing X, Pike LA, Zhou Q, Lim DJ, Sams SB, Lund GS, Sharma V, Haugen BR, Schweppe RE. Targeted inhibition of Src kinase with dasatinib blocks thyroid cancer growth and metastasis. Clin Cancer Res. 2012;18(13):3580–3591. doi: 10.1158/1078-0432.CCR-11-3359. [DOI] [PMC free article] [PubMed] [Google Scholar]
- 9.Chang JW, Kang SU, Choi JW, Shin YS, Baek SJ, Lee SH, Kim CH. Tolfenamic acid induces apoptosis and growth inhibition in anaplastic thyroid cancer: involvement of nonsteroidal anti-inflammatory drug-activated gene-1 expression and intracellular reactive oxygen species generation. Free Radic Biol Med. 2014;67:115–130. doi: 10.1016/j.freeradbiomed.2013.10.818. [DOI] [PubMed] [Google Scholar]
- 10.Garg M, Okamoto R, Nagata Y, Kanojia D, Venkatesan,T. A. M, G. D. Braunstein et al. (2014) Establishment and characterization of novel human primary and metastatic anaplastic thyroid cancer cell lines and their genomic evolution over a year as a primagraft. J Clin Endocrinol Metab jc20142359. doi:10.1210/jc.2014-2359 [DOI] [PMC free article] [PubMed]
- 11.Grant CS, Thompson G. Anaplastic thyroid carcinoma: hope on the horizon? Surgery. 2011;150(6):1220–1221. doi: 10.1016/j.surg.2011.10.006. [DOI] [PubMed] [Google Scholar]
- 12.Gule MK, Chen Y, Sano D, Frederick MJ, Zhou G, Zhao M, Milas ZL, et al. Targeted therapy of VEGFR2 and EGFR significantly inhibits growth of anaplastic thyroid cancer in an orthotopic murine model. Clin Cancer Res. 2011;17(8):2281–2291. doi: 10.1158/1078-0432.CCR-10-2762. [DOI] [PMC free article] [PubMed] [Google Scholar]
- 13.Gunda V, Bucur O, Varnau J, Vanden Borre P, Bernasconi MJ, Khosravi-Far R, Parangi S. Blocks to thyroid cancer cell apoptosis can be overcome by inhibition of the MAPK and PI3K/AKT pathways. Cell Death Dis. 2014;5:e1104. doi: 10.1038/cddis.2014.78. [DOI] [PMC free article] [PubMed] [Google Scholar]
- 14.Gunda V, Frederick DT, Bernasconi MJ, Wargo JA, Parangi S. A potential role for immunotherapy in thyroid cancer by enhancing NY-ESO-1 cancer antigen expression. Thyroid. 2014;24(8):1241–1250. doi: 10.1089/thy.2013.0680. [DOI] [PMC free article] [PubMed] [Google Scholar]
- 15.Henderson YC, Ahn SH, Clayman GL. Inhibition of the growth of papillary thyroid carcinoma cells by CI-1040. Arch Otolaryngol Head Neck Surg. 2009;135(4):347–354. doi: 10.1001/archoto.2009.17. [DOI] [PMC free article] [PubMed] [Google Scholar]
- 16.Henderson YC, Ahn SH, Kang Y, Clayman GL. Sorafenib potently inhibits papillary thyroid carcinomas harboring RET/PTC1 rearrangement. Clin Cancer Res. 2008;14(15):4908–4914. doi: 10.1158/1078-0432.CCR-07-1772. [DOI] [PMC free article] [PubMed] [Google Scholar]
- 17.Henderson YC, Ahn SH, Ryu J, Chen Y, Williams MD, El-Naggar AK, Gagea M et al. (2015) Development and characterization of six new human papillary thyroid carcinoma cell lines. J Clin Endocrinol Metab jc20142624. doi:10.1210/jc.2014-2624 [DOI] [PMC free article] [PubMed]
- 18.Henderson YC, Chen Y, Frederick MJ, Lai SY, Clayman GL. MEK inhibitor PD0325901 significantly reduces the growth of papillary thyroid carcinoma cells in vitro and in vivo. Mol Cancer Ther. 2010;9(7):1968–1976. doi: 10.1158/1535-7163.MCT-10-0062. [DOI] [PMC free article] [PubMed] [Google Scholar]
- 19.Henderson YC, Toro-Serra R, Chen Y, Ryu J, Frederick MJ, Zhou G, Gallick GE, Lai SY, Clayman GL. Src inhibitors in suppression of papillary thyroid carcinoma growth. Head Neck. 2014;36(3):375–384. doi: 10.1002/hed.23316. [DOI] [PMC free article] [PubMed] [Google Scholar]
- 20.Jenkins DE, Hornig YS, Oei Y, Dusich J, Purchio T. Bioluminescent human breast cancer cell lines that permit rapid and sensitive in vivo detection of mammary tumors and multiple metastases in immune deficient mice. Breast Cancer Res. 2005;7(4):R444–R454. doi: 10.1186/bcr1026. [DOI] [PMC free article] [PubMed] [Google Scholar]
- 21.Jeong WJ, Mo JH, Park MW, Choi IJ, An SY, Jeon EH, Ahn SH. Sunitinib inhibits papillary thyroid carcinoma with RET/PTC rearrangement but not BRAF mutation. Cancer Biol Ther. 2011;12(5):458–465. doi: 10.4161/cbt.12.5.16303. [DOI] [PubMed] [Google Scholar]
- 22.Kang Y. Analysis of cancer stem cell metastasis in xenograft animal models. In: Yu JS, editor. Methods in molecular biology. New York: Humana Press; 2009. [DOI] [PubMed] [Google Scholar]
- 23.Kim S, Park YW, Schiff BA, Doan DD, Yazici Y, Jasser SA, Younes M, Mandal M, Bekele BN, Myers JN. An orthotopic model of anaplastic thyroid carcinoma in athymic nude mice. Clin Cancer Res. 2005;11(5):1713–1721. doi: 10.1158/1078-0432.CCR-04-1908. [DOI] [PubMed] [Google Scholar]
- 24.Lee SE, Lee JU, Lee MH, Ryu MJ, Kim SJ, Kim YK, Choi MJ et al. (2013) RAF kinase inhibitor-independent constitutive activation of Yes-associated protein 1 promotes tumor progression in thyroid cancer. Oncogenesis 2:e55. doi:10.1038/oncsis.2013.12 [DOI] [PMC free article] [PubMed]
- 25.Liu X, Bishop J, Shan Y, Pai S, Liu D, Murugan AK, Sun H, El-Naggar AK, Xing M. Highly prevalent TERT promoter mutations in aggressive thyroid cancers. Endocr Relat Cancer. 2013;20(4):603–610. doi: 10.1530/ERC-13-0210. [DOI] [PMC free article] [PubMed] [Google Scholar]
- 26.Liu X, Qu S, Liu R, Sheng C, Shi X, Zhu G, Murugan AK, et al. TERT promoter mutations and their association with BRAF V600E mutation and aggressive clinicopathological characteristics of thyroid cancer. J Clin Endocrinol Metab. 2014;99(6):E1130–E1136. doi: 10.1210/jc.2013-4048. [DOI] [PMC free article] [PubMed] [Google Scholar]
- 27.Melo M, da Rocha AG, Vinagre J, Batista R, Peixoto J, Tavares C, Celestino R, et al. TERT promoter mutations are a major indicator of poor outcome in differentiated thyroid carcinomas. J Clin Endocrinol Metab. 2014;99(5):E754–E765. doi: 10.1210/jc.2013-3734. [DOI] [PMC free article] [PubMed] [Google Scholar]
- 28.Mo JH, Choi IJ, Jeong WJ, Jeon EH, Ahn SH. HIF-1alpha and HSP90: target molecules selected from a tumorigenic papillary thyroid carcinoma cell line. Cancer Sci. 2012;103(3):464–471. doi: 10.1111/j.1349-7006.2011.02181.x. [DOI] [PMC free article] [PubMed] [Google Scholar]
- 29.Morrison JA, Pike LA, Sams SB, Sharma V, Zhou Q, Severson JJ, Tan A-C, Wood WM, Haugen BR (2014) Thioredoxin interacting protein (TXNIP) is a novel tumor suppressor in thyroid cancer. Mol Cancer in press [DOI] [PMC free article] [PubMed]
- 30.Muzza M, Colombo C, Rossi S, Tosi D, Cirello V, Perrino M, De Leo S, et al. Telomerase in differentiated thyroid cancer: promoter mutations, expression and localization. Mol Cell Endocrinol. 2015;399:288–295. doi: 10.1016/j.mce.2014.10.019. [DOI] [PubMed] [Google Scholar]
- 31.Nehs MA, Nagarkatti S, Nucera C, Hodin RA, Parangi S. Thyroidectomy with neoadjuvant PLX4720 extends survival and decreases tumor burden in an orthotopic mouse model of anaplastic thyroid cancer. Surgery. 2010;148(6):1154–1162. doi: 10.1016/j.surg.2010.09.001. [DOI] [PMC free article] [PubMed] [Google Scholar]
- 32.Nehs MA, Nucera C, Nagarkatti SS, Sadow PM, Morales-Garcia D, Hodin RA, Parangi S. Late intervention with anti-BRAF(V600E) therapy induces tumor regression in an orthotopic mouse model of human anaplastic thyroid cancer. Endocrinology. 2012;153(2):985–994. doi: 10.1210/en.2011-1519. [DOI] [PMC free article] [PubMed] [Google Scholar]
- 33.Nucera C, Nehs MA, Mekel M, Zhang X, Hodin R, Lawler J, Nose V, Parangi S. A novel orthotopic mouse model of human anaplastic thyroid carcinoma. Thyroid. 2009;19(10):1077–1084. doi: 10.1089/thy.2009.0055. [DOI] [PMC free article] [PubMed] [Google Scholar]
- 34.Nucera C, Nehs MA, Nagarkatti SS, Sadow PM, Mekel M, Fischer AH, Lin PS, et al. Targeting BRAFV600E with PLX4720 displays potent antimigratory and anti-invasive activity in preclinical models of human thyroid cancer. Oncologist. 2011;16(3):296–309. doi: 10.1634/theoncologist.2010-0317. [DOI] [PMC free article] [PubMed] [Google Scholar]
- 35.Nucera C, Porrello A, Antonello ZA, Mekel M, Nehs MA, Giordano TJ, Gerald D, et al. B-Raf(V600E) and thrombospondin-1 promote thyroid cancer progression. Proc Natl Acad Sci USA. 2010;107(23):10649–10654. doi: 10.1073/pnas.1004934107. [DOI] [PMC free article] [PubMed] [Google Scholar]
- 36.Reeb AN, Li W, Sewell W, Marlow LA, Tun HW, Smallridge RC, Copland JA, Spradling K, Chernock R, Lin RY (2014) S100A8 is a novel therapeutic target for anaplastic thyroid carcinoma. J Clin Endocrinol Metab 100 (2):E232–E242. doi:10.1210/jc.2014-2988 [DOI] [PMC free article] [PubMed]
- 37.Ribeiro FR, Meireles AM, Rocha AS, Teixeira MR. Conventional and molecular cytogenetics of human non-medullary thyroid carcinoma: characterization of eight cell line models and review of the literature on clinical samples. BMC Cancer. 2008;8:371. doi: 10.1186/1471-2407-8-371. [DOI] [PMC free article] [PubMed] [Google Scholar]
- 38.Sandulache VC, Skinner HD, Wang Y, Chen Y, Dodge CT, Ow TJ, Bankson JA, Myers JN, Lai SY. Glycolytic inhibition alters anaplastic thyroid carcinoma tumor metabolism and improves response to conventional chemotherapy and radiation. Mol Cancer Ther. 2012;11(6):1373–1380. doi: 10.1158/1535-7163.MCT-12-0041. [DOI] [PMC free article] [PubMed] [Google Scholar]
- 39.Scarpino S, Duranti E, Giglio S, Di Napoli A, Galafate D, Del Bufalo D, Desideri M, Socciarelli F, Stoppacciaro A, Ruco L. Papillary carcinoma of the thyroid: high expression of COX-2 and low expression of KAI-1/CD82 are associated with increased tumor invasiveness. Thyroid. 2013;23(9):1127–1137. doi: 10.1089/thy.2011.0421. [DOI] [PubMed] [Google Scholar]
- 40.Schweppe RE, Klopper JP, Korch C, Pugazhenthi U, Benezra M, Knauf JA, Fagin JA, et al. Deoxyribonucleic acid profiling analysis of 40 human thyroid cancer cell lines reveals cross-contamination resulting in cell line redundancy and misidentification. J Clin Endocrinol Metab. 2008;93(11):4331–4341. doi: 10.1210/jc.2008-1102. [DOI] [PMC free article] [PubMed] [Google Scholar]
- 41.Siegel RL, Miller KD, Jemal A. Cancer statistics. CA Cancer J Clin. 2015;65(1):5–29. doi: 10.3322/caac.21254. [DOI] [PubMed] [Google Scholar]
- 42.Smallridge RC, Copland JA. Anaplastic thyroid carcinoma: pathogenesis and emerging therapies. Clin Oncol (R Coll Radiol) 2010;22(6):486–497. doi: 10.1016/j.clon.2010.03.013. [DOI] [PMC free article] [PubMed] [Google Scholar]
- 43.Vanden Borre P, McFadden DG, Gunda V, Sadow PM, Varmeh S, Bernasconi M, Jacks T, Parangi S. The next generation of orthotopic thyroid cancer models: immunocompetent orthotopic mouse models of BRAF V600E-positive papillary and anaplastic thyroid carcinoma. Thyroid. 2014;24(4):705–714. doi: 10.1089/thy.2013.0483. [DOI] [PMC free article] [PubMed] [Google Scholar]
- 44.Wood WM, Sharma V, Bauerle KT, Pike LA, Zhou Q, Fretwell DL, Schweppe RE, Haugen BR (2011) PPARgamma promotes growth and invasion of thyroid cancer cells. PPAR Res 2011:171765. doi:10.1155/2011/171765 [DOI] [PMC free article] [PubMed]
- 45.Xing M. Molecular pathogenesis and mechanisms of thyroid cancer. Nat Rev Cancer. 2013;13(3):184–199. doi: 10.1038/nrc3431. [DOI] [PMC free article] [PubMed] [Google Scholar]
- 46.Zhang L, Gaskins K, Yu Z, Xiong Y, Merino MJ, Kebebew E. An in vivo mouse model of metastatic human thyroid cancer. Thyroid. 2014;24(4):695–704. doi: 10.1089/thy.2013.0149. [DOI] [PMC free article] [PubMed] [Google Scholar]
Associated Data
This section collects any data citations, data availability statements, or supplementary materials included in this article.
Supplementary Materials
BCPAP PTC cells form tumors and lung metastases in the orthotopic tumor model. A representative H&E stained primary tumor specimen is shown at ×10 and ×20 magnification (a). Arrow indicates area of normal thyroid follicles. Lung micrometastases were identified in lung tissue harvested from mice at necropsy and are shown at ×20 magnification (b). (PPTX 2266 kb)