Abstract
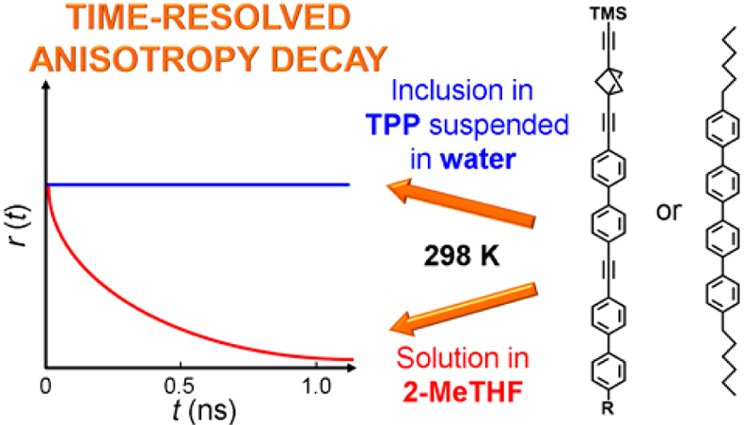
We examine the fluorescence anisotropy of rod-shaped guests held inside the channels of tris(o-phenylenedioxy)cyclotriphosphazene (TPP) host nanocrystals, characterized by powder X-ray diffraction and solid state NMR spectroscopy. We address two issues: (i) are light polarization measurements on an aqueous colloidal solution of TPP nanocrystals meaningful, or is depolarization by scattering excessive? (ii) Can measurements of the rotational mobility of the included guests be performed at low enough loading levels to suppress depolarization by intercrystallite energy transfer? We find that meaningful measurements are possible and demonstrate that the long axis of molecular rods included in TPP channels performs negligible vibrational motion.
Introduction
Over the years, molecular-size rotors have elicited considerable attention, for a variety of reasons.1−9 Our ultimate interest is in their potential use for the miniaturization of analog electronics. For this purpose, it would be useful to have access to ultrathin layers of ferroelectric materials with controlled properties, especially a low velocity of polarization propagation. In presently used bulk materials (e.g., barium titanate), this velocity is high, on the order of several thousand meters per second, dictating quite large minimal dimensions of components such as filters. It appears that a suitably chosen array of dipolar molecular rotors might have a ferroelectric ground state10 and that its properties, including the polarization propagation rate, could be controlled by synthesis. Our preliminary estimates suggest that the velocity, and thus electronic component size, could be reduced by two or three orders of magnitude.
While individual surface-mounted dipolar molecular rotors,11−13 their random assemblies,14 and crystals containing dipolar rotors in a periodic lattice of a metallo-organic framework15,16 have already received much attention, regular two-dimensional (2D) arrays of artificial dipolar rotors have not been prepared. One way of approaching this goal is through surface inclusion compounds,17 in which the shafts of molecular rotors are inserted into channels in a host crystal and do not penetrate deeper because they are attached to a stopper that is wider than the channel. The part of the molecular rotor that remains outside the crystal carries a dipolar rotator. If the barriers to the rotation of the rotator were small enough, the geometry of the 2D rotor lattice favorable, and the inter-rotator interactions strong enough to make the Curie temperature higher than the Debye temperature, a ferroelectric surface would result.
Small domains of a surface approaching this ideal have already been prepared.17 The channel-containing host was tris(o-phenylenedioxy)cyclotriphosphazene (TPP), whose hexagonal phase crystallizes in layers penetrated in the perpendicular direction by a triangularly arranged set of channels capable of accepting guest molecules (Figure 1). The guest was a molecular rotor composed of a long alkyl chain as the shaft, p-carborane as the stopper, and 2,3-dichlorophenyl as the dipolar rotator. In order to secure sufficient signal intensity for solid-state NMR measurements, nanocrystalline TPP with a large surface area was used. The barrier to rotation turned out to be excessive (5–9 kcal/mol) and the Debye temperature too high for collective behavior to emerge, and no ferroelectricity was observed. The high barrier was attributed to a significant deviation of the rotator-carrying axle from the surface normal, which introduced mechanical contact between the rotator and the TPP crystal surface and possibly also mechanical interference between neighboring rotators. The situation was not remedied when the axle direction was lined up with the surface normal by a different shaft design, since the stopper action of the p-carborane unit then became inadequate and the whole molecular rotor entered inside the channel to form a bulk inclusion compound.18 An examination of the requirements for proper stopper action in TPP channels is continuing.19−21
Figure 1.
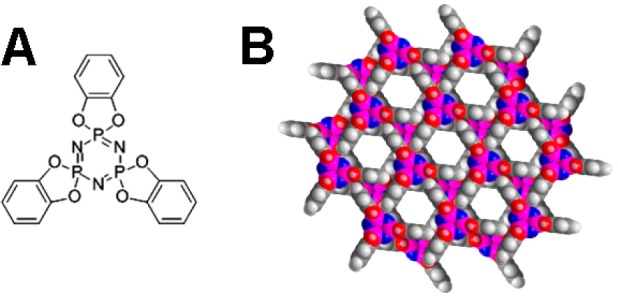
Chemical structure of TPP (A) and two layers of crystal viewed from above (B).
It thus appears that in addition to making sure that the included molecular rotors remain on the surface, it is also important to prevent any significant deviation of the rotor axle from the direction of the channel axis. While the extent of rotor insertion can be readily judged from the chemical shifts of its various atoms observed in solid-state NMR spectroscopy, and while NMR spectra can also provide useful information on rotational dynamics of a guest inside the TPP channel,22,23 we considered it desirable to complement NMR spectroscopy with measurement of time-resolved fluorescence anisotropy, a method that in principle should permit the motion of the rotator to be followed in real time.
There are two likely problems that may cause depolarization and render this type of measurement useless: (i) light scattering by the nanocrystalline TPP sample and (ii) chromophore-to-chromophore energy transfer. Before going to the trouble of synthesizing a rotor molecule suitable for an examination of the rotational motion of the attached dipolar rotator itself, we decided to determine whether meaningful measurements are possible, and we report the results presently. To avoid difficulties with light scattering, we disperse the TPP nanoparticles as a colloidal solution in water. Transient absorption anisotropy and photoluminescence anisotropy of colloidal dispersions of very small nanoparticles have been successfully measured before24,25 and colloidal solutions of nanocrystals have been used for transient absorption spectroscopy,26 but we were concerned that our TPP particles could not only be larger but also agglomerated into even larger objects, depolarizing light by scattering. We now demonstrate that this is not the case and that meaningful polarization measurements on TPP dispersions are possible. To minimize problems due to nanocrystal-to-nanocrystal energy transfer within a conglomerate, we use low guest loading.
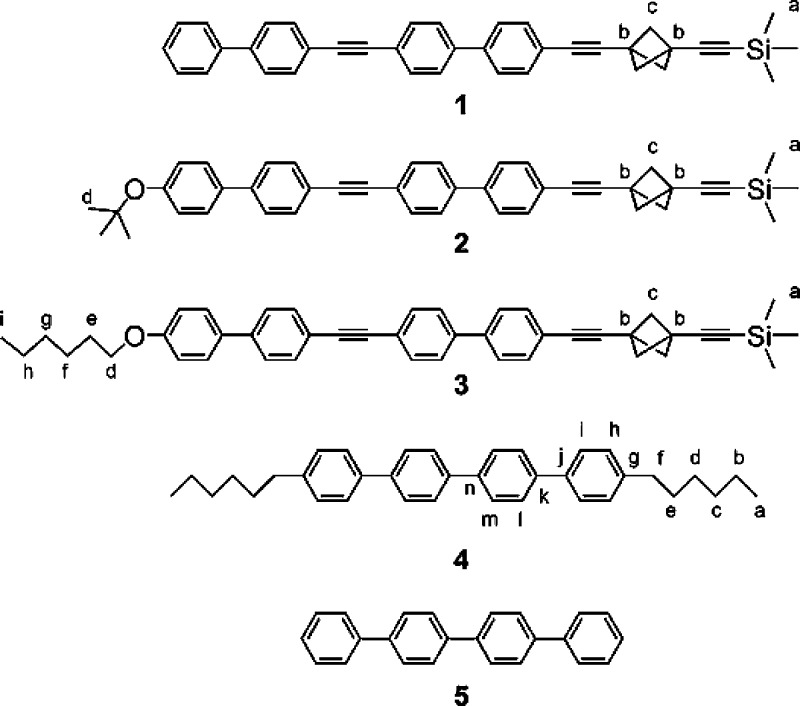
The chromophores in the molecular rods 1–5 (Chart 1) used in the study are of the oligophenyl/diphenylacetylene type, and their lowest-energy absorption and fluorescence transition moments lie along the long molecular axis. They are similar to some of the rotor shafts that were used in our prior work with included molecular rotors.18,20 The saturated groups attached at rod ends serve two purposes: they facilitate synthetic manipulations by increasing solubility and they enhance the minimum distance between neighboring chromophores included in the same channel, thus reducing the rate of energy transfer. For comparison, we attempted to include the parent p-quaterphenyl (5), which does not carry such insulating substituents, but both solid-state NMR and X-ray diffraction measurement showed conclusively that it does not form an inclusion compound with TPP under the conditions in which 1–4 do.
Chart 1. Structures 1–5 and Atom Labels used in Table 1.
We use the notation X%Y@TPP to refer to an inclusion compound containing X mol % of guest Y in the TPP host.
Results
Molecular Rod Synthesis
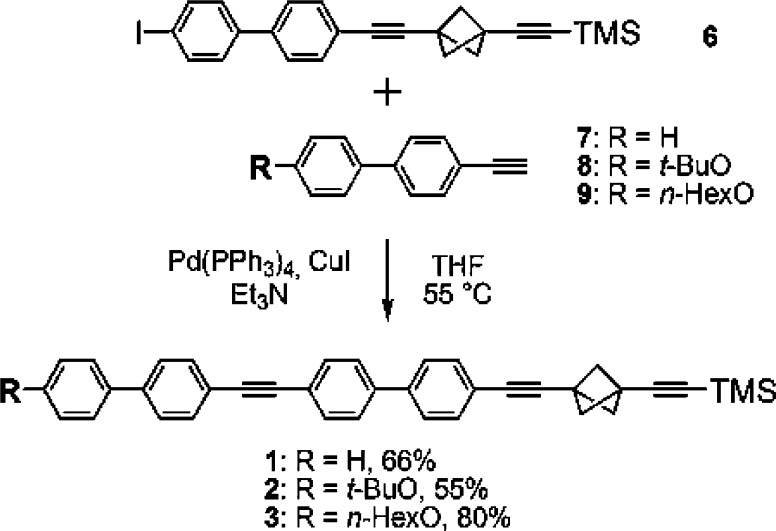
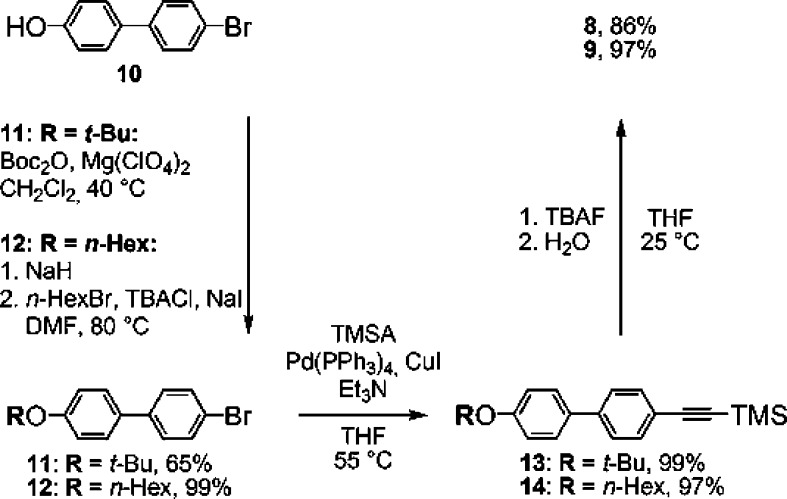
The rods 1–3 were formed by Sonogashira cross-coupling of the bicyclo[1.1.1]pentane derivative 6 with the alkynes 7–9 (Scheme 1) in almost quantitative yields, but their low solubility reduced the isolated yields to 50–80%. Access to 6 requires six known steps from commercial precursors.27−29 Scheme 2 shows the three-step synthesis of the required alkynes 8 and 9 from 4′-bromo-4-hydroxybiphenyl (10), which is commercially available, as are 5 and 7.
Scheme 1. Synthesis of 1–3.
Scheme 2. Synthesis of 8 and 9.
The poorly soluble quaterphenyl derivative 4 was synthesized by Suzuki coupling of 1-hexyl-4-iodobenzene30 with the commercial pinacolate diester of p,p′-biphenylbisboronic acid (Scheme 3).
Scheme 3. Synthesis of 4.
Inclusion Compound Preparation and Structural Characterization
Benzene-free hexagonal form of solid TPP-d1217 was milled with a known amount of solid molecular rods 1–5 and annealed at 70 °C. Although the detailed structure of the resulting inclusion compound is not of primary interest for the purposes of this study, it was considered essential to ascertain beyond doubt that the chromophores to be studied actually were inserted inside the TPP channels and not present as a separate solid phase. The data presented next demonstrate that this was indeed the case for 1–4 but not for 5.
Sample Morphology
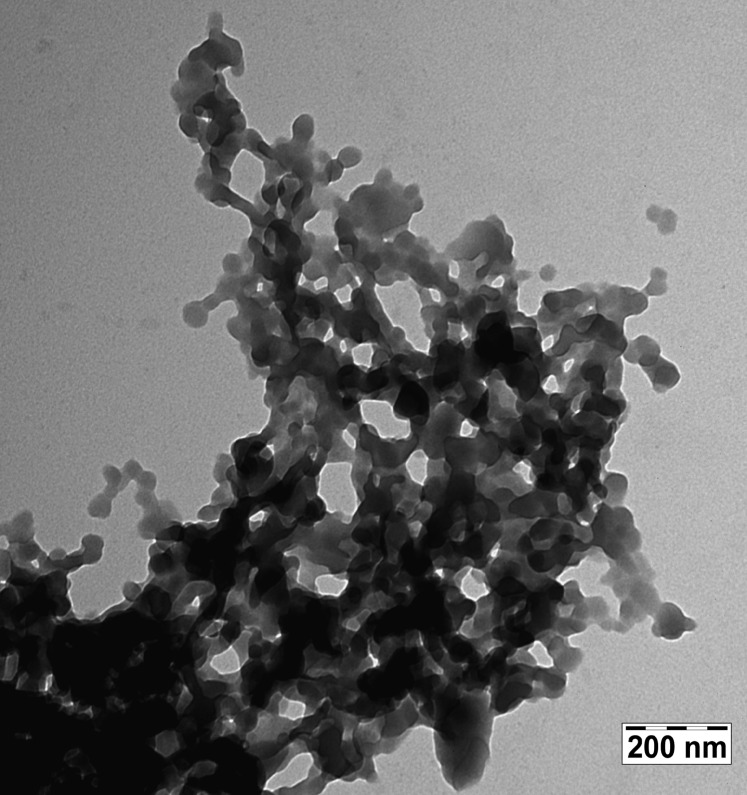
One of the resulting samples, 22%1@TPP, was examined by transmission electron microscopy (TEM), which showed it to consist of conglomerates of flat circular discs with a ∼40 nm diameter and ∼15 nm thickness (Figure 2).
Figure 2.
TEM of 22%1@TPP.
Sample Structure
Two structural tools were applied to all of the samples to determine whether they were inclusion compounds of TPP: copper Kα1 wavelength powder X-ray diffraction (XRD) and solid-state NMR (ssNMR) spectroscopy. They agreed that 1–4 formed inclusion compounds while 5 did not.
In XRD, the samples formed from 1–4 show a sequence of diffraction peaks that are well explained by a hexagonal structure. As an example, Figure 3 shows the powder diffraction pattern measured for 20%2@TPP-d12, the sample with the largest in-plane hexagonal lattice parameter (the scattering wave vector q is related to the scattering angle θ and X-ray wavelength λ by q = 4π sin θ /λ). For 22%1@TPP-d12, 20%2@TPP-d12, 20%3@TPP-d12, and 20%4@TPP, the results are consistent with a single hexagonal structural phase, provide no evidence for the presence of monoclinic TPP, and contain no extraneous peaks. The in-plane lattice parameter is 1.170 ± 0.001, 1.175 ± 0.001, 1.168 ± 0.001, and 1.164 ± 0.001 nm, respectively, the hexagonal layer spacing (thickness of two layers, mutually rotated by 60°) is 0.996 ± 0.001, 0.999 ± 0.001, 0.997 ± 0.001, and 0.996 ± 0.001 nm, respectively, and the average powder particle size estimated from peak widths is 22, 50, 70, and over 100 nm, respectively. The in-plane lattice parameter and layer spacing show roughly 2.5% expansion and 1.7% contraction compared to the 1.1454 ± 0.0005 and 1.0160 ± 0.0005 nm values reported31 for empty hexagonal TPP. These results demonstrate that 1–4 all form hexagonal inclusion compounds in TPP.
Figure 3.
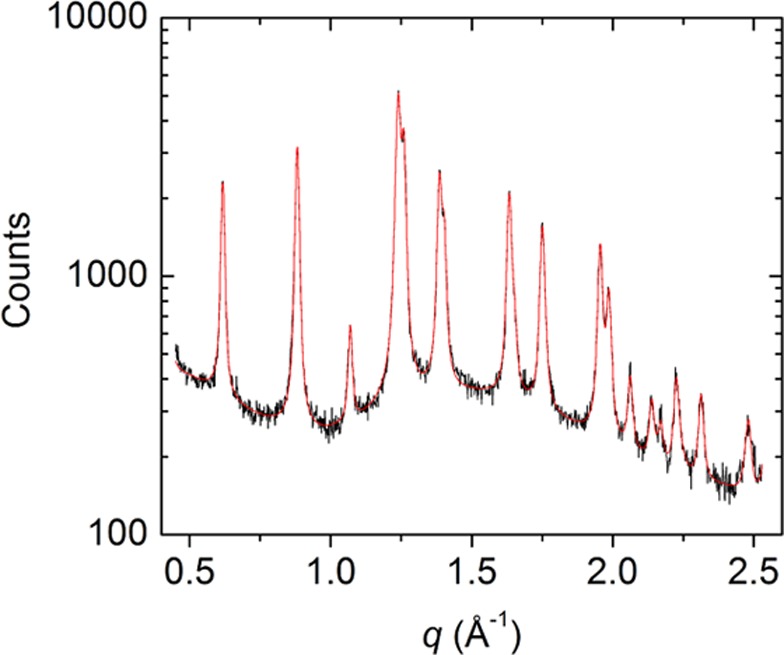
X-ray powder pattern from inclusion compound 20%2@TPP-d12 (annealed at 70 °C). Solid black line is diffraction data and red line is a fitting result, assuming hexagonal peak positions and a measured background from the sample capillary tube.
In contrast, XRD results show clearly that samples produced from 5 were mixtures of monoclinic and slightly expanded hexagonal TPP with a few impurity peaks that may arise from crystalline 5 and that no inclusion compound with TPP was formed under the conditions used in our experiments.
The ssCP MAS 13C NMR results are summarized in Table 1 (cf. Chart 1). They confirm the conclusions drawn from the XRD data and provide additional detail. The 13C spectra of the inclusion compounds are dominated by the three peaks in the aromatic region characteristic of the carbon atoms of hexagonal TPP,18 demonstrating the presence of proton-carrying guest molecules in the channels. In pure perdeuteriated TPP-d12, there are no protons, and magnetization transfer from protons to carbons is not available. Such a sample shows no 13C signals, or only extremely weak (since the deuteriation is not 100% complete). The 31P CP MAS and 31P SPE (single pulse excitation) NMR spectra of these samples, obtained for 1–4, show only the peaks characteristic of hexagonal TPP, confirming the absence of monoclinic TPP. In addition, there is a broad peak in the 31P NMR spectrum of 1, due to decomposed TPP.
Table 1. Guest 13C Chemical Shift Differences (δTPP – δs, in ppm) in a TPP Host Inclusion (δTPP) and in Solution (δs).
| carbon atom label (Chart 1) |
||||||||||||||
|---|---|---|---|---|---|---|---|---|---|---|---|---|---|---|
| @TPP | a | b | c | d | e | f | g | h | i | j | k | l | m | n |
| 22%1 | 1.4 | –1.8 and 1.3 | –2.3 and 0.7 | – | – | – | – | – | – | – | – | – | – | – |
| 20%2 | 1.9 | –1.2 | –1.7 and 1.4 | 0.1 | – | – | – | – | – | – | – | – | – | – |
| 20%3 | 1.5 | –1.4 | –1.8 and 1.3 | –1.4 | –0.2 | –3.7 | –0.1 | –2.5 | –0.1 | – | – | – | – | – |
| 12%4 | –6.7 | –4.4 | –5.6 | –4.8 | –5.3 | –4.6 | –6.9 | –6.8 | –4.8 | –6.4 | –7.1 | –5.2 | –5.3 | 1 |
In the 13C NMR spectra of the inclusion compounds, the signals of the numerous aromatic carbon atoms contained in the rod guest molecules cannot be separated and assigned individually, in part because they also overlap with the central peak of TPP, and the signals of the acetylenic carbons are not well resolved. Useful information can be obtained from the signals of the carbons of the bicyclo[1.1.1]pentane cage, of the TMS end group, and of the tert-butyl or n-hexyl end groups.
The spectrum of neat 1 (Figure 4B) contains a single resonance at 58.4 ppm for the three equivalent bicyclo[1.1.1]pentane bridge carbons, another at 30.0 ppm for the two bridgehead carbons, and a third one at 0.0 ppm for the three equivalent TMS methyl carbons. The peaks are at nearly the same position as in the solution spectrum (Figure 4C), except that the peaks of the two inequivalent bridgehead carbons are resolved in the latter (29.6 and 30.8 ppm).
Figure 4.
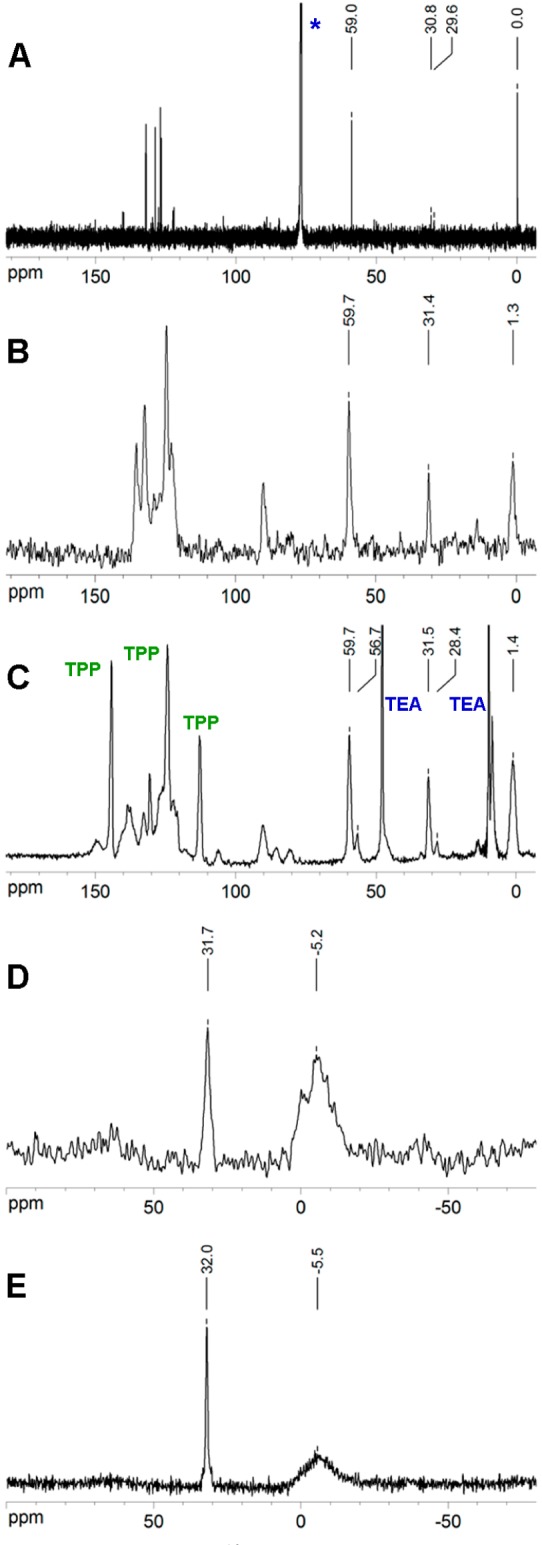
(A) 113C NMR in CDCl3 (*) solution, (B) neat 113C NMR, (C) 22%1@TPPd12 CP MAS 13C NMR, (D) 22%1@TPP-d1231P CP MAS NMR, and (E) 22%1@TPP-d1231P SPE NMR.
In the 13C NMR CP MAS spectrum of the inclusion compound 22%1@TPP-d12 (Figure 4C), both resonances characteristic of the bicyclo[1.1.1]pentane cage are split and appear as doublets consisting of a strong peak located at the position of the solution peak and a weak peak shifted upfield. The relative intensities are 83% (59.0 and 30.8 ppm) and 17% (56.1 and 27.8 ppm). The broad signal of the three equivalent carbon atoms in the trimethylsilyl group is shifted to 0.8 ppm. The deuteriated TPP was contaminated by a small amount of triethylamine hydrochloride (two peaks in Figure 4C marked TEA), which was formed as a side product during the synthesis and had been incompletely removed.
The solid state 13C CP MAS NMR spectrum of 20%2@TPP-d12 shows a pattern for the rod peaks similar to the solution 13C NMR spectrum, but each peak is shifted upfield or downfield (Figure S1 of the Supporting Information). The signals of the carbons of the terminal t-butyl group appear at 28.9 and 78.8 ppm in solution. In TPP, its methyl resonance is upfield shifted to 28.4, and its quaternary carbon is hidden under the signals of triple bonds. The bicyclo[1.1.1]pentane moiety present in the shaft of 2 has three characteristic signals in the solution 13C NMR spectrum, at 30.6, 30.8, and 59.0 ppm. In the solid state 13C CP MAS NMR spectrum one well defined peak appears at 31.93 ppm, while the second one seems to be present at 30.56 ppm as a shoulder on the 28.4 ppm peak that is due to methyl carbons of the t-butyl group. The third characteristic peak of the bicyclo[1.1.1]pentane moiety is doubled and appears at 57.2 and 60.4 ppm. The carbon atoms of the trimethylsilyl unit yield a resonance at 1.8 ppm in the solid state, shifted downfield from 0.0 ppm in solution NMR.
In the solid state 13C CP MAS NMR spectrum of 20%3@TPP-d12 (Figure S2 of the Supporting Information), five of the six peaks expected for the n-hexyloxy terminal substituent are visible at 13.9, 20.1, 25.5, 31.5, and 66.6 ppm. Compared with the six distinct resonances in the solution NMR at 14.0, 22.6, 25.7, 29.3, 31.6, and 68.1 ppm, they are shifted upfield. The missing resonance is probably overlapped with the one at 25.5 ppm. The bridge carbon atoms of the bicyclo[1.1.1]pentane moiety appear at 57.1 and 60.3 ppm in the 13C CP MAS NMR spectrum of the inclusion and at 59.1 ppm in the solution NMR spectrum. The bridgehead carbon atoms have two distinct signals in solution NMR, at 30.6 and 30.8 ppm, but in the 13C CP MAS NMR spectrum of the inclusion, they appear as a single resonance at 29.3 ppm. The trimethylsilyl carbon atoms appear at 0.8 ppm in the 13C CP MAS NMR spectrum of the inclusion and at 0.0 ppm in solution.
A partial assignment of several carbons was possible for 4 (Figure 5). The solution 13C APT NMR spectrum consists of six well resolved carbon signals in the aliphatic region and eight signals belonging to aromatic rings. Four aromatic quaternary carbons in 4 give rise to two peaks in the 13C ssNMR spectrum of the neat material, while the remaining four aromatic CH carbons give rise to one signal. The aliphatic carbons are well resolved both in the solution 13C NMR and 13C CP MAS ssNMR spectra. The 13C NMR CP MAS spectrum of the inclusion compound 12%4@TPP-d12 (Figure 5C) displays four broad singlets (one is partially overlapped with one of the three signals of TPP) in the aromatic and five singlets in the aliphatic region. All carbon signals of 4 are upfield shifted (Table 1), implying successful formation of a host–guest inclusion.
Figure 5.
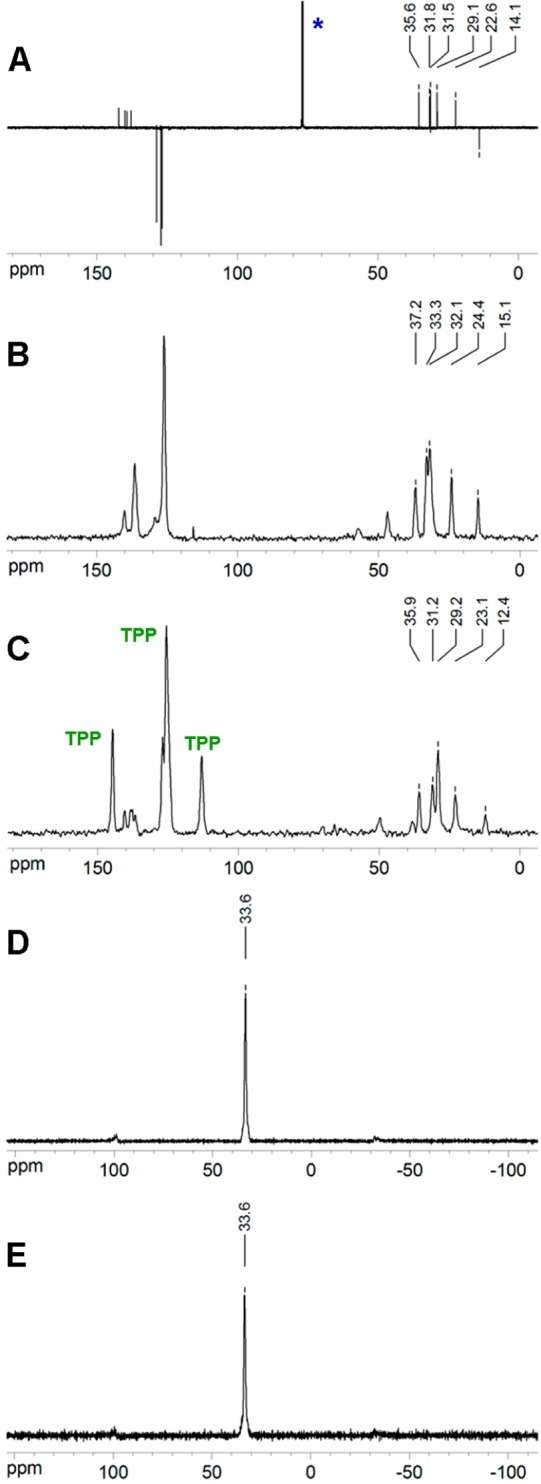
(A) 413C APT NMR in CDCl3 (*) solution, (B) neat 413C NMR, (C) 12%4@TPPd12 CP MAS 13C NMR, (D) 12%4@TPP-d1231P CP MAS NMR, and (E) 12%4@TPP-d1231P SPE NMR.
The solution 13C NMR spectrum of 5 consists of eight resolved peaks, which correspond to three broad signals with chemical shifts of 127.3, 130.7, and 138.4 ppm in the ssNMR of the neat sample. In the solid state 13C CP MAS NMR spectrum, the peaks at 127.3 and 130.7 ppm are partially overlapped with one of the three signals of TPP. The peak at 138.1 ppm is nearly at the same position as in the neat sample (138.4 ppm). The 31P CP MAS NMR spectrum did not contain any signals, demonstrating the absence of magnetization transfer from 5 to TPP. The 31P SPE NMR spectrum revealed the presence of both hexagonal and monoclinic forms of TPP (Figure 6).
Figure 6.
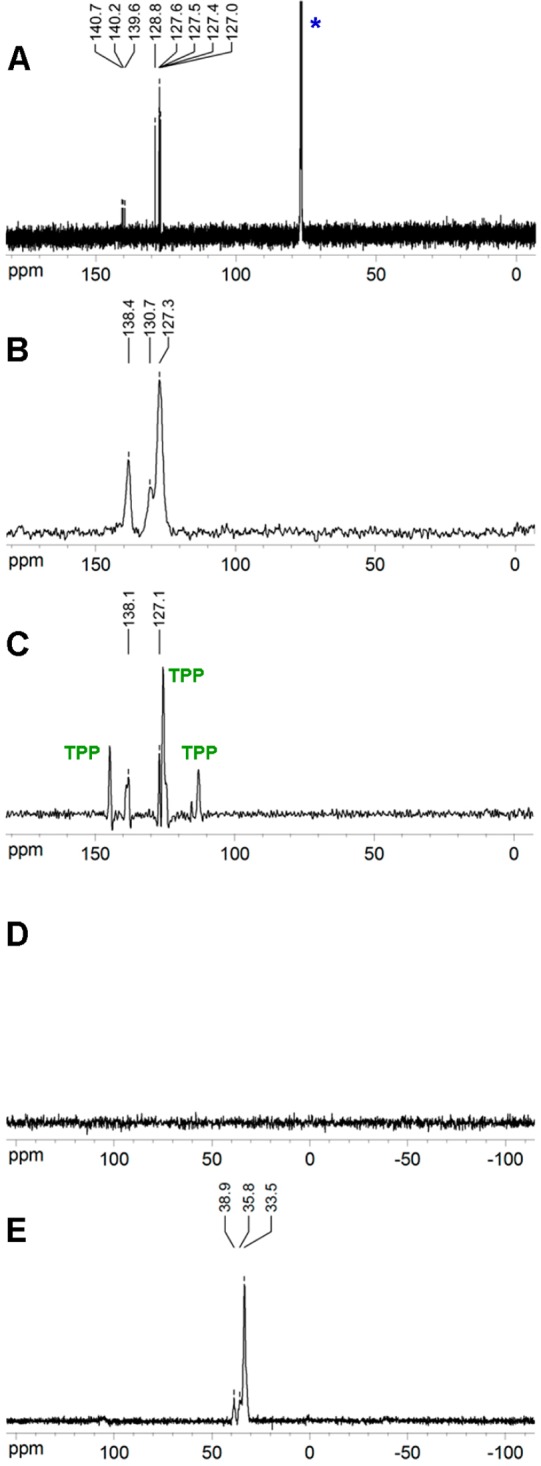
(A) 513C NMR in CDCl3 (*) solution, (B) neat 513C NMR, (C) attempted 20%5@TPP-d12 CP MAS 13C NMR, (D) 31P CP MAS NMR, and (E) 31P SPE NMR.
Optical Spectroscopy of Inclusion Compounds
The photophysics of inclusion compounds of the molecular rods 1–4 with TPP was examined in aqueous colloidal suspensions. No depolarization of light transmitted through these suspensions was detected, and light extinction by crossed polarizers in the whole transparent UV–vis region was identical with and without the colloidal suspensions located between them (Figure S3 in Supporting Information). Emission and excitation spectra, steady state and time-resolved excitation and fluorescence anisotropy, and fluorescence decay were collected as a function of guest loading from 0.02 to 20 mol %.
Table 2 summarizes the absorption and emission properties of the isolated molecules 1–5 in fluid (298 K) and glassy (77 K) 2-methyltetrahydrofuran (2-MeTHF) solutions. They were essentially identical whether the sample was degassed or not. Results for 5 were reported before,32−35 and our values agree.
Table 2. Absorption and Emission of 1–5 in Solution at Room Temperature and 77 K.
| absorption | fluorescence |
|||||
|---|---|---|---|---|---|---|
| cmpd | solvent | ν̃max (103 cm–1) [εmax (dm3 mol–1 cm–1)] | ν̃max (103 cm–1) | ΦFa | τFb (ns) | Δν̃c (cm–1) |
| 1 | CH2Cl2, RT | 30.6 (84500) | 26.7, 25.5 | 0.85 | 0.76 | 3900 |
| 2-MeTHF, RT | 30.7 (86300) | 26.9 | 0.80 | 0.60 | 3700 | |
| 2-MeTHF, 77 K | 29.2, 36.0 | 26.9, 25.6 | – | 0.60 | 890 | |
| 2 | CH2Cl2, RT | 30.3 (75800) | 25.0 | 0.89 | 0.82 | 5300 |
| 2-MeTHF, RT | 30.4 (81800) | 25.5 | 0.87 | 0.68 | 4900 | |
| 2-MeTHF, 77 K | 29.2, 27.7 | 26.8, 25.4 | – | 0.60 | 890 | |
| 3 | CH2Cl2, RT | 30.1 (75000 ± 15000)d | 24.9 | 0.85 | 0.84 | 5200 |
| 2-MeTHF, RT | 30.2 (76600) | 25.3 | 0.90 | 0.69 | 4890 | |
| 2-MeTHF, 77 K | 28.8, 27.2 | 26.3, 25.0 | – | 0.62 | 930 | |
| 4 | 2-MeTHF, RT | 33.1 (52126) | 27.8, 26.6 | 0.88 | 0.60 | 5260 |
| 2-MeTHF, 77 K | 31.7 | 28.3, 27.1 | – | – | 3400 | |
| 5 | 2-MeTHF, RT | 33.5 (45180) | 28.3, 27.0 | 0.95 | 0.76 | 6530 |
| 2-MeTHF, 77 K | 32.2 | 28.8, 27.5 | – | 0.76 | 3330 | |
| cyclohexane, RT | 34.0 (41400, 40800e) | 28.5, 27.2 | 0.95 | 0.77 | 5520 | |
| 0.89e | 0.80f | |||||
| 0.92f | 0.85g | |||||
| 0.81g | 0.84h | |||||
The solution and suspension absorption and fluorescence excitation spectra of 1–4 are shown in Figure 7 and the fluorescence spectra in Figure 8. All five compounds have a strong and broad absorption band in the near UV and emit intense (ΦF = 0.8–0.95) short-lived (τF = 0.6–0.8 ns) fluorescence at the edge of the visible region, well removed from the absorption region of the TPP host (ν̃ > 34500 cm–1). The high absorption coefficients of 1–3, approximately twice those of 4 and 5, permitted us to investigate the fluorescence of highly dilute inclusion compounds.
Figure 7.
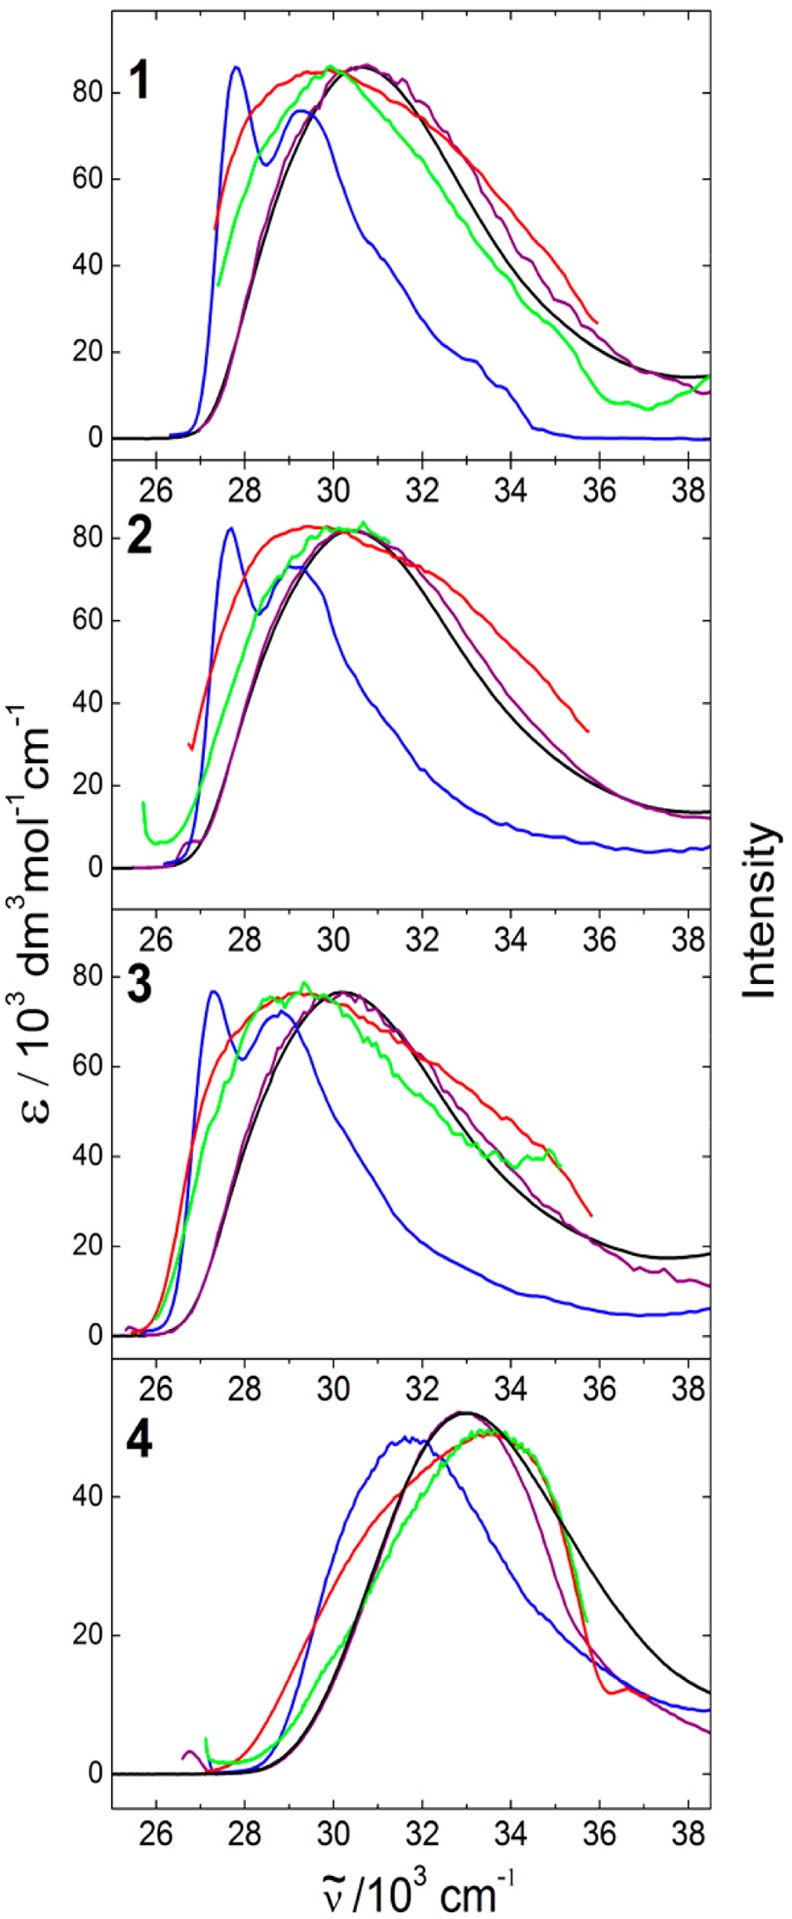
Spectra of 1–4. Solution in 2-MeTHF: absorption (black) and normalized fluorescence excitation at RT (purple) and 77 K (blue). Inclusion in TPP in aqueous suspension: 2%@TPP (red) and 0.02%@TPP (green).
Figure 8.
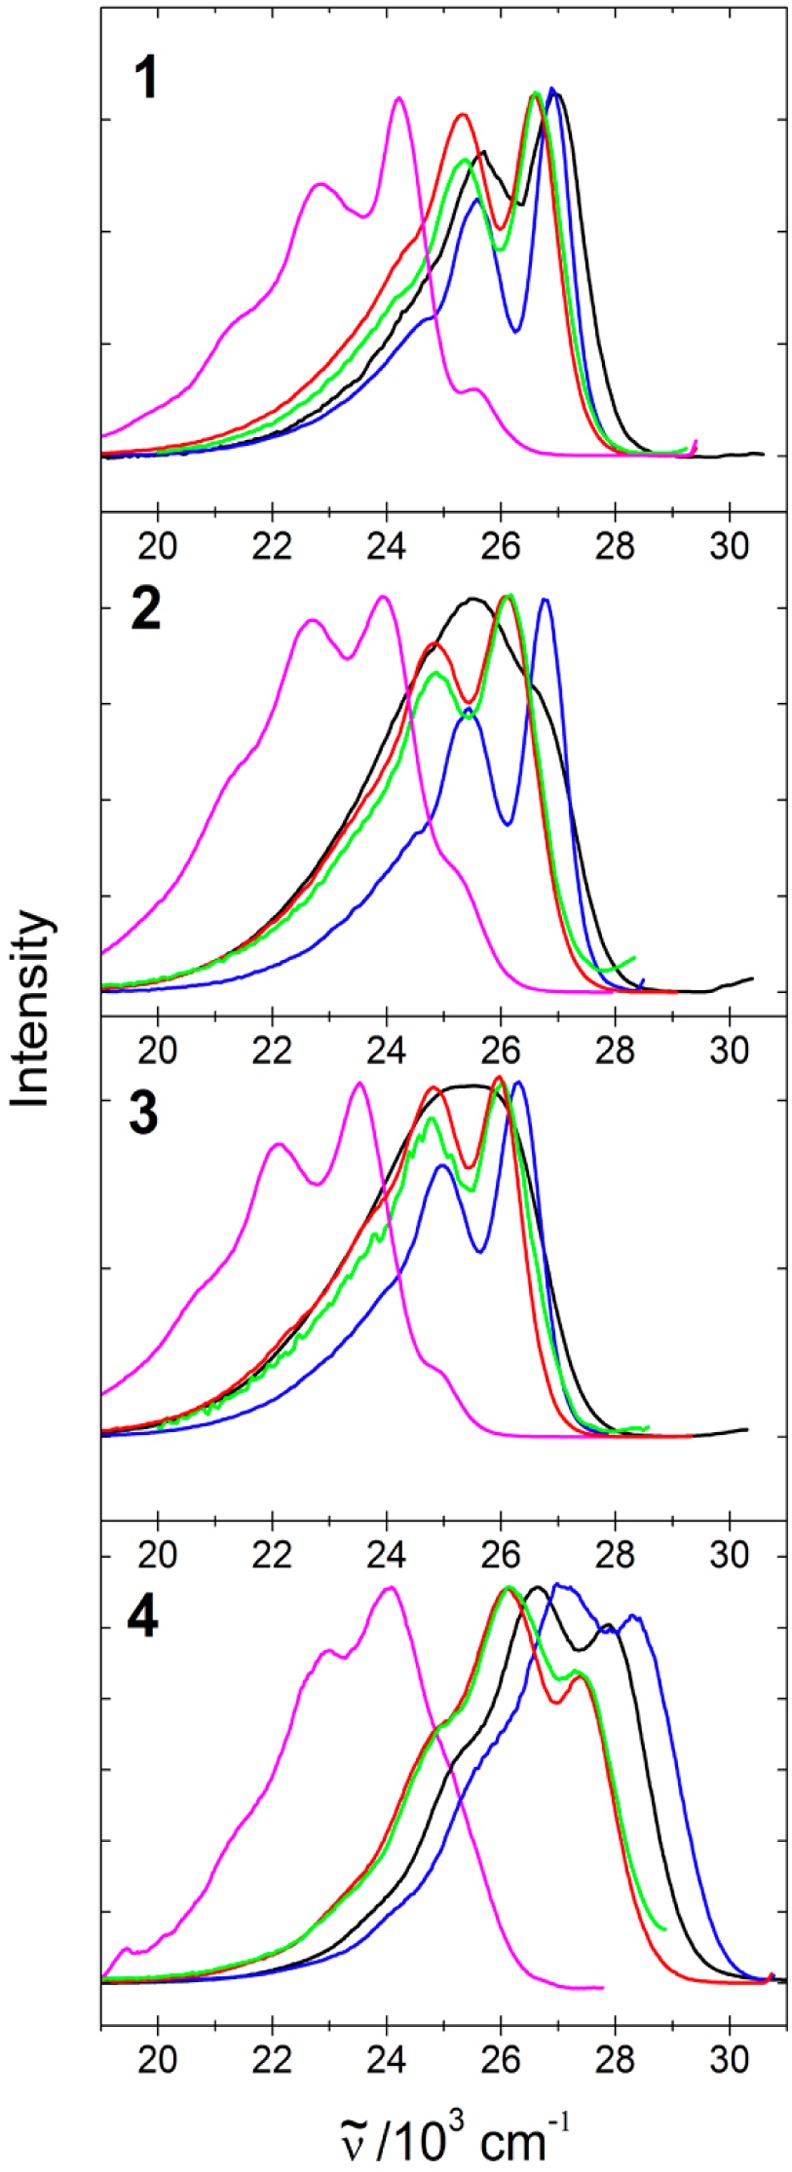
Normalized fluorescence spectra of 1–4. Solution 2-MeTHF at RT (black) and 77 K (blue). Aqueous suspension of neat crystallites (magenta) and of inclusions in TPP: 2%@TPP (red) and 0.02%@TPP (green).
Spectral characteristics of aqueous suspensions of powdered neat solid compounds 1–4 and of the milled and annealed powdered TPP inclusion compounds 1@TPP–4@TPP are summarized in Table 3 (cf. Figures 7 and 8). In fluorescence measurements, care was taken to use excitation wavelengths that did not excite hexagonal TPP itself (absorption onset at ∼34500 and maximum at 36900 cm–1). The emission of neat TPP is shown in Figure S2 of the Supporting Information. It has a maximum at 32800 cm–1 and did not contribute at the guest emission wavelengths.
Table 3. Absorption and Emission Characteristics of Aqueous Suspensions of Nanocrystals of Neat and TPP-Included 1–4a.
| absorption | fluorescence |
||||
|---|---|---|---|---|---|
| cmpd | ν̃max (103 cm–1) | ν̃max (103 cm–1) | ΦFb | τF (nsc) | Δν̃ (cm–1) |
| neat 1 | 33.7–36.6 | 25.5, 24.2, 22.8, 21.4(s) | – | – | |
| 2%1@TPP | 29.7 | 26.6, 25.3, 24.3(s) | 0.8 | 0.43 | 3070 |
| 0.02%1@TPP | 29.9 | 26.6, 25.4, 24.1(s) | 0.7 | 0.55 | 3340 |
| neat 2 | ∼34.6 | 25.2(s), 23.9, 22.7, 21.5(s) | – | – | |
| 2%2@TPP | 29.4 | 26.1, 24.9 | 0.9 | 0.58 | 3300 |
| 0.02%2@TPP | 30.1 | 26.1, 24.9 | 0.8 | 0.50 | 3300 |
| neat 3 | 33.2–41.5 | 24.9(s), 23.5, 22.1, 20.8(s) | – | – | |
| 2%3@TPP | 29.2 | 25.9, 24.8, 23.8(s) | 0.9 | 0.55 | 3200 |
| 0.02%3@TPP | 29.3 | 26.0, 24.7, 23.8(s) | 0.9 | 0.52 | 3200 |
| neat 4 | 33.5–35.6 | 24.0, 23.0 | – | – | |
| 2%4@TPP | 33.5 | 26.1, 27.4, 24.9(s) | 0.8 | 0.76 | 6200 |
| 0.02%4@TPP | 33.5 | 26.1, 27.4, 24.9(s) | 0.7 | 0.75 | 6200 |
Bold: emission maximum.
The estimated error in ΦF is large, ± 0.2, due to difficulties in determining exact absorbance values.
The estimated error in the lifetime τF is ±0.05 ns.
The excitation spectra of included 1–4 are narrower than those of pure compounds in solution because of the inner filter effect of TPP. The absorption and emission spectra of the TPP inclusion compounds are independent of the degree of loading. The emission covers the same spectral region in suspension and room temperature solution spectra, but the former are more structured. The suspension emission spectra of the neat compounds are red-shifted. The fluorescence lifetimes of the included molecules are slightly shorter than their solution lifetimes. The quantum yields ΦF of the inclusion compounds are similar to those of isolated molecules in solution.
Fluorescence Anisotropy
Steady state fluorescence excitation anisotropy spectra of the isolated molecules in solution and of the inclusion and neat compounds in aqueous suspension are shown in Figure 9 and Table 4. The emission anisotropy of samples 1–4 is constant throughout the emission band (excited at 28500 cm–1). In the case of 5@TPP, the anisotropy increases slightly as the excitation energy is reduced. The time-resolved and steady-state anisotropy values agree, and the steady-state value observed in fluid solution fits expectations based on the time-resolved value and the observed lifetime.
Figure 9.
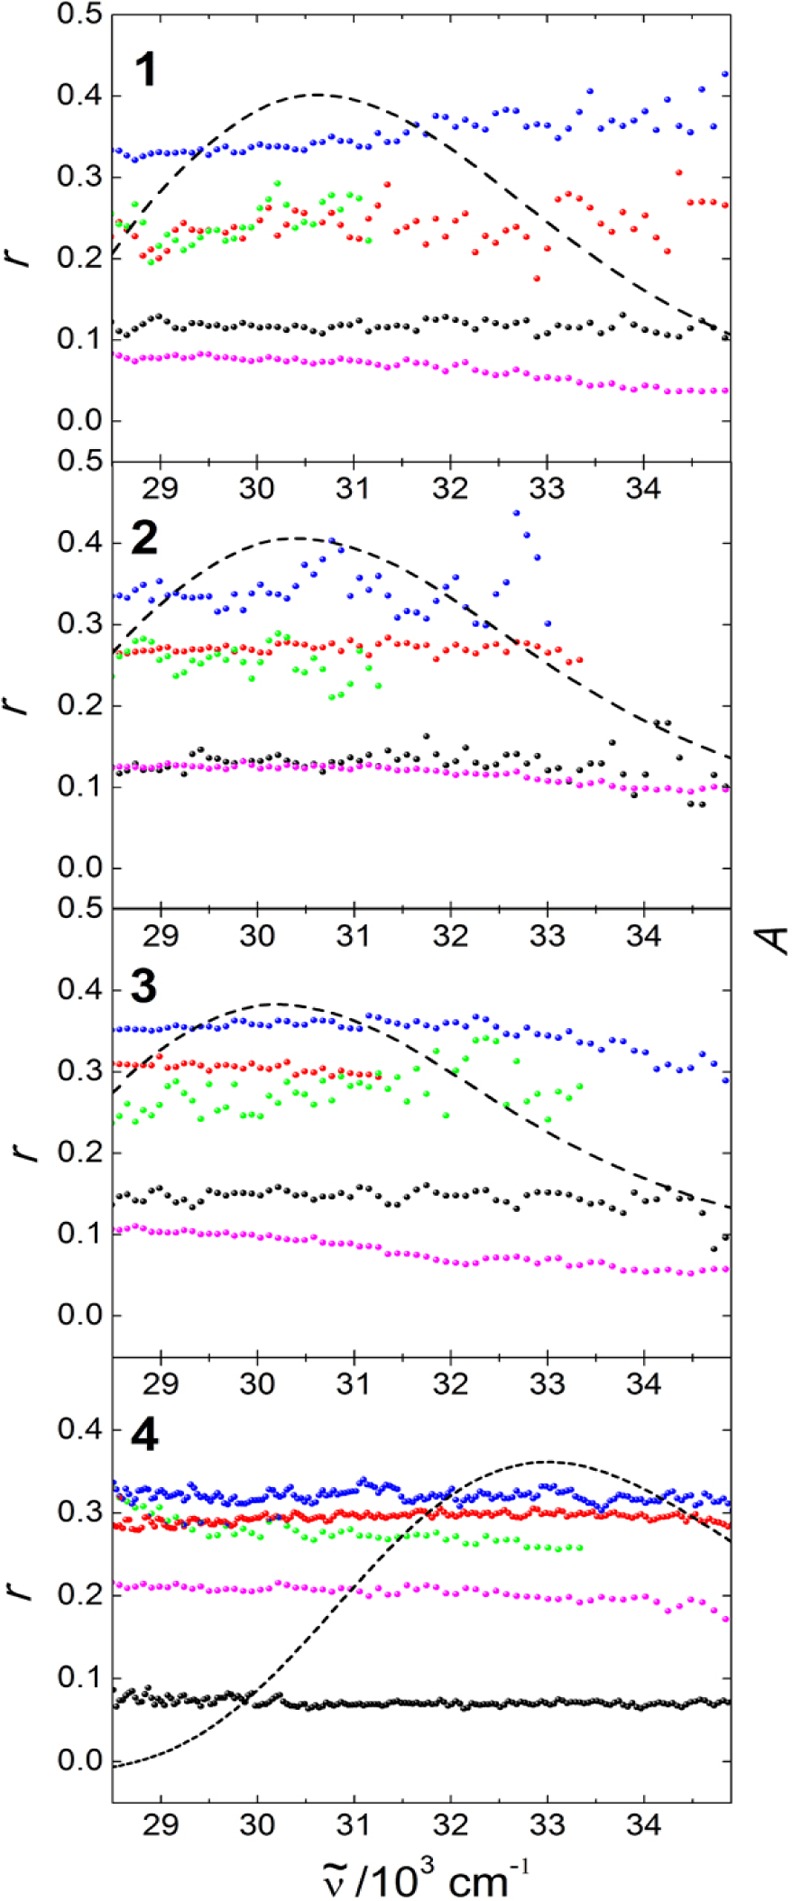
Steady state fluorescence excitation anisotropy of 1–4 in solution in 2-MeTHF at RT (black) and 77 K (blue), and in aqueous suspension of neat crystallites (magenta) and of inclusions in TPP: 2%@TPP (red) and 0.02%@TPP (green). Emission frequencies monitored are listed in Table 4. Dashed black lines show the absorption spectra in 2-MeTHF at RT.
Table 4. Steady-State and Time-Resolved Fluorescence Anisotropy in Aqueous Suspension Compared with Fluid and Glassy 2-MeTHF Solutions.
| cmpd | ra (ν̃em /103 cm–1) | r0b (ν̃em /103 cm–1) | θc (ns) |
|---|---|---|---|
| 1 (neat) | 0.08 (24.2) | – | – |
| 1 (2-MeTHF, RT)d | 0.12 (26.9) | 0.34 (25.3) | 0.64 |
| 2%1@TPP | 0.26 (26.6) | 0.40 (26.6) | ∞ |
| 0.02%1@TPP | 0.25 (26.6) | 0.30 (26.7) | ∞ |
| 1 (2-MeTHF, 77 K)e | 0.34 (25.6) | 0.34 (26.9) | ∞ |
| 2 (neat) | 0.13 (24.0) | – | – |
| 2 (2-MeTHF, RT)d | 0.13 (25.5) | 0.36 (25.4) | 0.46 |
| 2%2@TPP | 0.27 (26.1) | 0.30 (26.1) | ∞ |
| 0.02%2@TPP | 0.27 (26.1) | 0.23e (26.1) | ∞ |
| 2 (2-MeTHF, 77 K)e | 0.34 (25.4) | 0.34 (26.8) | ∞ |
| 3 (neat) | 0.10 (23.5) | – | – |
| 3 (2-MeTHF, RT)d | 0.15 (25.2) | 0.34 (25.3) | 0.69 |
| 2%3@TPP | 0.31 (26.0) | 0.30 (25.9) | ∞ |
| 0.02%3@TPP | 0.25f (26.0) | 0.40 (26.0) | ∞ |
| 3 (2-MeTHF, 77 K)e | 0.34 (25.0) | 0.39 (26.3) | ∞ |
| 4 (neat) | 0.21(24.0) | – | – |
| 4 (2-MeTHF, RT)d | 0.08 (26.6) | 0.34 (26.6) | 0.29 |
| 2%4@TPP | 0.29 (25.8) | 0.26 (26.1) | ∞ |
| 0.02%4@TPP | 0.27 (25.8) | 0.30 (26.1) | ∞ |
| 4 (2-MeTHF, 77 K)e | 0.32 (30.7) | 0.38 (30.7) | ∞ |
| 5 (2-MeTHF, RT)d | 0.02 (27.0) | 0.34 (27.2) | 0.15 |
| 5 (2-MeTHF, 77 K)e | 0.39 (27.5) | 0.37 (27.6) | ∞ |
Steady-state anisotropy r at ν̃em with an estimated error of ±0.02.
Time-resolved anisotropy at ν̃em extrapolated to t = 0. Estimated error is ±0.05
Rotational correlation time θ, with an estimated error of ±50 ps.
Fluid.
Glassy.
The estimated error is ±0.1.
Steady-state anisotropy values r0 at νexc = 29400–28600 cm–1 measured in a rigid glass at 77 K are summarized in Table 4, and they are all close to the ideal value of 0.4 expected for parallel absorbing and emitting transition dipole moments. In room-temperature fluid solution, the values are close to 0.1 and in an aqueous suspension of the TPP inclusion compounds, they are ∼0.26. The included molecular rods 1–4 do not show concentration depolarization in the loading range from 2% to 0.02%.
As shown in Figure 10, in fluid solution 1–4 show a single-exponential anisotropy decay with a rotational correlation time θ comparable to the fluorescence lifetime. In the inclusion compounds and in a frozen glass, the anisotropy does not decay detectably within the fluorescence lifetime. The suspensions of the neat compounds were not stable under irradiation and precipitated within a few seconds. Their r0 values were not determined.
Figure 10.
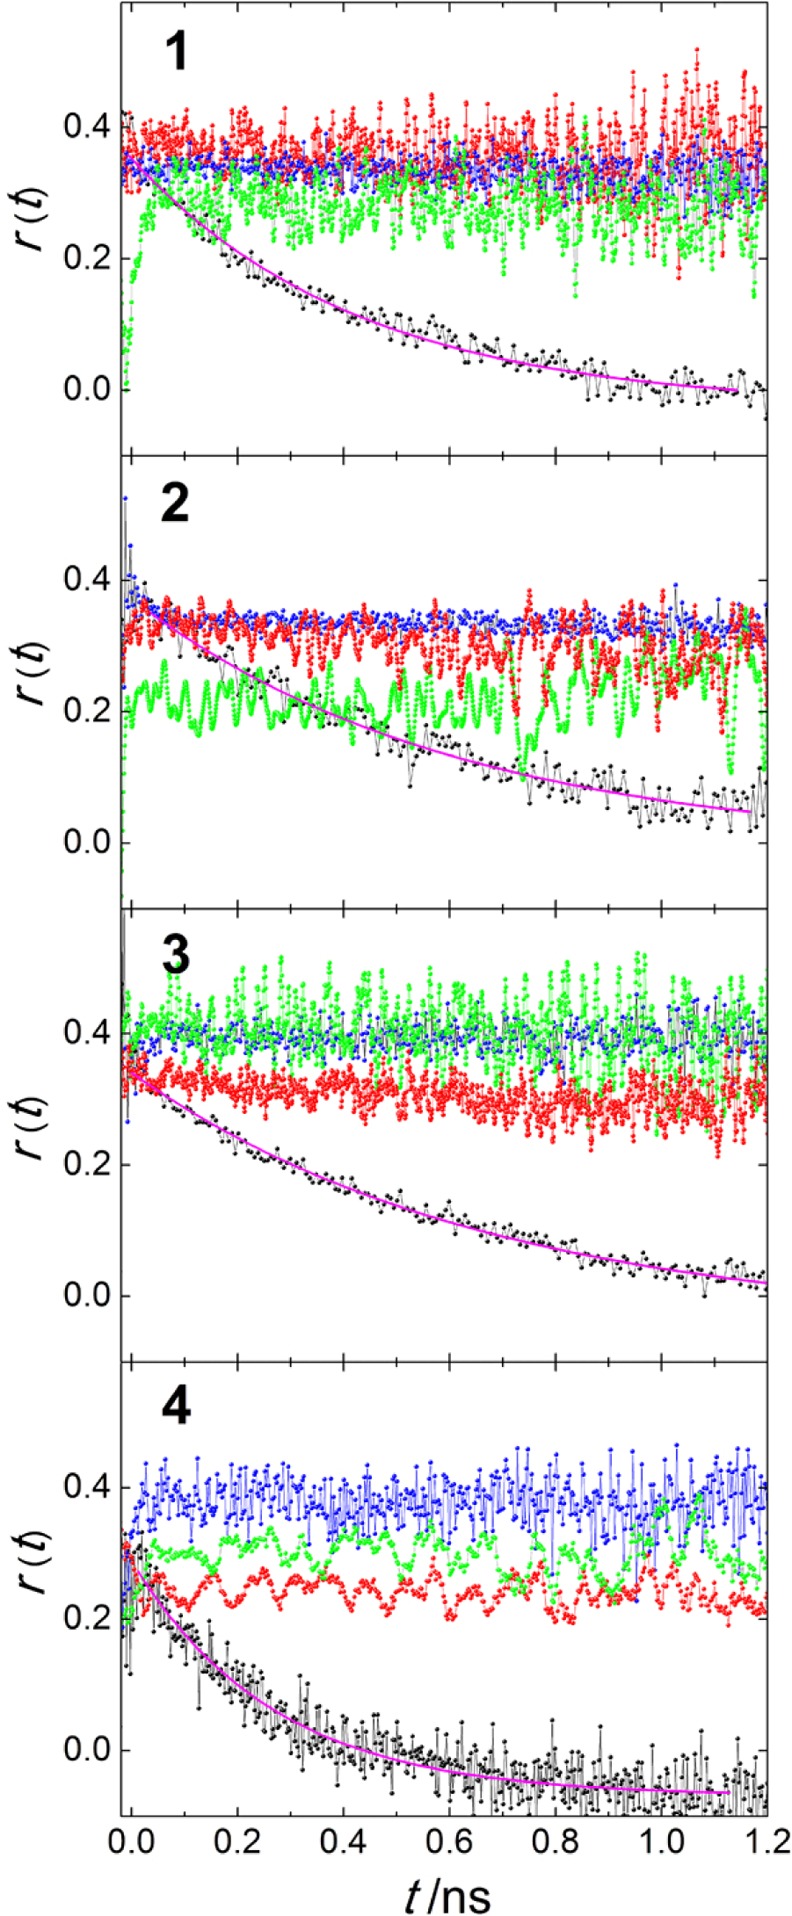
Time-resolved fluorescence anisotropy decay of 1–4 in solution in 2-MeTHF at RT (black) and 77 K (blue) and in TPP inclusions in aqueous suspension: 2%@TPP (red) and 0.02%@TPP (green).
Discussion
Synthesis
The syntheses were designed with the anticipated negligible solubility of the final products 1–4 in mind. The approach is based on the preparation of two molecular fragments that are well soluble in common organic solvents (the bicyclo[1.1.1]pentane derivative 6 and alkynes 7–9, and the iodo derivative 15 and biphenyl derivative 16) and whose combination produces an almost insoluble product. Two different solubilizing groups (t-BuO and n-HexO) were introduced at the terminal position of the rod 1, but the solubility of 2 and 3 was only marginally higher than that of 1. Poor solubility of all final products paradoxically simplifies their separation and purification because all products precipitate from the crude reaction mixture after the final cross-coupling reaction. They are easily filtered, and after washing with several solvents and drying yield analytically pure samples.
Sample Structure
The structure and host properties of hexagonal TPP are well understood.36−38 The crystals consist of molecular layers, each of which contains triangular openings located ∼1.1 nm apart in a triangular lattice. In neighboring layers, their centers are lined up, but the triangles are rotated by 60° such that approximately hexagonal channels perpendicular to the layers result (Figure 1). In small crystallites, the plane of the layers forms the dominant crystal facet. The channels accept small molecules eagerly,22 and detailed dynamic NMR and EPR studies of the motion of oligothiophenes included in TPP inclusion have been reported.23
Our XRD powder patterns clearly show that 1–4 form hexagonal inclusion compounds with different hexagonal lattice spacings. The absence of measurable monoclinic TPP fractions indicates that the mole fractions of ∼20% for the inclusions of 1–3 and ∼12% for the inclusion of 4 fully involve the available TPP in formation of the hexagonal compound. Indeed, molecular modeling (exemplified in Figure 11) indicates that the fully included rod molecule 1 is expected to occupy no more than 8 to 9 TPP layers, and the longer derivatives 2–4, a little more. Therefore, molar ratios between 12% and 16% should lead to full loading of the channels in TPP. Interestingly, the absence of unexplained peaks in the XRD suggests that the full 20% molar fraction is included in the TPP, more than should fit into a bulk structure. One can conclude that these are predominantly surface inclusions, where the guest molecules mostly reside near the surface of the TPP crystallites, with parts extending somewhat beyond the surface. Finally, we note that there is no evidence for long lattice periods appropriate for the full length of the molecular rods. Therefore, the rod insertion appears to result in more or less random positions of the rods along the TPP channels.
Figure 11.
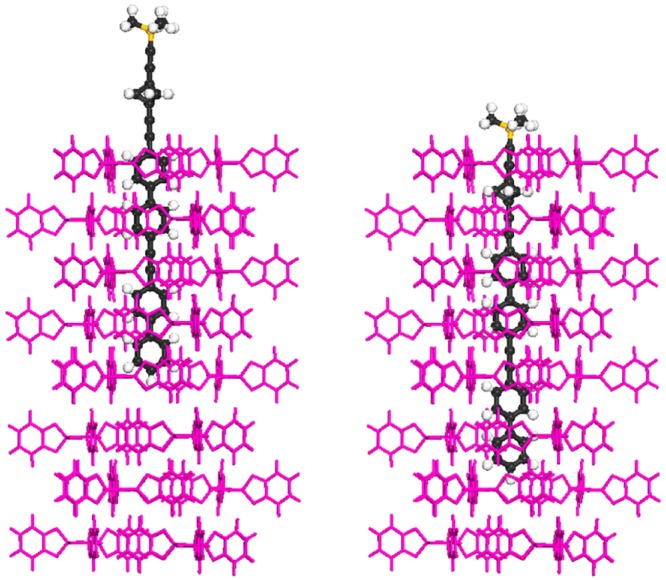
Proposed structure of 1@TPP. The location of 4/5 of the guest molecules (left). The location of 1/5 of the guest molecules (right).
Unlike the solid-state CP MAS 13C NMR spectrum of empty TPP-d12 that is essentially devoid of all signals, those of the inclusion compounds contain three singlet resonances at 145.1, 126.0, and 113.5 ppm that are characteristic of TPP in its hexagonal form.18 The first conclusion from the NMR results thus is a confirmation of the presence of proton-carrying guest molecules in the TPP channels. In agreement with the XRD data, the 31P CP MAS NMR and 31P SPE spectra of the inclusions of rods 1–4, we observe only the peaks characteristic of hexagonal TPP. This indicates that the rotor loading was optimal and prevented the decay of excess hexagonal TPP into its monoclinic form.
The structural conclusions reached so far are sufficient for the purposes of our optical study, but the NMR data also provide some interesting additional hints. The peaks observed in the cage carbon region of 1@TPP-d12 are doubled, and in addition to the unshifted peaks at 59.0 and 30.8 ppm, which carry about 4/5 of the intensity, they contain upfield shifted peaks at 56.1 and 27.8 ppm, which carry the remaining 1/5 of the intensity. It thus appears that one out of five bicyclo[1.1.1]pentane cages is inserted deeper inside the TPP channel than the other four (Figure 11). The XRD results are not compatible with the presence of a crystalline phase composed of neat 1. We consider it highly unlikely that neat 1 could be present as an amorphous phase, invisible in XRD, and believe that the presence of a surface inclusion provides a plausible explanation of the 4:1 ratio of partially unincluded versus more fully included rods 1. If only every fifth rod is inserted sufficiently for the bicyclo[1.1.1]pentane cage to lie inside the channel, with only the alkynyltrimethylsilyl group possibly outside, while the remaining four have only their aromatic tails inserted inside TPP, with the cage located outside (Figure 11), the NMR result will be accounted for. Unfortunately, the signals of the TMS carbon atoms do not provide much additional information. Their broad signal is shifted downfield to 1.4 ppm, which is compatible with the notion that the TMS groups are all located outside the channel, but we know from other work21 that the TMS group is not a good marker for detecting insertion inside a channel. Even if it is included, the chemical shifts of its methyl carbons sometimes undergo hardly any change relative to solution.
In our experience, surface inclusions normally announce themselves via an unusually small particle size. Bulk inclusions seem to produce lower strain and lead to larger crystals. The very small size of the nanocrystals of 1@TPP-d12 thus fits well with the proposal that the inclusion of 1 in TPP is primarily a surface inclusion.
In the 13C CP MAS NMR spectra of 2@TPP-d12 and 20%3@TPP-d12, all the 13C signals of the alkyloxy groups are shifted slightly upfield. The bridge signals of the bicyclo[1.1.1]pentane cage are doubled in both cases. One of them is shifted slightly upfield, while the second one is shifted downfield. It appears that both compounds form analogous inclusions as shown in Figure 11, and the ratio between rods with bicyclo[1.1.1]pentane located outside and inside the TPP is ∼1:1 in both cases.
Upfield chemical shift of aliphatic carbon atoms in the 13C CP MAS NMR spectrum of solid 4@TPP-d12 in combination with the presence of a typical singlet in its 31P CP MAS NMR spectrum implies that 4 forms a bulk inclusion, with its molecules completely inserted inside the TPP channel.
Optical Properties
Having established from the ssNMR and XRD results that the chromophore parts of our rod-shaped guest molecules 1–4 are mostly or completely included in the channels of hexagonal TPP, with only the saturated parts possibly protruding outside the TPP crystal surface, we can turn to a discussion of their optical properties. Figure 2 suggests that the aqueous suspensions that have been studied contain conglomerates of nanoparticles in the shape of thin platelets some tens of nanometers across. The crystalline domain size deduced from XRD line width is of the same order of magnitude, making it very likely that these platelets are single crystalline. Their orientation within the conglomerate is random, and channel directions in different platelets are not correlated. Interplatelet energy transfer would thus be expected to cause fluorescence depolarization even if intraplatelet energy transfer does not.
For oligophenylenes, the optimal conformations are twisted about 30–35° about single bonds joining two aromatic rings in the ground state and are planar in the excited state.35,39 The strong first absorption band of quaterphenyl (5) and tolane (diphenylacetylene) has been long known to be long-axis polarized.35,40−44 Although a very weak short-axis polarized transition is present at similar energies, it is not detectable in absorption and appears to play no role in fluorescence. One can expect a similar behavior for both absorption and fluorescence of isolated molecules of 1–5. Indeed, given the very high fluorescence quantum yield, the short fluorescence lifetime, and a fluorescence anisotropy in a rigid glass within experimental error of 0.4, we are confident that the observed absorption and emission are due to long-axis polarized transitions.
There are several reasons for expecting the spectra of 1–4 included in TPP to differ from their spectra in dilute solution in an inert solvent. First, inside the channels of TPP, the aromatic rings of 1–4 need not be free to twist easily around the long molecular axis and adopt the conformations that are best for the isolated molecules, neither in the ground nor in the excited state, and this can be expected to affect the shapes and to some degree also the positions of absorption and emission bands. Second, solute molecules are much more likely to find themselves close to each other within the host channels in a colloidal solution of a TPP inclusion compound than they are in a homogeneous solution at the same nominal concentration. Given how tight their fit into the channel is, end-to-end contacts are the only probable kind. π-Stacking is excluded and J-aggregate-like behavior is to be expected. The spectral consequences of the proximity could thus be quite different from those encountered in a neat crystal, and they should be strongly suppressed by the insertion of insulating alkyl chains between the neighboring chromophores in a packed channel, as in 1–4. Third, the index of refraction of TPP exceeds that of alkane solvents, and the radiative lifetime of the included solutes should be shorter.
Our observations are in general agreement with these expectations. The Stokes shifts are similar in solution and in TPP inclusion, with the fluorescence more structured than absorption, suggesting that there is not much difference in the degree to which the excited state can relax toward planarity in the inclusion and in solution. In 1–4, fluorescence appears at nearly the same location in solution and in TPP inclusions regardless of the degree of loading, since the chromophores are kept apart within a channel by the terminal chains even at high loading. In contrast, in neat crystals of the chromophore, fluorescence is red-shifted by 2000–4000 cm–1. As expected, radiative lifetimes are shorter in the TPP inclusions than in liquid solution.
The anisotropy of solute fluorescence must also be expected to be quite different in homogeneous solution and in the colloidal solution of TPP particles containing the included guests 1–4. The observation that the suspension does not detectably depolarize linearly polarized light provides a firm basis for the measurement of anisotropy and is the first important result of this study. Figure 2 makes it clear that the size of the conglomerates and even the size of the individual nanoplatelets is such that no significant Brownian rotation in room-temperature aqueous suspension would be expected on the nanoseconds fluorescence timescale. In the absence of interplatelet energy transfer, fluorescence anisotropy measurement would therefore appear to represent a suitable tool for the study of internal mobility of the long axes of the guests within TPP channels.
In a frozen glass, 1–5 exhibit a degree of anisotropy nearly equal to the value of 0.4 at all excitation wavelengths and at all times, as expected from theory for parallel absorbing and emitting transition moments in the absence of rotational depolarization. They are relatively long rods, and it is not surprising that even in room-temperature solution their fluorescence is anisotropic, with quite long rotational correlation times. In TPP inclusion, fluorescence anisotropy is independent of time and excitation wavelength until TPP itself begins to absorb significantly relative to the guest, whereupon anisotropy drops toward zero. Not surprisingly, this effect is more noticeable at low loadings.
It is remarkable that in most cases, the fluorescence anisotropy from the included chromophores is only about 0.3, significantly lower than in the frozen glass. Within our time resolution, this lower value is reached instantaneously. It does not decay in time and is not strongly dependent on the degree of loading, suggesting that it is not primarily due to concentration depolarization. Such depolarization would require energy transfer from one to another nanoplatelet, and this is apparently slow. The fact that internanocrystal energy transfer does not compete with fluorescence, at least not for the presently used chromophores, makes fluorescence anisotropy measurements easily interpretable, and is the second important result of this study.
The lack of any time-dependence of fluorescence anisotropy observed on chromophores contained in the TPP channels demonstrates that the long axes of the rods are firmly clamped in place and do not wobble detectably on the nanosecond timescale. This third result is important for future studies of rotor motion in real time using rotators with emitting transition moments transverse to the rod axis, since interpretations of fluorescence anisotropy decay can then focus on the motion of the rotator alone.
It is interesting that the lowering of the fluorescence anisotropy value for molecules contained in TPP inclusions relative to molecules isolated in a frozen glass is constant in time. It therefore appears to be due to the static mixing of electronic states of the solute with those of the nearby TPP environment, which reduces the effective symmetry and tilts the absorbing and emitting transition moment from the long molecular axis in a way that may be coupled to the rotation of the aromatic rings during excited state relaxation. The distortion of the direction of weak transition moments by coupling to the solvent environment has been long known from studies of pyrene and its derivatives,45,46 but for 1–4 included in TPP, it appears to occur even for very strong transition moments. This is probably a result of their much stronger interaction with the TPP environment compared with the interaction of pyrene with a saturated hydrocarbon solvent.
Summary
We have found that colloidal solutions of milled TPP nanoparticles carrying included guest molecules are suitable for time-resolved fluorescence anisotropy studies. We further suggest that these solutions would be equally suitable for polarized transient absorption measurements. We have found that concentration depolarization is not a significant concern in measurements on these samples. A conclusion that is particularly important for future studies of rotation of dipolar rotators in real time and could not have been reached without the time-resolved measurements is that the long axis of 1–4 finds itself essentially immobile in the TPP channel.
A side product of our investigations is the realization that rodlike guest molecules may form surface inclusions with TPP, even if they do not contain a “stopper” that would limit the depth of their entry into the channel, and that the extent of their insertion is a very sensitive function of their structure.
Experimental Part
The solvents used for photophysical characterization were 2-methyltetrahydrofuran (2-MeTHF, Aldrich), cyclohexane (Aldrich), and dichloromethane (DCM, Aldrich). 2-MeTHF was distilled before use. All other solvents were spectral grade and were used without further purification. Milli-Q (18.2 MΩ) water were used for aqueous colloidal suspensions. Background emission of the solvents was always checked during fluorescence measurements. The fluorescence standard 9,10-diphenylanthracene (Fluka) was used as received.
Inclusion Compounds
These were prepared by milling TPP or TPP-d12 and a guest compound in a vial with a stainless steel disk.17 The vial was placed in a Vortex Genie 2 shaker (Scientific Industries), and the mixture was shaken at stage 3, vortex scale, for 2.5 h. The powder was scraped from the walls of the vial every 10 to 15 min in order to ensure proper mixing. The inclusion compound was annealed in the closed vial at 70 °C in an oven or an oil bath overnight.
Transmission Electron Microscopy
Samples were prepared by dropping the aqueous solution of 22%1@TPP onto a carbon-coated copper grid and drying in air. The images were recorded with a JEOL JEM-1011 transmission electron microscope operated at 60 kV.
X-ray Diffraction
X-ray powder patterns were taken with a system based on a Rigaku Ultrax18 rotating anode generator. It uses a curved silicon multilayer monochromator to produce Cu Kα radiation at wavelength λ = 1.5418 Å. Powder samples were first loaded into borosilicate glass capillaries with a 1.0 mm diameter and wall thickness of 10 μm and then mounted on a Huber four-circle goniometer. The scattered X-rays were measured by a sodium iodide scintillator point detector that was moved in a horizontal plane, by an angle 2θ with respect to the direction of the incident X-rays, to scan the Bragg scattering profile. The resolution of the instrument, in its usual configuration, is qres ≈ 0.003 Å–1.
UV–visible Absorption and Fluorescence
Room-temperature absorption spectra were recorded in a 1 cm path length Suprasil cell from 10–5 to 10–4 M concentrations using a Varian Cary 5000 spectrophotometer. Corrected fluorescence emission and excitation spectra were taken using a Jasco FP-6500 spectrofluorometer at an absorbance of 0.1–0.3 at λexc. Low-temperature luminescence measurements were performed at 77 K in 2-MeTHF glass, using a 0.85 × 0.85 cm Suprasil quartz cell in an optical quartz Dewar flask equipped with three Suprasil windows. The cell was immersed in liquid nitrogen and equilibrated for 5 min before measurement.
Fluorescence Quantum Yield
Fluorescence quantum yields ΦF were determined in degassed solution by measuring and comparing corrected areas under the spectra of the sample and the standard (9,10-diphenylanthracene in cyclohexane, Φst = 0.95 in degassed solution).47 Eq 1, which accounts for differences in the absorbance and the refractive index of the sample (As, ns) and the standard (Ast, nst) solutions, was used.
| 1 |
Sample concentrations were adjusted in order to keep the absorbance below 0.1. The accuracy of the resulting ΦF value is estimated at ±5%.
Aqueous Suspensions
Usually 1–2 mg of inclusion complex was used to produce 10 mL of suspension in water. Suspension was ultrasonicated for 30 s initially and then occasionally for short times (10 s) during longer measurements. Energy transfer from TPP to the included guest fluorophore was avoided by constraining the excitation to wavelengths at which only the guest absorbs. The concentration of the colloidal solution was kept as high as possible without inducing turbidity. At times, ultrasonication was used to improve the quality of the sample.
Steady-State Anisotropy
Steady-state fluorescence anisotropy measurements in solution at 298 and 77 K and in colloidal aqueous suspension at 298 K were collected using Jasco FP 6500 spectrofluorimeter equipped with two polarizers (accessory FDP-223). One polarizer was placed in front of the excitation source and the other one at the detector. Polarized emission and excitation spectra were measured at four configurations of polarizer transmission directions: both horizontal (HH), both vertical (VV), horizontal on excitation and vertical on emission (HV), and vice versa (VH). The anisotropy excitation spectra were calculated from eq 2,47
| 2 |
where the correction factor G was calculated from eq 3
| 3 |
Every spectrum collected at every different configuration was an average of five independent measurements. Typically, both the excitation and emission anisotropy spectra were collected in order to check the absence of dependence on emission wavelength. The effect of the emission wavelength on the excitation anisotropy spectrum was examined for 0.02%4@TPP in order to study the homogeneity of the sample and the intramolecular energy transfer.
Time-Resolved Fluorescence
Time-resolved fluorescence measurements used a time-correlated single photon counting fluorescence system. It consists of 150 fs pulsed Ti:sapphire laser with 75 MHz repetition rate, tunable from 700 to 980 nm, with a doubling unit that allows excitation in the range from 350 to 490 nm. Fluorescence was detected at a 90° angle by multichannel plate detector connected to the SPC 130 PC card. Closed flux system using a peristaltic pump was used to refresh continuously the sample under laser irradiation to reduce any interference of eventual photodegradation with the results.
The fluorescence decay curves were analyzed by the nonlinear least-squares method, fitting the data deconvoluted from the source signal to a multiexponential function:
| 4 |
where τi are the lifetimes and Ai are their relative weights, with i variable from 1 to 3. The best-fit function was chosen, considering the magnitude of χ2 and the shape of the autocorrelation function of the weighted residuals. Time-resolved anisotropy measurements were conducted by including two Glan-Laser Polarizers, one for polarization of excitation beam and the other for polarization of fluorescence. As in the case of the steady-state anisotropy experiments, four measurements with different combination of polarizer direction were collected. For measurements with horizontal excitation beam polarization, a half-wave plate was used in order to rotate the polarization of the vertically polarized laser beam by 90°. TRFA Global Analysis Program, developed by Scientific Software Technologies Center, was used for calculation of anisotropy decays. Source signals, also called instrument response functions (IRF), were collected using a diluted sample of scatterer.
Solid State NMR Spectroscopy
Solid-state NMR experiments were performed using a Varian INOVA-400 NMR spectrometer operating at 400.16 MHz for 1H observation. The spectrometer is equipped for Cross-Polarization, Magic Angle Spinning (CP MAS) operation, with 100 W of transmitter power for the 1H channel, and 300 W on the broadband (13C, 31P) channel. The probe used in these experiments is a Varian 2-channel 5 mm CP MAS probe, modified with a new spinning module and coil designed and constructed by Revolution NMR, LLC in Fort Collins, CO. This probe utilizes Zirconia “pencil” style rotors and is capable of spinning 5 mm rotors stably at spinning frequencies up to 13 kHz.
Solid-state measurements were performed on 1 in TPP-d12 (molar ratio: 21.6 mol % of 1, 78.4 mol % of TPP-d12). For comparison, the same measurements were collected on neat 1 and on TPP-d12. 13C and 31P CPMAS experiments were performed using a 3.75 μs 1H 90° pulse, employing ramped cross-polarization with a spin-lock field centered at a magnitude 67 kHz. Contact times used were 5.0 ms for 13C and 2.0 ms for 31P, each optimized for maximum polarization transfer with minimal signal loss due to T1ρ relaxation. A delay of 5.0 s was employed to allow for 1H relaxation between scans. Broadband TPPM (time-proportional phase modulation) 1H decoupling was applied during signal acquisition, utilizing a CW decoupling power of 70 kHz, with an optimized TPPM pulse width of 8.1 μs. MAS (magic angle spinning) was performed at 11.0–11.5 kHz.
31P SPE (single pulse excitation) experiments were performed using the same high-power 1H decoupling scheme described for CP MAS experiments, but a single excitation pulse of 2.8 μs was applied prior to 31P detection, which corresponds to a 45° excitation pulse angle. MAS spinning frequencies of 11.0–11.5 kHz were used in all cases. Relaxation delays of 10.0 s were used for 31P relaxation between scans. This delay was not intended to be adequate for accurate quantitation of 31P nuclei.
Synthesis. General Methods
All reactions were carried out under argon atmosphere with dry solvents, freshly distilled under anhydrous conditions, unless otherwise noted. Standard Schlenk and vacuum line techniques were employed for all manipulations of air- or moisture-sensitive compounds. Yields refer to isolated, chromatographically and spectroscopically homogeneous materials, unless otherwise stated. Melting points were determined with a standard apparatus and are uncorrected. 1H and 13C spectra were acquired at 25 °C with 400, 500, and 600 MHz spectrometers and were referenced to residual solvent peaks.
Materials
p-Quaterphenyl (5) was purchased (Fluka, >99%) and used as received. [(3-((4′-Iodobiphenyl-4-yl)ethynyl)bicyclo[1.1.1]pent-1-yl)ethynyl)trimethylsilane (6) was prepared according to a previously published procedure.27−29 A literature procedure22 was used to prepare TPP from catechol and TPP-d12 from catechol-d6.48 Hexagonal TPP with empty channels was prepared by a modified literature procedure,49 dissolving the monoclinic form in THF at 60 °C and then sonicating for 20 min in an ice bath. The hexagonal TPP was decanted and dried under reduced pressure (500 mTorr) at room temperature for 48 h.
[1,3-Bis(diphenylphosphino)propane]dichloronickel(II) (NiCl2[dppp]), 4,4′-bis(4,4,5,5-tetramethyl-1,3,2-dioxaborolan-2-yl)biphenyl, 1-bromohexane, 4′-bromobiphenyl-4-ol (10), (4-bromophenyl)trimethylsilane, di-tert-butyl carbonate (Boc2O), CuI, 4-ethynylbiphenyl, ethynyltrimethylsilane (TMSA), iodine monochloride, magnesium, Pd(PPh3)4, and TBAF in THF were purchased and used without purification. Anhydrous Mg(ClO4)2 was purchased and dried under reduced pressure (2 h, 130 °C, 500 mTorr) prior to use. Triethylamine was distilled from CaH2 under argon immediately prior to use. CH2Cl2 was distilled from P4O10 prior to use. Toluene was distilled from sodium immediately prior to use.
General Procedure for Sonogashira-Hagihara Cross-Coupling (GP 1)
A flame-dried Schlenk flask was charged with 6 (1 equiv), alkyne (1.2 equiv), Pd(PPh3)4 (4 mol %) and CuI (3 mol %). After three successive vacuum/argon cycles, dry and degassed THF (25 mL) and triethylamine (5 mL) were added from a syringe. The yellow solution/suspension was stirred at 45 °C for 16 h. A dense white solid precipitated. The yellow reaction mixture was cooled to room temperature and solids were removed by filtration. Subsequently, white solid was collected on a frit and washed with ether (3 × 5 mL), concentrated aqueous NH4Cl (3 × 10 mL), water (3 × 15 mL), hexane (3 × 10 mL), and finally dried under reduced pressure (25 °C, 500 mTorr).
((3-((4′-(Biphenyl-4-ylethynyl)biphenyl-4-yl)ethynyl)bicyclo[1.1.1]pent-1-yl)ethynyl)trimethylsilane (1)
1 was prepared from 6 (110 mg, 0.236 mmol), Pd(PPh3)4 (11 mg, 0.009 mmol, 4 mol %), CuI (1 mg, 0.007 mmol, 3 mol %), and 4-ethynylbiphenyl (7) (50 mg, 0.283 mmol) in a mixture of THF (25 mL) and triethylamine (5 mL), according to GP 1. Product 1 was isolated as a white solid (80 mg, 0.155 mmol, 66%). Mp > 250 °C (dec). 1H NMR (600 MHz, CDCl3): δ 0.16 (s, 9H, CH3), 2.42 (s, 6H, CH2), 7.36–7.38 (m, 1H, Ar–H), 7.44–7.48 (m, 4H, Ar–H), 7.54–7.62 (m, 12H, Ar–H). 13C NMR (150 MHz, CDCl3): δ 0.01, 29.6, 30.8, 59.0, 84.8, 89.3, 104.6, 122.2, 122.6, 126.7, 126.9, 127.02, 127.04, 127.7, 128.9, 129.7, 132.0, 132.1, 132.3, 140.0, 140.3 (some of the quaternary carbons were not observable even in saturated solution). IR (KBr): 3052, 3035, 2987, 2959, 2913, 2876, 2218, 2161, 1598, 1580, 1549, 1519, 1494, 1447, 1401, 1358, 1336, 1315, 1263, 1250, 1216, 1195, 1158, 1130, 1113, 1079, 1039, 1003, 919, 861, 841, 822, 762, 721, 693, 639, 620, 558, 533, 502 cm–1. MS, m/z (%): 516.2 (M, 100), 501.2 (M – CH3, 27), 485.2 (12), 473.2 (5), 457.2 (7), 443.2 (M – TMS, 21), 411.2 (6), 378.1 (12), 354.1 (5), 300.1 (5), 267.1 (7), 250.6 (14), 242.6 (8), 250.6 (9), 189.1 (7), 97.0 (14), 83.0 (13), 73.0 (94), 59.0 (14). HRMS, (EI) for (C38H32Si+): calcd, 516.2273. Found, 516.2270. UV–vis (CH2Cl2) ν̃max (ε): 30.5 × 103 cm–1 (84.5 × 10³ M–1cm–1). Anal. Calcd for C38H32Si: C, 88.32; H, 6.24. Found: C, 88.31; H, 6.04.
((3-((4′-((4′-Tert-butoxybiphenyl-4-yl)ethynyl)biphenyl-4-yl)ethynyl)bicyclo[1.1.1]pent-1-yl)ethynyl)trimethylsilane (2)
2 was prepared according to GP 1 from 6 (110 mg, 0.236 mmol), Pd(PPh3)4 (11 mg, 0.009 mmol, 4 mol %), CuI (1 mg, 0.007 mmol, 3 mol %), and 8 (71 mg, 0.283 mmol) in a mixture of THF (25 mL) and triethylamine (5 mL). Pure 2 was isolated as a white solid (76 mg, 0.129 mmol, 55%).
Mp > 250 °C (dec). 1H NMR (400 MHz, CDCl3): δ 0.16 (s, 9H, CH3), 1.39 (s, 9H, CH3), 2.42 (s, 6H, CH2), 7.06–7.08 (m, 2H, Ar–H), 7.46–7.60 (m, 14H, Ar–H). 13C NMR (100 MHz, CDCl3): δ 0.01, 28.9, 30.6, 30.8, 59.0, 78.8, 79.8, 84.8, 89.2, 89.8, 90.4, 104.6, 121.6, 122.2, 122.6, 124.4, 126.69, 126.73, 126.8, 127.4, 132.0, 132.1, 132.3, 135.2, 139.9, 140.0, 140.6, 155.4. IR (KBr): 3129, 3036, 2975, 2932, 2913, 2877, 2216, 2164, 1602, 1575, 1497, 1457, 1399, 1390, 1365, 1312, 1262, 1249, 1165, 1114, 1082, 1003, 949, 922, 901, 861, 838, 823, 759, 723, 717, 699, 631, 621, 561, 526 cm–1. MS, m/z (%): 588.3 (M, 9), 573.3 (M – CH3, 4), 532.2 (M – t-Bu, 100), 517.2 (M – TMS, 21), 501.2 (8), 460.2 (14), 427.2 (4), 395.1 (5), 258.6 (11), 165.1 (4), 97.0 (6), 73.0 (TMS, 53), 56.1 (t-Bu, 32). HRMS, (EI) for (C42H40OSi+): calcd, 588.2848; found, 588.2858. UV–vis (CH2Cl2) ν̃max (ε): 30.3 × 103 cm–1 (75.8 × 10³ M–1 cm–1). Anal. Calcd for C42H40OSi: C, 85.67; H, 6.85. Found: C, 85.43; H, 6.79.
((3-((4′-((4′-(Hexyloxy)biphenyl-4-yl)ethynyl)biphenyl-4-yl)ethynyl)bicyclo[1.1.1]pent-1-yl)ethynyl)trimethylsilane (3)
3 was prepared from 6 (110 mg, 0.236 mmol), Pd(PPh3)4 (11 mg, 0.009 mmol, 4 mol %), CuI (1 mg, 0.007 mmol, 3 mol %) and 9 (79 mg, 0.283 mmol) in a mixture of THF (10 mL) and triethylamine (5 mL) according to GP 1. Product 3 was isolated as a white solid (116 mg, 0.188 mmol, 80%). Mp > 250 °C (dec). 1H NMR (600 MHz, CDCl3): δ 0.16 (s, 9H, CH3), 0.92 (t, J = 7.10 Hz, CH3), 1.36 (m, 4H, CH2), 1.48 (m, 2H, CH2), 1.80 (m, 2H, CH2), 2.41 (s, 6H, CH2), 4.01 (t, J = 6.59 Hz, 2H, OCH2), 6.97–6.99 (m, 2H, Ar–H), 7.47–7.48 (m, 2H, Ar–H), 7.53–7.61 (m, 12H, Ar–H). 13C NMR (150 MHz, CDCl3): δ 0.01, 14.0, 22.6, 25.7, 29.3, 30.6, 30.8, 31.6, 59.1, 68.1, 79.8, 84.8, 89.2, 89.7, 90.5, 104.6, 114.9, 121.3, 122.2, 122.7, 126.5, 126.7, 126.8, 128.0, 132.0, 132.1, 132.3, 132.6, 139.89, 139.91, 140.7, 159.1. IR (KBr): 3037, 2989, 2958, 2917, 2874, 2215, 2163, 1579, 1499, 1470, 1400, 1312, 1287, 1262, 1250, 1200, 1178, 1138, 1117, 1082, 1035, 1001, 937, 920, 860, 843, 823, 760, 723, 699, 685, 629, 523 cm–1. MS, m/z (%): 616.3 (M, 100), 601.3 (M – CH3, 8), 544.3 (8), 517.2 (7), 501.2 (5), 460.2 (10), 258.6 (11), 170.1 (6), 123.1 (5), 97.0 (6), 75.0 (66), 73.0 (38), 55 (12). HRMS, (EI) for (C44H44OSi+): calcd, 616.3161; found, 616.3159. UV–vis (CH2Cl2) ν̃max: 30.1 × 103 cm–1 [(6–9) × 104 M–1cm–1, the solubility was too low for an accurate determination of ε]. Anal. Calcd for C44H44OSi: C, 85.66; H, 7.19. Found: C, 85.42; H, 7.11.
4-Tert-butoxy-4′-ethynylbiphenyl (8)
To a stirred solution of 13 (250 mg, 0.775 mmol) in THF (4 mL), a solution of TBAF in THF (1.0 M, 1.00 mL, 1.000 mmol) was added at room temperature. The reddish reaction mixture was stirred for 30 min. The mixture was then diluted with ether (80 mL), washed with water (2 × 20 mL), and the organic phase was dried over MgSO4. Solvents were removed under reduced pressure and column chromatography on silica gel (hexane/CH2Cl2 – 1:1) and afforded pure 8 as a white crystalline solid (167 mg, 0.667 mmol, 86%). Mp: 99.7–101.0 °C. 1H NMR (400 MHz, CDCl3): δ 1.39 (s, 9H, CH3), 3.12 (s, 1H, CH), 7.05–7.07 (m, 2H, Ar–H), 7.48–7.50 (m, 2H, Ar–H), 7.54 (br s, 4H, Ar–H). 13C NMR (100 MHz, CDCl3): δ 28.9, 77.5, 78.8, 83.7, 120.5, 124.3, 126.6, 127.5, 132.5, 135.1, 141.2, 155.5. IR (KBr): 3296, 3084, 3066, 2976, 2932, 2905, 2872, 2105, 1604, 1575, 1522, 1491, 1459, 1390, 1366, 1307, 1286, 1242, 1165, 1113, 1025, 1005, 951, 924, 900, 862, 834, 753, 718, 655, 620, 569, 549, 524, 510 cm–1. MS, m/z (%): 250.1 (M, 9), 235.1 (M – CH3, 6), 194.1 (M – t-Bu, 100), 176.1 (7), 165.1 (30), 139.1 (12), 115.1 (5), 57.1 (t-Bu, 6). HRMS, (EI) for (C18H18O+): calcd, 250.1358; found, 250.1361. UV–vis (CH2Cl2) ν̃max (ε): 35.5 × 103 cm–1 (32.0 × 10³ M–1 cm–1). Anal. Calcd for C18H18O: C, 86.36; H, 7.25. Found: C, 86.13; H, 7.32.
4-Ethynyl-4′-(hexyloxy)biphenyl (9).50
To a solution of 14 (500 mg, 1.426 mmol) in THF (6 mL), a solution of TBAF in THF (1.0 M, 2.00 mL, 2.000 mmol) was slowly added at room temperature and stirred for 30 min. The brown reaction mixture was diluted with ether (70 mL), washed with water (2 × 30 mL), and the organic phase was dried over MgSO4. Solvents were removed under reduced pressure and the resulting yellowish solid was purified by a column chromatography on silica gel (hexane/CH2Cl2 – 4:1) yielding 9 as a white crystalline solid (387 mg, 1.390 mmol, 97%). 1H NMR (400 MHz, CDCl3): δ 0.92 (t, J = 7.06 Hz, CH3), 1.35 (m, 4H, CH2), 1.48 (m, 2H, CH2), 1.81 (m, 2H, CH2), 3.11 (s, 1H, CH), 4.00 (t, J = 6.58 Hz, 2H, OCH2), 6.96–6.98 (m, 2H, Ar–H), 7.50–7.53 (m, 6H, Ar–H).
4-Bromo-4′-tert-butoxybiphenyl (11)
A two-necked flask equipped with gas condenser was charged with Mg(ClO4)2 (89 mg, 0.400 mmol) and 4′-bromobiphenyl-4-ol (10, 1.000 g, 4.014 mmol). Subsequently, dry CH2Cl2 was added (6 mL) followed by slow addition of Boc2O (2.12 mL, 9.232 mmol). Bubbles formed immediately. The clear brownish solution was stirred at 40 °C for 18 h, cooled to room temperature, diluted with ether (60 mL), and washed with water (2 × 20 mL). The organic phase was dried over Na2SO4 and chromatographed on silica gel (hexane/CH2Cl2 – 1:1), providing 11 as a white crystalline solid (802 mg, 2.628 mmol, 65%). Mp: 105.4–107.3 °C. 1H NMR (400 MHz, CDCl3): δ 1.39 (s, 9H, CH3), 7.05–7.07 (m, 2H, Ar–H), 7.42–7.46 (m, 4H, Ar–H), 7.53–7.55 (m, 2H, Ar–H). 13C NMR (100 MHz, CDCl3): δ 28.9, 78.7, 121.0, 124.4, 127.3, 128.4, 131.8, 134.8, 139.7, 155.3. IR (KBr): 3087, 3072, 3057, 3040, 2979, 2946, 2931, 2902, 2870, 1599, 1586, 1558, 1518, 1482, 1459, 1416, 1388, 1366, 1315, 1304, 1247, 1199, 1178, 1162, 1127, 1107, 1079, 1026, 1010, 1001, 945, 925, 902, 857, 824, 811, 747, 696, 668, 548, 512 cm–1. MS, m/z (%): 304.1 (M, 23), 291.0 (M – CH3, 18), 248.0 (M – t-Bu, 100), 168.1 (M – t-Bu – Br, 9), 152.1 (5), 139.1 (22), 115.1 (16), 87.1 (10), 56.1 (8). HRMS, (EI) for (C16H17BrO+): calcd, 304.0463. Found, 304.0466. Anal. Calcd for C16H17BrO: C, 62.96; H, 5.61; Br, 26.18. Found: C, 62.88; H, 5.42; Br, 26.24.
4-Bromo-4′-(hexyloxy)biphenyl (12).50
To a stirred solution of 10 (1.500 g, 6.022 mmol) in dry DMF (40 mL) was slowly added NaH (578 mg, 24.088 mmol) at room temperature. After 10 min of vigorous stirring, 1-bromohexane (5.07 mL, 36.130 mmol), TBACl (167 mg, 0.600 mmol), and a catalytic amount of NaI were added to the reaction mixture. The yellowish suspension was vigorously stirred at 80 °C for 16 h, cooled to room temperature, and carefully poured into ice-cooled 60% aqueous LiCl (300 mL). The aqueous phase was extracted with ether (3 × 80 mL) and the yellowish organic phase was then washed with 60% aqueous LiCl (4 × 40 mL), water (2 × 40 mL), and finally dried over MgSO4. Volatiles were removed under reduced pressure and column chromatography on silica gel (hexane/ethyl acetate −10:1) provided hexyl derivative 12 as a snow white solid (1.993 g, 5.980 mmol, 99%). 1H NMR (400 MHz, CDCl3): δ 0.92 (t, J = 6.98 Hz, CH3), 1.35 (m, 4H, CH2), 1.48 (m, 2H, CH2), 1.81 (m, 2H, CH2), 3.99 (t, J = 6.58 Hz, 2H, OCH2), 6.95–6.97 (m, 2H, Ar–H), 7.40–7.42 (m, 2H, Ar–H), 7.46–7.48 (m, 2H, Ar–H), 7.52–7.54 (m, 2H, Ar–H).
((4′-Tert-butoxybiphenyl-4-yl)ethynyl)trimethylsilane (13)
A flame-dried Schlenk flask was charged with 11 (400 mg, 1.311 mmol), Pd(PPh3)4 (61 mg; 0.052 mmol, 4 mol %), and CuI (7 mg, 0.039 mmol, 3 mol %). After three successive vacuum/argon cycles, dry and degassed THF (5 mL) and triethylamine (5 mL) were added from a syringe. Finally, TMSA (283 μL, 2.000 mmol) was added dropwise from a syringe. The yellow solution was stirred at 55 °C for 18 h. A dense white solid precipitated. The crude reaction mixture was cooled to room temperature, diluted with ether (70 mL), and washed with saturated aqueous NH4Cl (2 × 20 mL) and water (2 × 20 mL). The yellow organic phase was dried over MgSO4. Column chromatography on silica gel (hexane/CH2Cl2 – 1:1) afforded 13 as a white crystalline solid (417 mg, 1.293 mmol, 99%). Mp: 122.9–124.1 °C. 1H NMR (400 MHz, CDCl3): δ 0.27 (s, 9H, CH3), 1.39 (s, 9H, CH3), 7.05–7.07 (m, 2H, Ar–H), 7.48–7.50 (m, 2H, Ar–H), 7.52 (br s, 4H, Ar–H). 13C NMR (100 MHz, CDCl3): δ 0.01, 28.9, 78.7, 94.6, 105.1, 121.5, 124.3, 126.5, 127.4, 132.3, 135.2, 140.7, 155.3. IR (KBr): 3061, 3034, 2977, 2933, 2901, 2156, 1602, 1576, 1524, 1511, 1492, 1459, 1437, 1391, 1366, 1310, 1283, 1250, 1228, 1167, 1119, 1023, 1003, 954, 927, 901, 868, 838, 761, 723, 697, 651, 637, 598, 534 cm–1. MS, m/z (%): 322.2 (M, 48), 307.2 (M – CH3, 37), 277.1 (11), 266.1 (M – t-Bu, 69), 251.1 (M – TMS, 100), 221.0 (5), 194.1 (22), 165.1 (11), 152.1 (5), 139.1 (5), 125.5 (5), 87.1 (10), 75.0 (22), 56.1 (10). HRMS, (EI) for (C21H26OSi+): calcd, 322.1753. Found, 322.1762. UV–vis (CH2Cl2) ν̃max (ε): 34.5 × 103 cm–1 (34.6 × 10³ M–1cm–1). Anal. Calcd for C21H26OSi: C, 78.21; H, 8.13; Si, 8.71. Found: C, 78.02; H, 7.90; Si, 8.99.
((4′-(Hexyloxy)biphenyl-4-yl)ethynyl)trimethylsilane (14)50
14 was prepared as described for 13, but starting from 12 (1.000 g, 3.001 mmol), Pd(PPh3)4 (139 mg, 0.120 mmol, 4 mol %), CuI (17 mg, 0.090 mmol, 3 mol %), TMSA (636 mL, 4.501 mmol) in mixture of THF (7 mL) and triethylamine (5 mL). Pure 14 (1.021 g, 2.912 mmol, 97%) was isolated as a white solid by column chromatography on silica gel (hexane/ethyl acetate −15:1). 1H NMR (400 MHz, CDCl3): δ 0.26 (s, 9H, CH3), 0.92 (t, J = 7.04 Hz, CH3), 1.35 (m, 4H, CH2), 1.48 (m, 2H, CH2), 1.80 (m, 2H, CH2), 3.99 (t, J = 6.59 Hz, 2H, OCH2), 6.95–6.97 (m, 2H, Ar–H), 7.50–7.52 (m, 6H, Ar–H).
(4-Hexylphenyl)trimethylsilane.30
The published procedure30 was adapted as follows: to the suspension of Mg (729 mg, 30.000 mmol) in ether (60 mL) at room temperature was added a small crystal of I2. The brownish suspension was stirred for 10 min. Subsequently, 1-bromohexane (4.21 mL, 30.000 mmol) was slowly added over a period of 10 min. When the exothermic reaction stopped, the reaction mixture was refluxed for an additional 50 min. Magnesium dissolved, leaving a homogeneous slightly grayish solution. Then (4-bromophenyl)trimethylsilane (4.26 mL, 22.503 mmol) and NiCl2[dppp] (54 mg, 0.100 mmol) were added. The reaction mixture slowly turned black, and the dark solution was stirred for 3 d at 50 °C, cooled to room temperature, and diluted with ether (50 mL), before water (10 mL) and 15% aq HCl (40 mL) were added. The layers were separated; the organic phase was washed by saturated aqueous NaHCO3 (1 × 20 mL) and dried over MgSO4. The solvent was evaporated and distillation on Kugelrohr distillation apparatus (600 mTorr, 140 °C) gave (4-hexylphenyl)trimethylsilane as a colorless liquid (2.700 g, 11.516 mmol, 51%). 1H NMR (400 MHz, CDCl3): δ 0.26 (s, 9H, Si(CH3)3), 0.89 (m, 3H, CH3), 1.32 (m, 6H, CH2), 1.62 (m, 2H, CH2), 2.60 (m, 2H, CH2), 7.18 (m, 2H, Ar–H), 7.44 (m, 2H, Ar–H).
1-Hexyl-4-iodobenzene.30
The published procedure was adapted as follows: to a solution of the (4-hexylphenyl)trimethylsilane (2.600 g, 11.090 mmol) in CH2Cl2 (15 mL) at 0 °C was added ICl (652 μL, 13.000 mmol) over a period of 5 min. The mixture was allowed to warm to room temperature and was stirred for an additional 50 min. Subsequently, concentrated aqueous Na2SO3 was added to the dark reaction mixture. The organic phase lost its color while the aqueous phase turned yellow. An additional portion of CH2Cl2 was added, and the aqueous phase was removed. Organic phase was then washed with saturated aqueous Na2SO3 and finally dried over MgSO4. Column chromatography on silica gel (hexane) provided 1-hexyl-4-iodobenzene as colorless oil (2.905 g, 10.081 mmol, 91%). 1H NMR (400 MHz, CDCl3): δ 0.88 (m, 3H, CH3), 1.28 (m, 6H, CH2), 1.57 (m, 2H, CH2), 2.54 (m, 2H, CH2), 6.93 (m, 2H, Ar–H), 7.58 (m, 2H, Ar–H).
1,4‴-Dihexyl-4,1′:4′,1″:4″,1‴-quaterphenyl (4)
An argon-filled two-necked flask equipped with gas condenser and magnetic stirbar was charged with 4,4′-bis(4,4,5,5-tetramethyl-1,3,2-dioxaborolan-2-yl)biphenyl (500 mg, 1.231 mmol), 1-hexyl-4-iodobenzene (887 mg, 3.078 mmol), K2CO3 (1.382 g, 10.000 mmol), toluene (10 mL), ethanol (5 mL), and water (5 mL). Argon was bubbled through this two phase system for 10 min. After three successive freeze (liquid nitrogen)/vacuum/argon cycles, Pd(PPh3)4 (86 mg, 0.074 mmol, 6 mol %) was added and the yellow reaction mixture was vigorously stirred for 8 h at 80 °C and 16 h at 100 °C. The reaction mixture turned black and a dense white solid precipitated. An additional portion of Pd(PPh3)4 (86 mg, 0.074 mmol, 6 mol %) was added and the dark reaction mixture was stirred at 100 °C for an additional 26 h. The solid that precipitated was collected by filtration and subsequently washed with water (3 × 30 mL), concentrated aqueous HCl (3 × 15 mL), water (3 × 15 mL), ether (3 × 15 mL), hexane (3 × 15 mL), and ice-cold CHCl3 (3 × 15 mL). Column chromatography of the grayish solid residue on silica gel (CHCl3/hexane −1:3) provided 4 as a snow-white solid (380 mg, 0.800 mmol, 65%). Mp: 297.5–299.8 °C. 1H NMR (400 MHz, CDCl3): δ 0.90 (m, 6H, CH3), 1.33 (m, 8H, CH2), 1.38 (m, 4H, CH2), 1.66 (m, 4H, CH2), 2.66 (m, 4H, CH2), 7.28 (m, 4H, Ar–H), 7.57 (m, 4H, Ar–H), 7.68 (m, 4H, Ar–H), 7.72 (m, 4H, Ar–H). 13C NMR (100 MHz, CDCl3): δ 14.1, 22.6, 29.1, 31.5, 31.8, 35.6, 126.8, 127.28, 127.34, 128.9, 138.0, 139.3, 140.1, 142.3. IR (KBr): 3088, 3032, 2957, 2923, 2873, 2852, 1627, 1609, 1525, 1489, 1466, 1401, 1378, 1360, 1257, 1148, 1123, 1076, 1001, 964, 889, 808, 765, 740, 722, 691 cm–1. MS – MALDI (without matrix), m/z (%): 474.3 (100). HRMS, (MALDI) for (C36H42): calcd, 474.3287. Found, 474.3281. UV–vis (2-MeTHF) ν̃max (ε): 33.1 × 103 cm–1 (52.1 × 10³ M–1cm–1). Anal. Calcd for C36H42: C, 91.08; H, 8.92. Found: C, 90.80; H, 8.66.
Acknowledgments
This work was supported by the European Research Council under the European Community’s Seventh Framework Programme (FP7/2007-2013)/ERC Grant 227756 and by the Institute of Organic Chemistry and Biochemistry, Academy of Sciences of the Czech Republic RVO: 61388963. K.Z., Y.S., and C.T.R. gratefully acknowledge support from the U.S. National Science Foundation (DMR-1409981). We are grateful to Dr. Martina Čížková for TEM imaging and Dr. Jin Wen for modeling the structure shown in Figure 11.
Supporting Information Available
1H and 13C NMR spectra of all new compounds and solid-state NMR spectra of 20%2@TPP-d12 and 20%3@TPP-d12. This material is available free of charge via the Internet at http://pubs.acs.org.
The authors declare no competing financial interest.
Supplementary Material
References
- Kottas G. S.; Clarke L. I.; Horinek D.; Michl J. Artificial Molecular Rotors. Chem. Rev. 2005, 105, 1281–1376. [DOI] [PubMed] [Google Scholar]
- Khuong T.-A. V.; Nuñez J. E.; Godinez C. E.; Garcia-Garibay M. A. Crystalline Molecular Machines: A Quest Toward Solid-State Dynamics and Function. Acc. Chem. Res. 2006, 39, 413–422. [DOI] [PubMed] [Google Scholar]
- Horansky R. D.; Magnera T. F.; Price J. C.; Michl J.. Artificial Dipolar Molecular Rotors. In Controlled Nanoscale Motion, Lecture Notes in Physics, Vol. 711; Linke H.; Månsson A., Eds.; Springer: Berlin, 2007; pp 303–330. [Google Scholar]
- Crowley J. D.; Kay E. R.; Leigh D. A.. Chemically Driven Artificial Molecular Machines. In Intelligent Materials; Shahinpoor M.; Schneider H.-J., Eds.; Royal Society of Chemistry: Cambridge, UK, 2008; pp 1–47. [Google Scholar]
- Garcia-Garibay M. A. Molecular Machines: Nanoscale Gadgets. Nat. Mater. 2008, 7, 431–432. [DOI] [PubMed] [Google Scholar]
- Michl J.; Sykes E. C. H. Molecular Rotors and Motors: Recent Advances and Future Challenges. ACS Nano 2009, 3, 1042–1048. [DOI] [PubMed] [Google Scholar]
- Augulis R.; Klok M.; Feringa B. L.; van Loosdrecht P. H. M. Light-Driven Rotary Molecular Motors: An Ultrafast Optical Study. Phys. Status Solidi C 2009, 6, 181–184. [Google Scholar]
- Xue M.; Wang K. L. Molecular Rotors as Switches. Sensors 2012, 12, 11612–11637. [Google Scholar]
- Lensen D.; Elemans J. A. A. W. Artificial Molecular Rotors and Motors on Surfaces: STM Reveals and Triggers. Soft Matter 2012, 8, 9053–9063. [Google Scholar]
- Rozenbaum V. M.; Ogenko V. M.; Chuiko A. A. Vibrational and Orientational States of Surface Atomic Groups. Sov. Phys. Usp. 1991, 34, 883–902. [Google Scholar]
- Gimzewski J. K.; Joachim C.; Schlittler R. R.; Langlais V.; Tang H.; Johannsen I. Rotation of a Single Molecule Within a Supramolecular Bearing. Science 1998, 281, 531–533. [DOI] [PubMed] [Google Scholar]
- Zheng X.; Mulcahy M. E.; Horinek D.; Galeotti F.; Magnera T. F.; Michl J. Dipolar and Non-Polar Altitudinal Molecular Rotors Mounted on a Au(111) Surface. J. Am. Chem. Soc. 2004, 126, 4540–4542. [DOI] [PubMed] [Google Scholar]
- Tierney H. L.; Murphy C. J.; Jewell A. D.; Baber A. E.; Iski E. V.; Khodaverdian H. Y.; McGuire A. F.; Klebanov N.; Sykes E. C. H. Experimental Demonstration of a Single-Molecule Electric Motor. Nat. Nanotechnol. 2011, 6, 625–629. [DOI] [PubMed] [Google Scholar]
- Clarke L. I.; Horinek D.; Kottas G. S.; Varaksa N.; Magnera T. F.; Hinderer T. P.; Horansky R. D.; Michl J.; Price J. C. Dielectric Response of Chloromethylsilyl and Dichloromethylsilyl Dipolar Rotors on Fused Silica Surfaces. Nanotechnology 2002, 13, 533–540. [Google Scholar]
- Winston E. B.; Lowell P. J.; Vacek J.; Chocholoušová J.; Michl J.; Price J. C. Dipolar Molecular Rotors in the Metal-Organic Framework Crystal IRMOF-2. Phys. Chem. Chem. Phys. 2008, 10, 5188–5191. [DOI] [PubMed] [Google Scholar]
- Horansky R. D.; Clarke L. I.; Price J. C.; Khuong T-A. V.; Jarowski P. D.; Garcia- Garibay M. A. Dielectric Response of a Dipolar Molecular Rotor Crystal. Phys. Rev. B 2005, 72, 014302-1–014302-5. [Google Scholar]
- Kobr L.; Zhao K.; Shen Y.; Comotti A.; Bracco S.; Shoemaker R. K.; Sozzani P.; Clark N. A.; Price J. C.; Rogers C. T.; Michl J. Inclusion Compound Based Approach to Arrays of Artificial Dipolar Molecular Rotors. A Surface Inclusion. J. Am. Chem. Soc. 2012, 134, 10122–10131. [DOI] [PubMed] [Google Scholar]
- Kobr L.; Zhao K.; Shen Y.; Polivkova K.; Shoemaker R. K.; Clark N. A.; Price J. C.; Rogers C. T.; Michl J. Inclusion Compound Based Approach to Arrays of Artificial Dipolar Molecular Rotors. Bulk Inclusions. J. Org. Chem. 2013, 78, 1768–1777. [DOI] [PubMed] [Google Scholar]
- Kobr L.; Zhao K.; Shen Y.; Shoemaker R. K.; Rogers C. T.; Michl J. Inclusion Compound Based Approach to Forming Arrays of Artificial Dipolar Molecular Rotors. A Search for Optimal Rotor Structures. Adv. Mater. 2013, 25, 443–448. [DOI] [PubMed] [Google Scholar]
- Kobr L.; Zhao K.; Shen Y.; Shoemaker R. K.; Rogers C. T.; Michl J. Tris-o-phenylenedioxycyclophosphazene (TPP) Inclusion Compounds Containing A Dipolar Molecular Rotor. Cryst. Growth Des. 2014, 14, 559–568. [Google Scholar]
- Zhao K.; Dron P. I.; Kaleta J.; Rogers C. T.; Michl J.. Arrays of Dipolar Molecular Rotors in Tris(o-phenylenedioxy)cyclotriphosphazene (TPP). In Topics in Current Chemistry: Molecular Machines and Motors: Recent Advances and Perspectives, Vol 354; Credi A.; Silvi S.; Venturi M., Eds.; Springer: Switzerland, 2014; pp 163–211. [DOI] [PubMed] [Google Scholar]
- Comotti A.; Simonutti R.; Stramare S.; Sozzani P. 13C and 31P MAS NMR Investigations of Spirocyclotriphosphazene Nanotubes. Nanotechnology 1999, 10, 70–76. [Google Scholar]
- Brustolon M.; Barbon A.; Bortolus M.; Maniero A. L.; Sozzani P.; Comotti A.; Simonutti R. Dynamics of Alkoxy-Oligothiophene Ground and Excited States in Nanochannels. J. Am. Chem. Soc. 2004, 126, 15512–15519. [DOI] [PubMed] [Google Scholar]
- Hadar I.; Hitin G. B.; Sitt A.; Faust A.; Banin U. Polarization Properties of Semiconductor Nanorod Heterostructures: From Single Particles to the Ensemble. J. Phys. Chem. Lett. 2013, 4, 502–507. [DOI] [PubMed] [Google Scholar]
- Tice D. B.; Weinberg D. J.; Mathew N.; Chang R. P. H.; Weiss E. A. Measurement of Wavelength-Dependent Polarization Character in the Absorption Anisotropies of Ensembles of CdSe Nanorods. J. Phys. Chem. C 2013, 117, 13289–13296. [Google Scholar]
- Kuzmanich G.; Xue J.; Netto-Ferreira J.-C.; Scaiano J. C.; Platz M.; Garcia-Garibay M. A. Steady State and Transient Kinetics in Crystalline Solids: The Photochemistry of Nanocrystalline 1,1,3-triphenyl-3-hydroxy-2-indanone. Chem. Sci. 2011, 2, 1497–1501. [Google Scholar]
- Schwab P.; Noll B. C.; Michl J. Synthesis and Structure of Trigonal and Tetragonal Connectors for a ‘Tinkertoy’ Construction Set. J. Org. Chem. 2002, 67, 5476–5485. [DOI] [PubMed] [Google Scholar]
- Kaleta J.; Mazal C. A Triangular Macrocycle Altering Planar and Bulky Sections in Its Molecular Backbone. Org. Lett. 2011, 13, 1326–1329. [DOI] [PubMed] [Google Scholar]
- Kaleta J.; Necas M.; Mazal C. 1,3-Diethynylbicyclo[1.1.1]pentane, a Useful Molecular Building Block. Eur. J. Org. Chem. 2012, 25, 4783–4796. [Google Scholar]
- Frahn J.; Schlüter A.-D. Functionalized AB-Type Monomers for Suzuki Polycondensation. Synthesis 1997, 11, 1301–1304. [Google Scholar]
- Comotti A.; Bracco S.; Ferretti L.; Mauri M.; Simonutti R.; Sozzani P. A Single-Crystal Imprints Macroscopic Orientation on Xenon Atoms. Chem. Commun. 2007, 350–352. [DOI] [PubMed] [Google Scholar]
- Montalti M.; Credi A.; Prodi L.; Gandolfi M. T.. Handbook of Photochemistry, 3rd ed.; Taylor and Francis Group: Boca Raton, 2006. [Google Scholar]
- Berlman I. B.Handbook of Fluorescence Spectra of Aromatic Molecules; Academic Press: New York, 1971. [Google Scholar]
- Kawski A.; Piszczek G.; Kubicki A. Fluorescence Properties of p-Quaterphenyl and p-Quinquephenyl Derivatives in Liquid Solvents. Z. Naturforsch., A: Phys. Sci. 1996, 51, 905–909. [Google Scholar]
- Nijegorodov N. I.; Downey W. S.; Danailov M. B. Systematic Investigation of Absorption, Fluorescence and Laser Properties of Some p- and m-oligophenylenes. Spectrochim. Acta, Part A 2000, 56, 783–795. [DOI] [PubMed] [Google Scholar]
- Allcock H. R.; Levin M. L.; Whittle R. R. Tris(o-phenylenedioxy)cyclotriphosphazene: The Clathration-Induced Monoclinic to Hexagonal Solid-state Transition. Inorg. Chem. 1986, 25, 41–47. [Google Scholar]
- Sozzani P.; Comotti A.; Bracco S.; Simonutti R. A Novel Family of Supramolecular Frameworks of Polyconjugated Molecules Hosted in Aromatic Nanochannels. Angew. Chem., Int. Ed. 2004, 43, 2792–2797. [DOI] [PubMed] [Google Scholar]
- Sozzani P.; Bracci S.; Comotti A.; Ferretti L.; Simonutti R. Methane and Carbon Dioxide Storage in a Porous van der Waals Crystal. Angew. Chem., Int. Ed. 2005, 44, 1816–1820. [DOI] [PubMed] [Google Scholar]
- Uchida K.; Karei T.; Takahashi Y. Influence of Molecular Geometry on the Absorption Spectra of p-quaterphenyl Crystals and Phase Transition. J. Lumin. 1997, 72–74, 501–502. [Google Scholar]
- Thulstrup E. W.; Michl J. Orientation and Linear Dichroism of Symmetrical Aromatic Molecules Imbedded in Stretched Polyethylene. J. Am. Chem. Soc. 1982, 104, 5594–5604. [Google Scholar]
- Coulson C. A. Exited Electronic Levels in Conjugated Molecules. Proc. Phys. Soc. 1948, 60, 257–269. [Google Scholar]
- Dale J. Ultraviolet Absorption Spectra of ortho- and para-Linked Polyphenyls. Acta Scand. 1957, 11, 650–659. [Google Scholar]
- Suzuki H.Electronic Absorption Spectra and Geometry of Organic Molecules; Academic Press: New York, 1967. [Google Scholar]
- Razi Naqvi K.; Dontsch J.; Wild U. P. The Influence of Molecular Geometry on the Fluorescence Spectra of Biphenyl and the Polyphenyls. Chem. Phys. Lett. 1975, 34, 285–288. [Google Scholar]
- Langkilde F. W.; Thulstrup E. W.; Michl J. The Effect of Solvent Environment on Molecular Electronic Transition Moment Directions: Symmetry Lowering in Pyrene. J. Chem. Phys. 1983, 78, 3372–3381. [Google Scholar]
- Langkilde F. W.; Gisin M.; Thulstrup E. W.; Michl J. Alignment of Solutes in Stretched Polyethylene. Determination of the Five Second and Fourth Moments of the Orientation Distribution of 2-Fluoropyrene from Polarized Fluorescence. Additional Evidence for the Twisting of Weak Transition Moments by the Solvent Environment. J. Phys. Chem. 1983, 87, 2901–2911. [Google Scholar]
- Lakowicz J. R.Principles of Fluorescence Spectroscopy, 3rd ed.; Springer: New York, NY, 2006. [Google Scholar]
- Ito N.; Esaki H.; Maesawa T.; Imamiya E.; Maegawa T.; Sajiki H. Efficient and Selective Pt/C-Catalyzed H–D Exchange Reaction of Aromatic Rings. Bull. Chem. Soc. Jpn. 2008, 81, 278–286. [Google Scholar]
- Hertzsch T.; Budde F.; Weber E.; Hulliger J. Supramolecular-Wire Confinement of I2 Molecules in Channels of the Organic Zeolite Tris(o-phenylenedioxy)cyclotriphosphazene. Angew. Chem., Int. Ed. 2002, 41, 2281–2284. [DOI] [PubMed] [Google Scholar]
- Uchimura M.; Kang S.; Ishige R.; Watanabe J.; Konishi G. Synthesis of Liquid Crystal Molecules Based on Bis(biphenyl)diacetylene and Their Liquid Crystallinity. Chem. Lett. 2010, 39, 513–515. [Google Scholar]
Associated Data
This section collects any data citations, data availability statements, or supplementary materials included in this article.


