

Abstract
Although anatomical constraints have been shown to be effective for MEG and EEG inverse solutions, there are still no effective physiological constraints. Strength of the current generator is normally described by the moment of an equivalent current dipole Q. This value is quite variable since it depends on size of active tissue. In contrast, the current dipole moment density q, defined as Q per surface area of active cortex, is independent of size of active tissue. Here we studied whether the value of q has a maximum in physiological conditions across brain structures and species. We determined the value due to the primary neuronal current (qprimary) alone, correcting for distortions due to measurement conditions and secondary current sources at boundaries separating regions of differing electrical conductivity. The values were in the same range for turtle cerebellum (0.56–1.48 nAm/mm2), guinea pig hippocampus (0.30–1.34 nAm/mm2), and swine neocortex (0.18–1.63 nAm/mm2), rat neocortex (~2.2 nAm/mm2), monkey neocortex (~0.40 nAm/mm2) and human neocortex (0.16–0.77 nAm/mm2). Thus, there appears to be a maximum value across the brain structures and species (1–2 nAm/mm2). The empirical values closely matched the theoretical values obtained with our independently validated neural network model (1.6–2.8 nAm/mm2 for initial spike and 0.7–3.1 nAm/mm2 for burst), indicating that the apparent invariance is not coincidental. Our model study shows that a single maximum value may exist across a wide range of brain structures and species, varying in neuron density, due to fundamental electrical properties of neurons. The maximum value of qprimary may serve as an effective physiological constraint for MEG/EEG inverse solutions.
Keywords: magnetoencephalography, electroencephalography, neural current MRI, neuroenergetics, current source density analysis, inverse solution
Introduction
Anatomical constraints are informative in neuroimaging research. It is well known that the estimation of cortical activity based on inverse solutions of magnetoencephalography (MEG) or electroencephalography (EEG) data is not unique (cf. Hämäläinen et al., 1993). Such constraints have been shown to be effective in constraining the inverse solutions. A practical approach is to let neural generators of MEG and EEG signals be confined within the cortical mantle and to further constrain the sources to be oriented perpendicular to the cortical surface (Dale and Sereno, 1993; Dale et al., 2000). Very few studies have, however, thus far used physiological constraints for solving the inverse problem.
We report here one constant that may prove to be an effective physiological constraint in solving the inverse problem. In MEG and EEG, the current generator is described by an equivalent current dipole Q. Its moment Q is customarily expressed in units of nAm. The moment is quite variable, varying by as much as three orders of magnitude, across many experimental conditions. The density q is defined as q = Q/θ in units of nAm/mm2, where θ is the surface area of the active cortical volume. Since this density is independent of size of active tissue, it is more uniform than Q and may serve as a physiological constraint.
The value of q has been estimated from an estimate of moment Q determined experimentally and an estimate of the cross-sectional area θ (e.g. turtle cerebellum - Okada and Nicholson, 1988; Okada et al., 1989; guinea pig hippocampus - Murakami et al., 2002, 2003; swine neocortex - Okada et al., 1996; and monkey visual cortex - Lü and Williamson, 1991). The straightforward method of estimating q according to this definition is problematic because it does not necessarily estimate the qprimary strictly due to neuronal currents. The value of q may differ from the value of qprimary because measured MEG signals may be reduced by the finite size of the detection coil and distorted by the so-called secondary sources that are present at each boundary surface separating regions of differing electrical conductivity (Geselowitz, 1970, 1973; Geselowitz and Grynszpan, 1973; Plonsey, 1972). Thus, these possible effects must be taken into account in order to estimate qprimary itself. These possible distortions have been known for a long time, but most studies have reported the uncorrected empirical values. We asked whether the range of qprimary is smaller and more uniform than the range of q across the brain structures when these distortions are removed.
We found a remarkable level of uniformity in mean and maximum values of qprimary across the neocortex of swine, the hippocampus of guinea pig and the cerebellum of turtle in the experiments carried out in our laboratory. These values matched the value of qprimary previously computed for the monkey visual cortex by Lü and Williamson (1991). We then estimated qprimary in the neocortex of rat and human based on previous MEG studies by others. These comparisons for the first time showed that the qprimary is remarkably invariant in the 6-layer neocortex of rat, monkey, pig, and man. Moreover, they were similar to those for the 3-layer hippocampus of guinea pig and cerebellum of turtle.
These results motivated us to test whether the uniformity of qprimary was coincidental or represents an invariance due to fundamental electrophysiological properties of neurons. We tested this question using a mathematical neural network we previously validated on an independent set of data (Murakami et al., 2002, 2003). Significantly, we found that the maximum empirical values of qprimary quantitatively matched the theoretical maximum values of qprimary under a few simplifying assumptions. This was obtained without any manipulations of the model parameters previously estimated from an independent set of empirical data, suggesting that the empirically observed invariance reflects conservation in fundamental electrophysiological properties of neurons.
The uniformity of qprimary led to a question of whether this invariance is due to a conservation of a more fundamental quantity, namely metabolic energy consumption in neuronal tissues. Metabolic energy is required to repolarize the transmembrane potential after the initial depolarization during neuronal activity. The restoration of imbalance in intracellular concentrations of Na-K ions requires consumption of adenosine triphosphates (ATPs). The NaK-ATPase is responsible for most of the cell’s energy expenditure (Hasenstaub et al., 2010; Laughlin and Sejnowski 2003; Atwell and Laughlin 2001; Laughlin et al., 1998). We conjectured that this uniformity of qprimary reflects the conservation of energy consumption during the evolutionary process to protect the brain of different species during neuronal processing. We used the same simple model above with the same set of simplifying assumptions to test a hypothesis as to whether the number of ATPs consumed per cross-sectional area of a cortical tissue per unit time (ATP/mm2-s) is invariant of cell size and density as for qprimary.
This report then has three parts: (1) our meta-analysis of empirical values of qprimary and finding of an apparent invariance of maximum qprimary due to primary neuronal currents; (2) a theoretical analysis of the basis for this result and finding of a quantitative match of the empirical and theoretical values of maximum value of qprimary; and (3) a theoretical study of variation in metabolic energy consumption per single bursts of synchronized population activity with cell size and density and finding that the energy consumption decreases inversely with cell radius/density. We discuss the significance of these results for neuroimaging.
Materials and Methods
1. Empirical analysis of current dipole moment density qprimary
Experimentally determined values of the current dipole moment density q were used to estimate the value of qprimary. Here we briefly describe our methods for estimating qprimary. The appendix presents the details of our method and describes the specific procedures for correcting for these two types of distortion in the three preparations we have studied – in vitro turtle, in vitro guinea pig hippocampus and in vivo pig neocortex. In this text throughout, the variables in bold face refer to vector quantities and those in plain face refer to scalar quantities. Appendix Table 2 provides the definitions of all the symbols used in this paper for clarity.
(a) Attenuation of actual field by finite size of magnetic field detection coils
The magnetic field B is commonly measured with a superconducting detection coil of a finite radius when the measurements are based on an MEG system using superconducting quantum interference devices (SQUIDs). The B field threads through the plane of the coil and introduces a change in current within the coil, which is detected by a SQUID inductively coupled to the coil. Thus, a finite-size detection coil measures a spatial average of the B field, attenuating the peak field. This attenuation effect has been analyzed by Williamson and Kaufman (1981) for current dipoles; they calculated the attenuation as a function of radius of the detection coil and depth of the dipole below the sensing surface. The equation for this correction is presented in Appendix for the benefit of the readers since the above reference is not easily available. We used Fig. 6 in their publication to estimate the actual strength of the B field in each preparation. Jazbinsek et al (1989) carried out a similar calculation for higher poles.
(b) Distortion by secondary sources at conductivity boundaries
The B field measured outside a volume conductor is a sum of the Bprimary field produced by a neuronal tissue of interest and the Bsecondary field due to each conductivity boundary separating two conductive media of differing electrical conductivities. The single equivalent current dipole responsible for Bprimary is denoted as Qprimary. Each source of Bsecondary field at each boundary is called secondary source; this source can be represented by a single equivalent current dipole Qsecondary (Huang et al., 1990). Each Qsecondary is directed perpendicular to the boundary surface: Qsecondary = VΔσdS, where V is the potential on the surface with a surface vector dS and Δσ = σregion1 − σregion 2 is the difference in conductivity across the boundary surface separating two regions with the Qprimary in region 2 and dS is the surface normal (Plonsey 1972; Plonsey 1981). We have previously computed the strength of Bsecondary relative to the Bprimary as a function of Δσ and distance between Qprimary and a given boundary (Huang et al., 1990). The estimates are based on a boundary element method (BEM) analysis of the conductivity geometry of a turtle cerebellum in a bath. We used the parametric results in Fig. 7 of our previous work (Huang et al 1990) to estimate Qsecondary/Qprimary.
All the tissues were assumed to be homogeneous in electrical conductivity. Previously, we have experimentally determined the tissue conductivity in the turtle cerebellum and found that the extracellular conductivity σe along the depth is inhomogeneous (0.25 ± 0.05 S/m for the molecular layer and 0.15 ± 0.03 S/m for the granular layer) (Okada et al 1994a). The ratio σemolecular/σegranular, however, is small enough to be ignored for the present analysis since the ratio Bsecondary/Bprimary is ~10% for this ratio (1.67) (Fig. 7, Huang et al 1990). The conductivity in the hippocampus (CA1 and CA3) is homogeneous across the stratum radiatum and pyramidale based on the measurements carried out by McBain et al (1990). [The conductivity is given by σsalineα/λe2, where α is the extracellular volume fraction and λe is the tortuosity of the extracellular microenvironment (Gardner-Medwin 1980). The hippocampus is electrically homogenous based on the measured values of α and λe (McBain et al 1990).] The conductivity in the rat barrel column differs across layers but the variation is within 10% of each other (Goto et al 2010). The conductivity in the monkey primary visual cortex is homogeneous (Logothesis et a 2007). Thus, these tissues are homogeneous along the depth for our present purpose.
2. Theoretical study of basis of the apparent empirical invariance in qprimary
Summary of the cortical network model
The analysis was carried out using an empirically validated mathematical model of neuronal networks (Murakami et al., 2002, 2003). In this model, which is based on the model of Traub and Miles (1991), each pyramidal neuron is represented by a single cylinder with 8 compartments for the basal dendrites, 1 compartment for the soma, and 10 compartments for the apical dendrites. Each cell has six types of voltage and/or calcium sensitive conductances, each distributed along the compartments, and two types of excitatory receptors (AMPA and NMDA) and two types of inhibitory receptors (GABAA and GABAB). The inhibitory neurons are represented also as a cylinder with the same number of compartments. However, these cells have only two types of conductance – a sodium conductance and a potassium conductance of direct rectifier type, both located only in the soma. Two types of excitatory and one inhibitory receptor type are located only in the soma. These excitatory and inhibitory neurons are connected to each other with a connectivity matrix: Each of the inhibitory neurons receives synaptic inputs from 20 out of 100 randomly selected excitatory neurons and each excitatory neuron receives inputs from 20 inhibitory neurons. This model was shown to provide quantitatively accurate accounts of three types of data obtained from hippocampal slices – intracellular data from the pyramidal cells, extracellular potentials and magnetic field outside the tissue – within a single theoretical framework (Murakami et al., 2002). The model was used to compute Qprimary and qprimary during single bursts of synchronized evoked neuronal activity as a function of cell diameter.
Estimation of Qprimary and qprimary for model neurons varying in cell diameter
An extracellular stimulation was applied and the evoked intracellular potentials were calculated in the model excitatory neurons as described in Murakami et al. (2002). The value of evoked Qneuron for each excitatory neuron was computed by calculating the longitudinal current generated in each compartment k of each cell as a result of the opening of the voltage-dependent active conductances as Qk = jkakhk, k = 1 to 19, jk= current density along the longitudinal axis, ak = cross sectional area and hk = length of compartment k. The Qk’s were summed along the length of each cylindrical model neuron to compute the Qneuron for each single neuron. Diameters of the model neurons were changed in order to study effects of different diameters on Qneuron per single bursts of population activity. The diameters of dendrites were multiplied by common factors and the diameter of soma was correspondingly adjusted using Rall’s 3/2 rule. The volume fractions were 6% for the blood vessels, 20% for the extracellular volume fraction, 37% for glial cells, 4% for inhibitory cells and 33% for excitatory cells (Atwell et al., 2001). The total volume of pyramidal cells was equated with 33% of the entire tissue volume for all cell sizes. The total tissue volume was assumed to be in rectangular parallelepiped shape and the area of the basal plane was calculated assuming that the total tissue volume had the same height as the pyramidal cell. Interneurons and glial cells were incorporated into extracellular space in the volume calculation for simplicity. The density qprimary over the entire tissue volume was calculated as: qprimary = Qneuron/θneuron, dividing Qneuron per single pyramidal cell by the area θneuron of the basal plane for single pyramidal cells (θneuron = θ/N, surface area of the active cortex divided by the number of active neurons in the volume).
3. Estimation of INa and number of ATPs consumed during single bursts of population activity
We used the same mathematical model to study how the invariance in qprimary under an assumption of maximum synchrony is related to metabolic energy consumption in the same volume of tissue during synchronized population activity. The energy consumption was estimated by the number of ATPs consumed per cross-sectional area of the model cortex over a unit time (ATP/mm2-s) during single bursts of synchronized evoked activity. The sum of sodium current (INa) was calculated by integrating INa currents in the model through membrane in all compartments of a single pyramidal cell up to three time points of a single burst (7, 32 and 100 ms) (see Murakami et al., 2003 for details). The Na-K pump moves three Na+ ions out of the cell for every two K+ ions pumped in. INa was converted to the number of ATP used per second (NATP) by using the following equation: NATP = INa/3e, where e is the charge per electron.
Results
1. Empirical estimates of neuronal primary current dipole moment density qprimary
Figure 1 shows the values of q (Fig. 1A) and qprimary estimated from empirically measured B fields (Fig. 1B). The values of q in Fig. 1A are those before applying the two types of correction and those in Fig. 1B are after correcting for effects of attenuation by a finite-size coil and secondary sources for the three types of preparations studied in our laboratory. The q is much higher for turtle cerebelli (2.52 ± 0.99 (1SD) nAm/mm2) compared to guinea pig hippocampal slices and swine SI cortex (0.46 ± 0.26 and 0.50 ± 0.32 nAm/mm2, respectively). The corrections for the two types of distortions greatly reduced the differences and the values of qprimary are quite uniform across the three preparations. The corrected values were 1.07 ± 0.41 nAm/mm2 for turtle cerebellum in vitro, 0.67 ± 0.37 nAm/mm2 for guinea pig hippocampal slices and 0.84 ± 0.42 nAm/mm2 for swine SI cortex in vivo. The corrections reduced the mean from 2.82 to 1.07 nAm/mm2 for turtle cerebellum, while it increased the mean from 0.46 to 0.67 and from 0.50 to 0.84 nAm/mm2, respectively, for the hippocampus and SI cortex. There was some variability in the value of qprimary as shown in Appendix Table 1. This variability reflects the fact that the value of qprimary depends on the effectiveness of stimulation in producing synchronous population activity, which depends on the exact placement of the stimulating electrodes in the tissues. However, the maximum values of qprimary were quite uniform across the preparations: 1.61, 1.34 and 1.63 nAm/mm2, respectively. A one-way ANOVA gave no statistically significant effect of animal types on the means (F =2.05, p = 0.15, df =2/23).
Fig. 1.

Current dipole moment density in three different preparations. (A) Empirically determined values of q based on measured MEG data. (B) qprimary due to primary neuronal currents. Appendix Table 1 shows the numerical data.
Figure 2 presents the average and range of qprimary for swine neocortex, guinea pig hippocampus and turtle cerebellum reported above and those for the neocortex of rat, monkey and humans based on the work of others. The qprimary estimated by Lü and Williamson (1991) for the data reported by Mitzdorf and Singer (1979) was 0.39–0.40 nAm/mm2 for the monkey in a condition where the population activity was evoked by an electrical stimulation of the optic chiasm. Lü and Williamson (1991) also estimated qprimary for visually evoked responses in the visual cortex of cat. In this case the maximum value was 0.14 nAm/mm2, lower than the electrically evoked responses. The difference is most likely due to the degree of synchrony of population activity. The estimates for the human cerebral cortex are based on our analysis of the data reported by Oishi et al. (2002). They estimated Q based on MEG for interictal spikes from the frontal lobe (patient 1: 137 ± 72 nAm) and temporal lobe (patient 2: 275 ± 151 nAm). We estimated the cross sectional areas of active tissue in their study from the distribution of number of active electrodes for patient 1 and 2, following their method: 4.0 and 5.5 cm2 for patients 1 and 2, respectively (see Appendix for detail). The values of qprimary in their case ranged from 0.16 to 0.52 nAm/mm2 for patient 1 and 0.22 to 0.77 nAm/mm2 for patient 2. The single value of qprimary for the rat was estimated from the value of Qprimary determined by Riera et al. (2012) for a case where one single barrel field was activated by a whisker stimulation. This value of 2.2 nAm/mm2 is about twice as as high as the rest of the values. This anomalous value of qprimary, however, is consistent with the rest of the data since the large value is due to the presence of two current-sink source pairs along the depth of the barrel column in the rat. The maximum value of qprimary for a single current-sink source pair appears to be about 1–2 nAm/mm2.
Fig. 2.
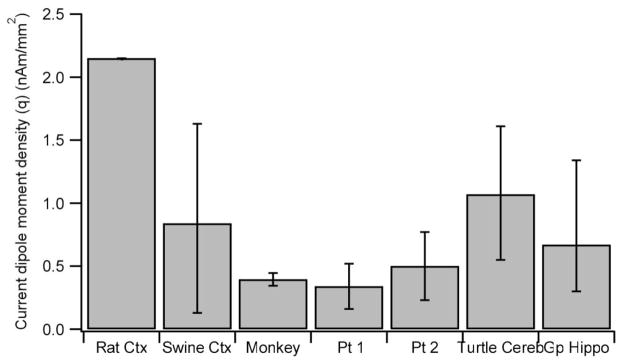
Current dipole moment density due to primary neuronal currents (qprimary) in the neocortex of several species, turtle cerebellum and guinea pig hippocampus. Mean and range are shown for swine SI cortex, cerebellum and hippocampus, monkey visual corte and human epileptogenic cortex (Pt 1 – frontal cortex, Pt 2 – temporal cortex). Single estimates of maximum qprimary for rat barrel SI cortex.
2. Simulation results for Qprimary and qprimary versus cell diameter
Given these empirical results, we searched for factors that could explain this apparent invariance of qprimary. The Qneuron for each neuron was earlier defined as a sum of the elementary dipoles in all the compartments of the neuron. When there is only one sink-source pair in a neuron, the Qneuron for each neuron can be defined alternatively as: Qneuron = jneuronaneuronLneuron, where jneuron is the intracellular current density between the current sink and source, aneuron is cross-sectional area of each neuron and Lneuron is the distance between the current sink and source. The total Qprimary for the entire active tissue is then: Qprimary = ΣjneuronaneuronLneuron summed over all the active neurons in the active tissue. In a very simplified case where jneuron and Lneuron are identical across all neurons in the population, Qprimary = jneuronLneuronΣaneuron. In this case, Qprimary is completely independent of cell size since the volume fraction of active neurons (ε = Σaneuron/θ) is independent of cell size.
There is support for this assumption that the volume fraction of active neurons ε is constant across brain structures and species. This fraction is the proportion of active excitatory neurons in the intracellular volume. The extracellular volume fraction α, and thus the intracellular volume fraction, is conserved across the evolutionary scale with a value of around 0.2 (Sykova and Nicholson, 2008). The proportion of pyramidal cells appears to be nearly constant (Sloper et al., 1979; Winfield et al., 1980). Thus ε should be nearly constant. We therefore hypothesized that the uniformity of estimated qprimary reflects this conservation of ε. Although this is hypothesis is based on a grossly simplified set of assumptions, it provides an insight into the basis for this uniformity.
We tested this hypothesis using the mathematical neuronal network described above, which was previously empirically validated. As mentioned in Materials and Methods, we computed the values of Qprimary and qprimary as a function of neuron radius, while holding constant the passive membrane properties and active properties of ion- and ligand-gated channels and the volume fraction of active excitatory neurons. The diameter of the model neurons was varied over a range of 30 to represent the known variation in cell size and dendritic arborization of the pyramidal and Purkinje cells (Fiala et al., 2008).
Figure 3 shows the intracellular potential (Vin) for model neurons of varying size. The magnitude and temporal waveform of Vin were quite comparable to each other across a wide range of cell radius, although the spike amplitude tended to be larger for smaller cells (Fig. 3A, left). The Qneuron for any single cell was a function of cell diameter because Qneuron depends on cross-sectional area aneuron of the neuron (Fig. 3A, right). Figure 3B quantifies this result for the first spike and burst of the model neurons directly activated by the extracellular stimulation.
Fig. 3.

(A) Intracellular potential (Vin) and current dipole moment (Qprimary) of a single excitatory model neuron directly stimulated by an extracellular stimulus for a range of cylinder cell radius (left label). Model slice was stimulated with a bipolar pulse (− apical dendrite and + soma) (cf. Murakami et al., 2002). (B) Amplitudes of the first spike (continuous line) and burst (dotted line) of Qprimary as function of equivalent neuron radius.
In contrast to Qneuron, qprimary was nearly independent of cell radius (Fig. 4). Figure 4A and B show that the value of qprimary was nearly the same when the volume fraction of excitatory neurons was held constant. Figure 4 shows two noteworthy results. First, the theoretical values of qprimary for the initial spike (1.6–2.8 nAm/mm2) and for the burst (0.7–3.1 nAm/mm2) were within the same range of values as the empirically observed maximum values of qprimary (1.6, 1.3, 1.6, 2.2, 0.40, and 0.77 nAm/mm2, respectively, in turtle cerebellum, guinea pig hippocampus, swine primary somatosensory cortex, rat barrel cortex, monkey visual cortex and human neocortex, respectively). This is remarkable since model parameters were not adjusted to fit to the empirical data. The parameters were those used to obtain the fit to three sets of empirical data (Murakami et al., 2002). The theoretical value of qprimary is for the case of completely synchronous evoked activity. Thus, this value should represent maximum values of qprimary. The fact that the empirical maximum values of qprimary match the theoretical maximum values indicates that the invariance in the empirical value is not coincidental, but reflects an invariance that holds when the underlying electrophysiological properties are conserved across brain structures and species. Second, the invariance holds for model neurons nearly across the entire range of equivalent cell radii (0.3–9 μm) varying over a factor of 30, although qprimary for the burst slightly depends on cell radius, suggesting that this invariance may hold for a wide range of neuronal tissues containing cells of varying sizes.
Fig. 4.

(A) Invariance of qprimary for model neurons for a range of equivalent cell radius (left label). (B) qprimary of the first spike (continuous line) and burst (dotted line) as a function of radius of model neurons. Assumes constant volume fraction fraction ε.
3. Metabolic energy consumption per single burst of neuronal activity versus cell diameter
We tested the specific hypothesis as to whether the number of ATPs consumed per cross-sectional area of a cortical tissue per unit time (ATP/mm2-s), represented by a variable m, is invariant of cell size and density. We first computed the Na-current entering a single pyramidal cell in the model. Figure 5A shows the transmembrane current carried by INa. Its value increases with cell radius since it depends on surface area of the cell containing the Na+ channel conductance. Figure 5B shows the integral of INa over the first 100 ms for model neurons of varying radius. Figure 5C shows the number of ATPs consumed in pumping the excess sodium ions per second out of the cell for 7, 32 and 100 ms after the start of the synchronous activity. The metabolic energy consumed by a synchronous single burst firing increased with cell radius. The actual magnitudes are quite close to those found by an earlier study using a different mathematical neuron model (Hasenstaub et al., 2010). This result also agrees with the increase in ATP consumption rate with cell diameter found earlier (Sengupta et al 2013). Figure 5D shows the total number of ATPs consumed by a population of synchronously firing excitatory cells assuming that the volume fraction ε was fixed at 33%. This quantity m decreased with cell radius unlike qprimary, which was invariant of cell size. However, the energy consumption is very similar across cell density when it is normalized by the equivalent radius of the population of neurons.
Fig. 5.

(A) Sodium current INa in a single excitatory cell. (B). Integral of INa over time. (C) No. of ATPs used per second for restoring the excess Na+ produced during the first 7 ms (initial spike), 32 ms (end of the burst) and 100 ms (end of synaptically activated burst) of a burst firing in a single cell. (D) Total number of ATPs used per second per a 1 mm2 crosssectional area of the model cortex up to the end of the three periods.
To understand the basis for this decrease with cell size, we computed the theoretical dependence of the metabolic energy consumption rate per a unit surface of active tissue on cell size. The density is proportional to INa since NATP = INa/3e. As above, we assume that jneuron and Lneuron are identical across all neurons. The total INa produced below a unit cortical surface area of active tissue is proportional to the sum of all the surface areas of N active neurons. In our model each such neuron has an identical radius R and height H. Thus the total surface area is 2πRNH. The total cross-sectional area occupied by N neurons is πR2N. Thus the density should be proportional to 1/R. The decrease in the density of energy consumption rate in the model has the same slope as 1/R (shown by the dashed line in Fig. 5D), indicating that the rough approximation provides an essential account of the dependence of this measure of metabolic energy consumption on cell radius for our model.
Discussion
1. Uniformity of empirically determined current dipole moment density
Our results indicate that the maximum value of the neuronal current dipole moment density (qprimary) associated with synchronous population activity is uniform across a wide range of brain structures and species ranging from the cerebellum of turtle to the neocortex of humans. We analyzed only those experimental studies in which estimates of Qprimary and active area were both available. The value of qprimary varied across experiments from 0.56–1.61 nAm/mm2 for turtle cerebellum, 0.30–1.34 nAm/mm2 for guinea pig hippocampus and 0.18–1.63 nAm/mm2 for pig SI cortex. The particular value of qprimary in any experiment depends on how a population of neurons was stimulated as mentioned earlier. The level of synchrony and number of synchronously activated neurons can vary and thus the value of qprimary may be quite low if the stimulation is not effective. Thus, the range of qprimary indicates the variability of experimental conditions. However, importantly, the maximum value of qprimary was quite uniform across the preparations in our laboratory and in the experiments carried out by other groups using a variety of brain structures. The maximum value across all the experiments analyzed was 1.61 for turtle cerebellum, 1.34 for guinea pig hippocampus and 1.63 for pig SI cortex. The means values, even though they underestimate the maximum value of qprimary under complete synchrony, were 1.07 ± 0.38, 0.67 ± 0.37, and 0.84 ± 0.42nAm/mm2 for turtle cerebellum in vitro, guinea pig hippocampal slice and swine SI cortex in vivo. Thus these two measures of qprimary both indicate a remarkable uniformity.
The maximum values of qprimary are below 1–2 nAm/mm2 for both monkeys and humans. It is 0.40 nAm/mm2 in monkey visual cortex (Lü and Williamson, 1991). The estimate is based on the CSD analysis of the evoked responses in Area 17 of the monkey produced by electrical stimulation of the optic chiasm (Mitzdorf and Singer, 1979), not on MEG data. Thus none of the corrections for MEG were applied. The lower value could be due to cancellation by opposing dipoles. The maximum density is 0.77 nAm/mm2 in two patients with epilepsy (Oishi et al 2002). This lower value could be due to imperfect synchronization of the epileptiform neurons.
However, the qprimary was larger than 2 nAm/mm2 for rats (2.2 nAm/mm2 for rat barrel columns). We believe this anomaly is due to activity in two synchronously active populations of neurons in different layers. In the study by Riera et al. (2012), two current-sink source pairs, both directed superficially, became active contemporaneously with similar magnitudes. Thus, this high value is consistent with the maximum value of 1–2 nAm/mm2 found in those cases with a single predominant current-sink source pair. In the study by Ikeda et al. (2005), there were two current dipolar sources oriented toward the same direction as in Riera et al. (2012), but the supragranular dipolar source was twice as strong as the infragranular source. Correspondingly, the maximum value of qprimary for the swine (1.63 nAm/mm2) was less than in the rat. In summary, the maximum value of qprimary appears to be 1–2 nAm/mm2 across the brain structures and species examined here, when the current distribution is predominantly dipolar along the depth of cortex in any active region.
It would be important to provide additional supportive empirical evidence for this conclusion by estimating the qprimary in a larger number of brain structures and species. Although the studies reviewed here cover a period of 20 years, the number of cases is still small and additional studies would be useful in light of the potential significance of this invariance.
2. Theoretical basis for invariance of current dipole moment density
Our theoretical analysis indicates that this remarkable uniformity is not coincidental, but reflects an invariance in qprimary that holds across brain structures and species when neuronal activity is synchronous within a region of active tissue. According to Fig. 3, qprimary was approximately 1.6–2.8 nAm/mm2 for the first spike and 0.7–3.1 nAm/mm2 for the burst. They represent the maximum value of qprimary that can be produced by completely synchronous activation of a network of neurons evoked by an extracellular stimulation. The empirical values have a maximum of 1–2 nAm/mm2, even for the rat barrel cortex when we compensate for the presence of two current dipoles at two depths pointing to the same direction. Thus, there is a quantitative agreement between the theoretical and empirical maximum values of qprimary, even though we did not manipulate the model parameters to obtain this match. We, therefore, propose that there is an invariance in maximum value of qprimary across brain structures and species.
The quantitative agreement was obtained with a model based on a set of very simplifying assumptions, i.e. all the neurons in an active tissue are identical in diameter, passive cable properties and active conductances and the volume fraction of active excitatory neurons ε are all conserved across species and brain structures. Although this is a very strong simplifying assumption, the quantitative agreement indicates that the simple model is sufficient for understanding the biophysical basis of the apparent empirical invariance. It provides insights into the observed uniformity of qprimary across the brain structures varying in cell density.
Since our conclusions depend on our simplifying assumptions, we consider their validity. We have already reviewed the empirical basis for uniformity of the ε. The remaining key factor in our model prediction is the assumption that the product jneuronLneuron is conserved. Our analysis below indicates that this assumption may be sufficiently accurate for understanding the invariance in qprimary.
Both intracellular current density jneuron and sink-source distance Lneuron depend on specific membrane resistivity Rm, specific membrane capacitance Cm and internal axial resistivity Ri. According to the cable theory, jneuron = (−1/Ri) ∂Vin/∂Z, where ∂Vin/∂Z is the gradient of the intracellular potential along the longitudinal axis of the cell. One could assume Lneuron as the distance between the point of current injection into a dendrite (or axon) and the point where the intracellular potential due to this current decays to 1/e of the maximum value. In this case, Lneuron = λ/((1+(1+ϖ2τ2)1/2)/2)1/2, where λ = √(R/2)(Rm/Ri) is the electrotonic length constant, ϖ is the angular frequency of the signal, τ = RmCm is membrane time constant and R is equivalent radius of a neuronal process (e.g. dendrite) (Traub and Miles, 1991, p. 82). As a first approximation, jneuronLneuron ~ (ΔVin/L)L = ΔVin, where we approximate the derivative by a discrete difference in Vin across the distance L. Thus, this product may be independent of cell size.
We examined the parameters governing Lneuron to obtain insights into the validity of this approximation. L depends on many variables: R, Rm, Cm and Ri. Cm and Ri are fairly constant across neurons in different species (Gentet et al., 2000; Roth and Häusser, 2001). Cm is in the range of 0.75 –3 μF/cm2, whereas Ri is in the range of 100–200 Ω-cm (Roth and Häusser, 2001; Traub et al., 1994, 2005, 2008). Rm, however, varies within and across neurons (Gullledge et al., 2005). Rm is much higher for dendrites and soma compared to axons. Traub et al. (2008) assumed Rm = 50 kΩ-cm2 for dendrites, 10 kΩ-cm2 for soma and 2 kΩ-cm2 for axons of the Purkinje cells. The intracellular currents we are considering in the present analysis are primarily located in the dendrites, not in the axons. Thus, the value of Rm may be closer to 50 kΩ-cm2 without synaptic inputs. This value provides a quantitatively accurate account of the behavior of glutamatergic neurons (i.e. pyramidal cells) in the hippocampus (Traub et al., 1994) and neocortex (Traub et al., 2005) and Purkinje cells in the cerebellum (Traub et al., 2008). The value of Rm also depends on the amount of spontaneous synaptic input onto each neuron; its value may be as low as 10–20% of the value without synaptic inputs (Destexhe and Pare, 1999; Bernander et al., 1991). Thus, the product jneuronLneuron may depend on cell radius R if the variability in Rm is independent of R.
Since Lneuron depends on many factors, we have checked the variability of empirically determined values of Lneuron. This value is 175–300 μm based on current source density (CSD) analysis for turtle cerebellum (Okada et al., 1989; Lopez et al., 1991), 200–300 μm based on a laminar potential analysis of guinea pig hippocampus (Kyuhou and Okada 1993), 300–500 μm based on CSD analysis for rat barrel column (Riera et al., 2012), 450 μm based on CSD analysis for swine SI cortex (Ikeda et al., 2005), and 150–250 μm based on CSD analysis for monkey visual cortex (Mitzdorf and Singer, 1979). Lneuron varies only by a factor of 2–3 comparable to the variability of Cm and Rm.
Thus, the product jneuronLneuron may be fairly uniform (i.e. varying by a factor of 2–3) across the neurons of varying types if the intracellular potential gradient ∂Vin/∂Z is constant across cell types. The potentials do vary across the entire extent of the dendrites and soma, depending on the distribution of active voltage-sensitive conductances. However, depolarization in dendrites due to synaptic inputs normally open the low-threshold Na+ channel in the initial segment and they produce large potentials that propagate across the dendrites – as described in detail in Murakami and Okada (2006). Amplitudes and waveforms of spikes and bursts are generally similar across neurons, although there are regional variations within each neuron (hippocampus -Traub et al., 1994, neocortex – Traub et al., 2005, cerebellum – Traub et al., 2008).
The above analysis indicates then that our two basic assumptions, namely conservation of ε and jneuronLneuron, may be sufficiently accurate for the purpose of understanding the invariance of qprimary.
3. Possible relationship between conservation of qprimary and conservation of anatomical properties of neocortices, hippocampus and cerebellum
Our result suggests that the qprimary is conserved across the cortical columns over a wide range of species since anatomical properties of the cortical column are highly conserved across the neocortices of rat, swine, monkey and human (Mountcastle, 1997, 1998). Each column is quite uniform in thickness, which varies by a factor of only one to four from mouse to humans with a nearly constant thickness for brain volumes >3 cm3, even though the surface of the neocortex increases by a factor of about 1,000 or more. The number of neurons is 70–80 neurons per minicolumn (0.022 mm2 in cross sectional cortical surface area) from mouse to human, corresponding to about 113,000 neurons/mm2 of which about 70% are pyramidal neurons.
The uniformity of maximum value of qprimary across the 6- and 3-layered cortices is surprising since the neuronal density differs by an order of magnitude across these brain structures. The cellular organization is conserved in the hippocampus (Andersen et al., 2007) and cerebellum (Ito, 1984) with a very similar cellular circuit within each volume across species. But, the neuronal density is much less in these structures compared to the neocortex. The density of neurons within the stratum pyramidale is 23,000/mm3 and 22,000/mm3, respectively, in human CA1 and CA3 (Mathern et al., 1996; Howe et al., 2010). The number of pyramidal cells below a 1 mm2 surface area is less than 12,000 in the CA1 and 7,000 in the CA3, since not all the neurons are pyramidal cells. The Purkinje cells have an average cell diameter of 25 μm (Fiala et al., 2008). There are about 2–3 Purkinje cells along the direction perpendicular to cortical surface in the cell layer. The number of Purkinje cells below a 1 mm2 surface area of the cerebellum is 3,000–5,000. These cell densities are about one order of magnitude less than the density of pyramidal neurons in the neocortex. According to our simple model, however, this invariance across the 6- and 3-layered structures can be explained by the invariance of qprimary with respect to neuronal size and density.
4. Conservation of metabolic energy consumption
Both the current dipole moment density qprimary and metabolic energy consumption increase with cell diameter (Figs. 3 and 5C). This can be explained by the fact that the former depends on cross sectional area of each cell, whereas the latter depends on surface area of each cell. Sengupta et al (2013) also computed the energy consumption measured in NATP/s and found the same relationship. The values of NATP/s were in the same range as ours for a similar range of model cell diameters.
In contrast, the density of these parameters behaves in a very contrasting manner. According to our model, qprimary is independent of cell radius as long as the volume fraction and product jneuronLneuron are constant across neurons: qneuron ∝ jneuronLneuronε. The density m of the energy consumption rate, on the other hand, decreases with cell radius (Fig. 5D). This new finding is contrary to our initial conjecture, but the relationships calculated with the model matches the slope of the simple relation based on our qualitative analysis: m ∝ 1/R. In other words, the density m is conserved across cell sizes only when it is normalized by cell size. This implies that a comparative analysis of metabolic energy consumption across brain structures and species needs to take into account the equivalent cell diameter of each neuronal tissue. This result on energy consumption also implies that any analysis of energy consumption across the entire brain of any species should take into account average cell diameter and density in each region in order to be able to compare their relative consumption rates.
Our energy density result also suggests that there may be an optimal average cell size for information processing versus energy consumption. It is known that smaller neurons are more efficient in information coding, measured in terms of bits/ATP and NATP/spike (Sengupta et al 2013). On the other hand, our results shows that, for a neuronal tissue with a fixed volume fraction of excitatory neurons, a population of neurons containing larger cells requires less energy during single bursts of population activity. Thus there may be an optimal equivalent neuron diameter for a population of neurons that balances the efficiency of information coding and energy consumption.
5. Maximum current dipole moment density as physiological constraint for inverse solutions
The maximum value of qprimary may be useful as a physiological constraint in obtaining inverse solutions for MEG and EEG data. As it was the case for the anatomical constraints introduced for solving the MEG/EEG inverse problem, we anticipate that this physiological constraint has important potential benefits. Here we discuss three such applications.
One of the basic questions has been whether MEG or EEG can be used to estimate the size of active area. When a single equivalent current dipole Q is used to represent the generator of MEG or EEG signals, it is not known whether a strong moment Q represents activation of a large area or a stronger neural current in a smaller area. For example, consider the transcutaneous electric stimulation of peripheral nerves. In this case one may assume that the level of synchrony is high and a large fraction of excitatory neurons receiving the projection from the nerve becomes active. The value of Q in such a case is typically 10–50 nAm (Kimura et al., 2008; Stephen et al., 2010; Sutherland and Tang, 2006; Theuvenent et al., 2005). If we constrain the maximum value of qprimary to be 1 nAm/mm2, the active tissue must be at least 10–50 mm2 in cross-sectional area, not a point source as assumed by the equivalent current dipole representation of the generator. The level of synchrony may be also high in the cortical responses produced by laser stimulation of nociceptors. In this case Q is 16–153 nAm in one study (Baumgartner et al., 2011). This implies that the stimulation activates a very large cortical area of as much as 153 mm2 or more if the secondary sources can be ignored, again a fairly extensive area. The epileptiform response reported by Oishi et al. (2002) gave mean Q of 137 and 275 nAm for two patients. If qprimary is indeed 1 nAm/mm2, these values of Q imply that the minimum size of active tissue was 137–275 mm2. The qprimary was <1–2 nAm/mm2 in our hippocampal slice study where GABAA channels were blocked by picrotoxin, which mimicks an epileptiform tissue (Okada et al 1997; Wu and Okada 1998). Thus, this estimate of minimum active area may be valid. The size of epileptiform tissue may be useful for understanding the basic physiology of epileptiform activity in human patients and also for guiding the extent of neurosurgical removal of tissue.
The maximum value of qprimary may be also useful for MEG/EEG inverse solutions based on extended source models. In a preliminary study, we showed that constraining the maximum value of qprimary in the cortex significantly improves the estimation of active regions based on the minimum norm estimation (MNE) procedure (http://www.martinos.org/mne/). The MNE solution using the L2 norm constrained by a maximum value of qprimary = 1 nAm/mm2 was superior to the standard MNE without this constraint in estimating the current distribution of a simulated extended source placed in the human somatosensory cortex (Luessi et al., 2012).
This physiological constraint may be most effective for sparse cortically-constrained solutions, i.e. L1 estimates, mixed-norm estimates, and optimally sparse L0 estimates (Hämäläinen, personal communication). The maximum value of qprimary could help establish the extent of the cortical current distribution. In the absense of such constraint, these sparse solutions tend to be very focal so that the maximum value of qprimary may be exceeded. Thus, the maximum value of qprimary may be useful in estimating the extents of cortical activity using the L0 in MEG.
6. Implications for neural current MRI
The maximum value of qprimary has potential benefits in other areas of neuroscience. For example, it can be used to guide the development of MRI for directly estimating the distribution of neural currents in various species. Using the gradient-echo technique, the local magnetic field ΔB produced by a synchronized population activity of neurons can be estimated from the phase shift ΔΦ in water proton precession, using the following basic equation: ΔΦ = γ TEΔB, where γ is gyromagnetic ratio of hydrogen and TE is the echo time. The primary current density Jprimary in the population of neurons can be calculated from ΔB using the Biot-Savart Law. Thus MRI can be used to estimate Jprimary or Qprimary (since Qprimary = Jprimarydv). We have recently reported that the ΔΦ can be measured in an isolated intact whole turtle cerebellum (Sundaram et al., 2013). In a more recent study (unpublished), we found that the gradient-echo technique can be used to estimate qprimary. This value turns out to be 0.86 nAm/mm2, thus independently confirming the values based on our MEG study. This value of qprimary is helpful in guiding the future MRI research in other brain structures in other species, eventually in humans, since the invariance in qprimary can be used to predict the amount of phase shift one can expect in these studies. Without such a constraint, it is difficult to predict whether neural current MRI is feasible in in vivo preparations.
Conclusion
The maximum values of current dipole moment density produced by primary neuronal currents in a synchronously active population of neurons are uniform across the neocortex of several mammalian species ranging from rat to human and furthermore among the neocortices and guinea pig hippocampus and turtle cerebellum. This constant is 1–2 nAm/mm2. The uniformity is not coincidental, but represents an invariance based on the conservation of electrical properties of neurons and volume fraction of excitatory neurons. We suggest that this constant can serve as an effective physiological constraint in solving the inverse problems to estimate size of active cortical areas and in understanding the basis of other neuroimaging signals such as MRI-based detection of neuronal currents. In contrast metabolic energy consumption during synchronized population activity is predicted to be higher in brain tissues packed with smaller neurons. Thus, estimates of energy consumption in any given tissue should be normalized by its cell density. This result may be important in understanding metabolic measurements in neuroimaging.
Supplementary Material
Highlights.
Physiological constaints are useful for MEG and EEG inverse solutions.
Current dipole moment density is uniform across brain structures and species.
Maximum current dipole density may be effective as a new physiological constraint.
Acknowledgments
Supported by NIH grant R01 NS21149 and NS30968 (Y. Okada). We wish to thank Dr. Matti Hämäläinen of Athinoula A. Martinos Center for Biomedical Imaging, Massachusetts General Hospital, Harvard Medical School, for discussing implications of our results for MEG/EEG inverse solutions based on his MNE algorithms, and Dr. Charles Nicholson of New York University Medical Center for his consultation on extracellular volume fraction.
Footnotes
Conflict of Interest
There is no conflict of interest in this work.
Publisher's Disclaimer: This is a PDF file of an unedited manuscript that has been accepted for publication. As a service to our customers we are providing this early version of the manuscript. The manuscript will undergo copyediting, typesetting, and review of the resulting proof before it is published in its final citable form. Please note that during the production process errors may be discovered which could affect the content, and all legal disclaimers that apply to the journal pertain.
References
- Andersen P, Morris R, Amaral D, Bliss T, O’Keefe J. The Hippocampus Book. Oxford Univ. Press; Oxford: 2007. [Google Scholar]
- Attwell D, Laughlin SB. An energy budget for signaling in the grey matter of the brain. J Cereb Blood Flow Metab. 2001;21:1133–1145. doi: 10.1097/00004647-200110000-00001. [DOI] [PubMed] [Google Scholar]
- Baumgärtner U, Vogel H, Ohara S, Treede RD, Lenz F. Dipole source analyses of laser evoked potentials obtained from subdural grid recordings from primary somatic sensory cortex. J Neurophysiol. 2011;106:722–730. doi: 10.1152/jn.00135.2011. [DOI] [PMC free article] [PubMed] [Google Scholar]
- Bernander Q, Douglas RJ, Martin KAC, Koch C. Synaptic background activity influences spatiotemporal integration in single pyramidal cells. Proc Natl Acad Sci U S A. 1991;88:11569–11573. doi: 10.1073/pnas.88.24.11569. [DOI] [PMC free article] [PubMed] [Google Scholar]
- Cohen D, Hosaka H. Magnetic field produced by a current dipole. J Electrocardiol. 1976;9:409–417. doi: 10.1016/s0022-0736(76)80041-6. [DOI] [PubMed] [Google Scholar]
- Dale AM, Liu AK, Fischl BR, Buckner RL, Belliveau JW, Lewine JD, Halgren E. Dynamic statistical parametric mapping: combining fMRI and MEG for high-resolution imaging of cortical activity. Neuron. 2000;26:55–67. doi: 10.1016/s0896-6273(00)81138-1. [DOI] [PubMed] [Google Scholar]
- Dale AM, Sereno MI. Improved localization of cortical activity by combining EEG and MEG with MRI cortical surface reconstruction: a linear approach. J Cogn Neurosci. 1993;5:162–176. doi: 10.1162/jocn.1993.5.2.162. [DOI] [PubMed] [Google Scholar]
- Destexhe A, Paré D. Impact of network activity on the integrative properties of neocortical pyramidal neurons in vivo. J Neurophysiol. 1999;81:1531–1547. doi: 10.1152/jn.1999.81.4.1531. [DOI] [PubMed] [Google Scholar]
- Fiala JC, Spacek J, Harris KM. Dendrite structure. In: Stuart G, Spruston N, Häusser M, editors. Dendrites. Oxford University Press; 2008. pp. 1–41. [Google Scholar]
- Freeman JA, Nicholson C. Experimental optim ization of current source-density technique for anuran cerebellum. J Neurophysiol. 1975;38:369–382. doi: 10.1152/jn.1975.38.2.369. [DOI] [PubMed] [Google Scholar]
- Gardner-Medwin AR. Membrane transport and solute migration affecting the brain cell microenvironment. Neurosci Res Prog Bull. 1980;18:208–226. [Google Scholar]
- Gentet LJ, Stuart GJ, Clements JD. Direct measurement of specific membrane capacitance in neurons. Biophys J. 2000;79:314–320. doi: 10.1016/S0006-3495(00)76293-X. [DOI] [PMC free article] [PubMed] [Google Scholar]
- Geselowitz DB. On the magnetic field generated outside an inhomogeneous volume conductor by internal current sources. IEEE Trans Mag. 1970;6:346–347. [Google Scholar]
- Geselowtitz DB. Electric and magnetic field of the heart. Ann Rev Biophys Bioeng. 1973;2:37–64. doi: 10.1146/annurev.bb.02.060173.000345. [DOI] [PubMed] [Google Scholar]
- Goto T, Hatanaka R, Ogawa T, Sumiyoshi A, Riera J. An evaluation of the conductivity profile in the somatosensory barrel cortex of Wistar rats. J Neurophysiol. 2010;104:3388–3412. doi: 10.1152/jn.00122.2010. [DOI] [PubMed] [Google Scholar]
- Grynszpan F, Geselowitz DB. Model studies of the magnetocardiogram. Biophys J. 1973;13:911–925. doi: 10.1016/S0006-3495(73)86034-5. [DOI] [PMC free article] [PubMed] [Google Scholar]
- Gulledge AT, Kampa BM, Stuart GJ. Synaptic integration in dendritic trees. J Neurobiol. 2005;64:75–90. doi: 10.1002/neu.20144. [DOI] [PubMed] [Google Scholar]
- Hämäläinen M, Hari R, Ilmoniemi R, Knuutila J, Lounasmaa OV. Magnetoencephalography—theory, instrumentation, and applications to noninvasive studies of the working human brain. Reviews of Modern Physics. 1993;65:413–497. [Google Scholar]
- Hasenstaub A, Otte S, Callaway E, Sejnowski TJ. Metabolic cost as a unifying principle governing neuronal biophysics. Proc Natl Acad Sci U S A. 2010;107:12329–12334. doi: 10.1073/pnas.0914886107. [DOI] [PMC free article] [PubMed] [Google Scholar]
- Howe KL, Dimitri D, Heyn C, Kiehl TR, Mikulis D, Valiente T. Histologically confirmed hippocampal structural features revealed by 3T MRI imaging: Potential to increase diagnostic specificity of mesial temporal sclerosis. Am J Neuroradiol. 2010;31:1682–1689. doi: 10.3174/ajnr.A2154. [DOI] [PMC free article] [PubMed] [Google Scholar]
- Huang JC, Nicholson C, Okada YC. Distortion of magnetic evoked fields and surface potentials by conductivity differences at boundaries in brain tissue. Biophys J. 1990;57:1155–1166. doi: 10.1016/S0006-3495(90)82635-7. [DOI] [PMC free article] [PubMed] [Google Scholar]
- Ikeda H, Leyba L, Bartolo A, Okada YC. Synchronized spikes of thalamocortical axonal terminals and cortical neurons are detectable outside the brain of piglet with high-resolution MEG. J Neurophysiol. 2002;87:626–630. doi: 10.1152/jn.00332.2001. [DOI] [PubMed] [Google Scholar]
- Ikeda H, Wang Y, Okada YC. Origins of the somatic N20 and high-frequency oscillations evoked by trigeminal stimulation in the piglets. Clin Neurophysiol. 2005;116:827–841. doi: 10.1016/j.clinph.2004.10.010. [DOI] [PubMed] [Google Scholar]
- Ito M. Cerebellum and Neural Control. Raven Press; New York: 1984. [Google Scholar]
- Jazbinšek V, Trontelj Z, Erné SN, Trahms L. Influence of the finite pickup coil size on the localization of current sources with quadrupolar components. In: Williamson SJ, Manfried Hoke M, Stroink G, Kotani M, editors. Advances in Biomagnetism. Plenum Press; New York: 1989. pp. 559–562. [Google Scholar]
- Kimura T, Ozaki I, Hashimoto I. Impulse propagation along thalamocortical fibers can b detected magnetically outside the human brain. J Neurosci. 2008;28:12535–12538. doi: 10.1523/JNEUROSCI.3022-08.2008. [DOI] [PMC free article] [PubMed] [Google Scholar]
- Kyuhou S, Okada YC. Detection of magnetic evoked fields associated with synchronous population activities in the transverse CA1 slice of the guinea pig. J Neurophysiol. 1993;70:2665–2668. doi: 10.1152/jn.1993.70.6.2665. [DOI] [PubMed] [Google Scholar]
- Laughlin SB, Sejnowski T. Communication in neural networks. Science. 2003;301:1870–1874. doi: 10.1126/science.1089662. [DOI] [PMC free article] [PubMed] [Google Scholar]
- Laughlin SB, de Ruyter van Steveninck RR, Anderson JC. The metabolic cost of neural information. Nat Neurosci. 1998;1:36–41. doi: 10.1038/236. [DOI] [PubMed] [Google Scholar]
- Logothetis NK, Kayser C, Oeltemann A. In vivo measurement of cortical impedance spectrum in monkeys: Implications for signal propagation. Neuron. 2007;55:809–823. doi: 10.1016/j.neuron.2007.07.027. [DOI] [PubMed] [Google Scholar]
- Lopez L, Chan CY, Okada YC, Nicholson C. Multimodal characterization of population responses evoked by applied electric field in vitro: extracellular potential, magnetic evoked field, transmembrane potential, and current-source density analysis. J Neurosci. 1991;11:1998–2010. doi: 10.1523/JNEUROSCI.11-07-01998.1991. [DOI] [PMC free article] [PubMed] [Google Scholar]
- Lü ZL, Williamson SJ. Spatial extent of coherent sensory-evoked cortical activity. Exp Brain Res. 1991;84:411–416. doi: 10.1007/BF00231463. [DOI] [PubMed] [Google Scholar]
- Luessi M, Okada Y, Hamalainen MS. Maximum current density constrained MEG source localization. Proc. Int. Conf. Biomagnestism; Paris. Aug. 8/26–30, 2012; 2012. p. We-6. [Google Scholar]
- Mathern GW, Babb TL, Mischel PS, Vinters HV, Pretorius JK, Leite JP, Peacock WJ. Childhood generalized and mesial temporal epilepsies demonstrate different amounts and patterns of hippocampal neuron loss and mossy fibre synaptic reorganization. Brain. 1996;119:965–987. doi: 10.1093/brain/119.3.965. [DOI] [PubMed] [Google Scholar]
- McBain CJ, Traynelis SF, Dingledine R. Regional variation of extracellular space in the hippocampus. Science. 1990;249:674–677. doi: 10.1126/science.2382142. [DOI] [PubMed] [Google Scholar]
- Mitzdorf U, Singer W. Excitatory synaptic ensemble properties in the visual cortex of the macaque monkey: a current source density analysis of electrically evoked potentials. J Comp Neurol. 1979;187:71–84. doi: 10.1002/cne.901870105. [DOI] [PubMed] [Google Scholar]
- Mitzdorf U. Current source-density method and application in cat cerebral cortex: Investigation of evoked potentials and EEG phenomena. Phys Rev. 1985;65:37–98. doi: 10.1152/physrev.1985.65.1.37. [DOI] [PubMed] [Google Scholar]
- Mountcastle VB. The Cerebral Cortex. Harvard Univ. Press; 1998. Perceptual Neuroscience. [Google Scholar]
- Mountcastle VB. The columnar organization of the neocortex. Brain. 1997;120:701–722. doi: 10.1093/brain/120.4.701. [DOI] [PubMed] [Google Scholar]
- Murakami S, Hirose A, Okada YC. Contribution of ionic currents to magnetoencephalography (MEG) and electroencephalography (EEG) signals generated by guinea-pig CA3 slices. J Physiol. 2003;553:975–985. doi: 10.1113/jphysiol.2003.051144. [DOI] [PMC free article] [PubMed] [Google Scholar]
- Murakami S, Zhang T, Hirose A, Okada YC. Physiological origins of evoked magnetic fields and extracellular field potentials produced by the guinea-pig CA3. J Physiol. 2002;544:237–251. doi: 10.1113/jphysiol.2002.027094. [DOI] [PMC free article] [PubMed] [Google Scholar]
- Murakami S, Okada Y. Contributions of principal neocortical neurons to magnetoencephalography and electroencephalography signals. J Physiol. 2006;575:925–936. doi: 10.1113/jphysiol.2006.105379. [DOI] [PMC free article] [PubMed] [Google Scholar]
- Nicholson C, Freeman JA. Theory of current source-density analysis and determination of conductivity tensor for anuran cerebellum. J Neurophysiol. 1975;38:356–368. doi: 10.1152/jn.1975.38.2.356. [DOI] [PubMed] [Google Scholar]
- Nicholson C. Theoretical analysis of field potentials in anisotropic ensembles of neuronal elements. IEEE Trans BME. 1973;20:278–288. doi: 10.1109/TBME.1973.324192. [DOI] [PubMed] [Google Scholar]
- Oishi M, Otsubo H, Kameyama S, Morota N, Masuda H, Kitayama M, Tanaka R. Epileptic spikes: Magnetoencephalography versus simultaneous electrocorticography. Epilepsia. 2002;43:1390–1395. doi: 10.1046/j.1528-1157.2002.10702.x. [DOI] [PubMed] [Google Scholar]
- Okada YC, Nicholson C, Llinas R. Magnetoencephalography (MEG) as a new tool for non-invasive realtime analysis of normal and abnormal brain activity in humans. In: Ottoson D, Rostene W, editors. Visualization of Brain Functions. Stockton Press; New York: 1989. pp. 245–266. [Google Scholar]
- Okada YC, Nicholson C. Magnetic evoked field associated with transcortical currents in turtle cerebellum. Biophys J. 1988;53:723–731. doi: 10.1016/S0006-3495(88)83153-9. [DOI] [PMC free article] [PubMed] [Google Scholar]
- Okada YC. Recent developments on the physiological basis of magnetoencephalography. In: Williamson SJ, Manfried Hoke M, Stroink G, Kotani M, editors. Advances in Biomagnetism. Plenum Press; New York: 1989. pp. 273–278. [Google Scholar]
- Okada YC, Xu C. Single-epoch neuromagnetic signals during epileptiform activities in guinea pig longitudinal CA3 slices. Neurosci Lett. 1996;211:155–158. doi: 10.1016/0304-3940(96)12740-3. [DOI] [PubMed] [Google Scholar]
- Okada YC, Huang JC, Rice ME, Tranchina D, Nicholson C. Origin of the apparent tissue conductivity in the molecular and granular layers of the in vitro turtle cerebellum and the interpretation of current source-density analysis. J Neurophysiol. 1994a;72:742–753. doi: 10.1152/jn.1994.72.2.742. [DOI] [PubMed] [Google Scholar]
- Okada YC, Lähteenmäki A, Xu C. Comparison of MEG and EEG on the basis of somatic evoked responses elicited by stimulation of the snout in the juvenile swine. Clin Neurophysiol. 1999a;110:214–229. doi: 10.1016/s0013-4694(98)00111-4. [DOI] [PubMed] [Google Scholar]
- Okada YC, Lähteenmäki A, Xu C. Experimental analysis of distortion of MEG signals by the skull. Electroenceph clin Neurophysiol. 1999b;110:230–238. doi: 10.1016/s0013-4694(98)00099-6. [DOI] [PubMed] [Google Scholar]
- Okada YC, Papuashvili N, Xu C. What can we learn from MEG studies of the somatosensory system of the swine? In: Hashimoto I, Okada YC, Ogawa S, editors. Visualization of Information Processing in the Human Brain: Recent Advances in MEG and Functional MRI. Elsevier; Amsterdam: 1996. pp. 35–46. [PubMed] [Google Scholar]
- Okada YC, Shah B, Huang JC. Ferromagnetic high-permeability alloy alone can provide sufficient low-frequency and eddy-current shieldinds for biomagnetic measurements. IEEE Trans BME. 1994b;41:688–697. doi: 10.1109/10.301736. [DOI] [PubMed] [Google Scholar]
- Okada YC, Wu J, Kyuhou S. Genesis of MEG signals in a mammalian CNS structure. Electroenceph clin Neurophysiol. 1997;103:474–485. doi: 10.1016/s0013-4694(97)00043-6. [DOI] [PubMed] [Google Scholar]
- Plonsey R. Capability and limitations of electrocardiography and magnetocardiography. IEEE Trans Biomed Eng. 1972;BME-19:239–244. doi: 10.1109/TBME.1972.324123. [DOI] [PubMed] [Google Scholar]
- Plonsey R. Generation of magnetic fields by the human body (theory) In: Erné SN, Hählbohm HD, Lübbig H, editors. Biomagnetism. de Gruyter; Berlin: 1981. pp. 177–205. [Google Scholar]
- Riera JJ, Ogawa T, Goto T, Sumiyoshi A, Nonaka H, Evans A, Miyakawa H, Kawashima R. Pitfalls in the dipolar model for the neocortical EEG sources. J Neurophysiol. 2012;108:956–975. doi: 10.1152/jn.00098.2011. [DOI] [PubMed] [Google Scholar]
- Roth A, Häusser M. Compartmental models of rat cerebellar Purkinje cells based on simultaneous somatic and dendritic patch-clamp recordings. J Physiol. 2001;535:445–472. doi: 10.1111/j.1469-7793.2001.00445.x. [DOI] [PMC free article] [PubMed] [Google Scholar]
- Sengupta B, Faisal AA, Laughlin SB, Niven JE. The effect of cell size and channel density on neuronal information encoding and energy efficiency. J Cereb Blood Flow & Metab. 2013;33:1465–1473. doi: 10.1038/jcbfm.2013.103. [DOI] [PMC free article] [PubMed] [Google Scholar]
- Sloper JJ, Hiorns RW, Powell TP. A qualitative and quantitative electron microscopic study of the neurons in the primate motor and somatic sensory cortices. Philos Trans R Soc Lond B Biol Sci. 1979;285:141–171. doi: 10.1098/rstb.1979.0003. [DOI] [PubMed] [Google Scholar]
- Stephen JM, Montaño R, Donahue CH, Adair JC, Knoefel J, Qualls C, Hart B, Ranken D, Aine CJ. Somatosensory responses in normal aging, mild cognitive impairment, and Alzheimer’s disease. J Neural Transm. 2010;117:217–225. doi: 10.1007/s00702-009-0343-5. [DOI] [PMC free article] [PubMed] [Google Scholar]
- Sundaram P, Wells W, Orbach DB, Orringer D, Balasubramanian M, Mulkern R, Okada Y. Magnetic Resonance Imaging of Neuronal Currents in an in vitro Turtle Cerebellum. Proc Intl Soc Mag Reson Med. 2013;21:418. [Google Scholar]
- Sutherland MT, Tang AC. Reliable detection of bilateral activation in human primary somatosensory cortex by unilateral median nerve stimulation. NeuroImage. 2006;33:1042–1054. doi: 10.1016/j.neuroimage.2006.08.015. [DOI] [PubMed] [Google Scholar]
- Sykova E, Nicholson C. Diffusion in brain extracellular space. Physiol Rev. 2008;88:1277–1340. doi: 10.1152/physrev.00027.2007. [DOI] [PMC free article] [PubMed] [Google Scholar]
- Theuvenet PJ, van Dijk BW, Peters MJ, van Ree JM, Lopes da Silva FL, Chen CAN. Whole-head MEG analysis of cortical spatial organization from unilateral stimulation of median nerve in both hands: No complete hemispheric homology. NeuroImage. 2005;208:314–325. doi: 10.1016/j.neuroimage.2005.06.010. [DOI] [PubMed] [Google Scholar]
- Traub RD, Contreras D, Cunningham MO, Murray H, LeBeau FEN, Roopun A, Bibbig A, Wilent WB, Higley MJ, Whittington MA. Single-column thalamocortical network model exhibiting gamma oscillations, sleep spindles and epileptogenic bursts. J Neurophysiol. 2005;93:2194–2232. doi: 10.1152/jn.00983.2004. [DOI] [PubMed] [Google Scholar]
- Traub RD, Jefferys JGR, Miles R, Whittington MA, Toth K. A branching dendritic model of a rodent CA3 pyramidal neurone. J Physiol. 1994;481:79–95. doi: 10.1113/jphysiol.1994.sp020420. [DOI] [PMC free article] [PubMed] [Google Scholar]
- Traub RD, Middleton SJ, Knopfel T, Whittington MA. Model of very fast (>75 Hz) network oscillations generated by electrical coupling between the proximal axons of cerebellar Purkinje cells. Eur J Neurosci. 2008;28:1603–1616. doi: 10.1111/j.1460-9568.2008.06477.x. [DOI] [PMC free article] [PubMed] [Google Scholar]
- Traub RD, Miles R. Neuronal Networks of the Hippocampus. Cambridge University Press; New York: 1991. [Google Scholar]
- Williamson SJ, Kaufman L. Magnetic fields of the cerebral cortex. In: Erné SN, Hahlbohm HD, Lübbig H, editors. Biomagnetism. de Gruyter; Berlin: 1981. pp. 353–402. [Google Scholar]
- Winfield DA, Gatter KC, Powell TP. An electron microscopic study of the types and proportions of neurons in the cortex of the motor and visual areas of the cat and rat. Brain. 1980;103:245–258. doi: 10.1093/brain/103.2.245. [DOI] [PubMed] [Google Scholar]
- Wu J, Okada YC. Physiological bases of the synchronized population spikes and slow wave of the magnetic field generated by a guinea pig longitudinal CA3 slice preparation. Electroenceph clin Neurophysiol. 1998;107:361–373. doi: 10.1016/s0013-4694(98)00098-4. [DOI] [PubMed] [Google Scholar]
- Wu J, Okada YC. Roles of a potassium afterhyperpolarization current in generating neuromagnetic fields and field potentials in longitudinal CA3 slices of the guinea-pig. Clin Neurophysiol. 1999;110:1858–1867. doi: 10.1016/s1388-2457(99)00138-8. [DOI] [PubMed] [Google Scholar]
- Wu J, Okada YC. Ca2+- and voltage-activated potassium conductances determine the waveform of neuromagnetic signals from hippocampal CA3 longitudinal slice of guinea-pig. Clin Neurophysiol. 2000;111:150–160. doi: 10.1016/s1388-2457(99)00207-2. [DOI] [PubMed] [Google Scholar]
Associated Data
This section collects any data citations, data availability statements, or supplementary materials included in this article.